Traders Reality Psy Levels/Daily Open GMT AwareTraders Reality Psy Levels/Daily Open GMT Aware
This indicator serves as the Tradingview equivalent of an MT4 indicator suite (Psy Levels and Daily Open)
Functionality:
In general we define Asia session to start with the Sydney exchange open.
For all intends and purposes for this indicator Asia session is defined as the open of the NZX market and close of the ASX market according to the 24 hour market clock.
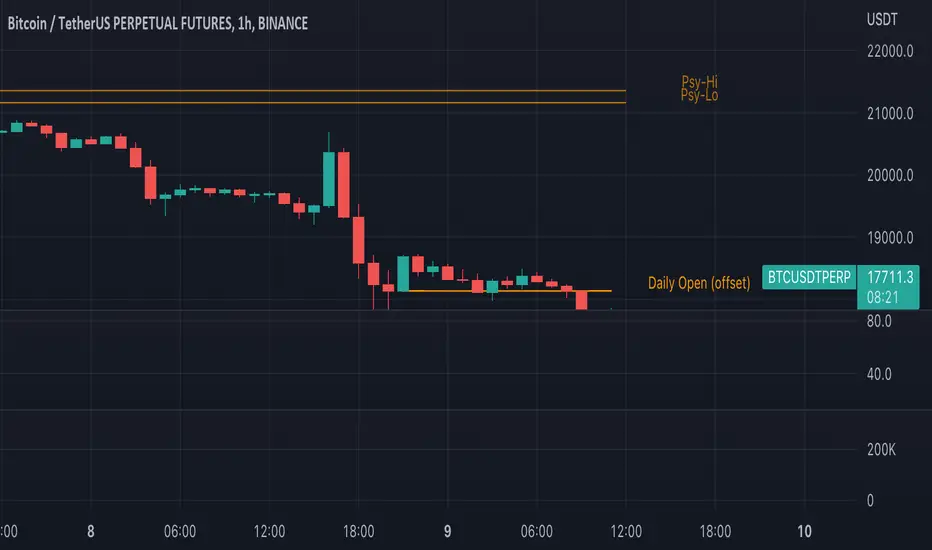
The Daily Open is defined as the open of the Asia session.
The Psychological High and Low are defined as the first high and first low the Asian session starting at Saturday night and going into Sunday morning.
These are 2 key confluences that can be used in various strategies. These are in some sense similar to pivot points.
The script is GMT ( UTC ) offset aware meaning you can adjust the start of the day to any point within the allowed GMT offsets (-12 to 14)
For example if your exchange timezone is UTC+0 then the start of the Asia session starts at 2000 (UTC+0) and ends at 0400 (UTC+0) when Sydney if not in DST
You will set the offset to 4. When Sydney is in DST you will set the offset to 3
Naturally since the offset allows the entire range of GMT offsets to be used you do not need to choose the Asia market as the start of the day.
The default setting is set to 4 as of Nov 1st 2021
The GMT offset puts the calculation in the correct place regardless of exchange timezone so you do not need to adjust any settings
when working with exchanges not on UTC+0
Psy levels works only on exchanges that are open on the weekends that provide with 24x7 data.
The GMT offset puts the calculation in the correct place regardless of exchange timezone.
Features:
1) Plot the current Daily Open for timeframes between 4 hour and 1 min.
2) Plot the current weekly Psychological High and Low for timeframes between 4 hour and 1 min.
3) Configurable GMT offset, default set to Sydney open (as defined above)
4) Toggle to show historical Daily Open values (line)
5) Toggle to show historical Psychological High and Low values (line)
6) Turn labels on and off
7) Change line/label colors
Foot notes:
Use at your own risk and your own responsibility. No guarantees are provided and no responsibility is assumed by the developers of this script.
Original @plasmapug, additional edits (with permission) by @infernixx and @Peshocore
INSECURITY() from @JayRogers (enhanced for gmt offset)
Cari dalam skrip untuk "daily"
TradingGroundhog - Fundamental Analysis - Multiple RSI Ema(Script Available Version of my previous Fundamental Analysis - Multiple RSI Ema )
As the number of crypto currencies is expanding, we need to find the one which will boom in the next months, weeks or even days.
Therefore, I present to you a Fundamental Analysis tool based on RSI built in order to compare the RSI between the diverse cryptocurrencies.
When cryptocurrencies start to trend, become active, minable and especially "buyable", people are investing their money into them.
As a result,the Daily RSI rises and the price of the crypto in question increases steadily.
With "Fundamental Analysis - Multiple RSI EMA" you can :
Follow up to 20 RSI from different exchanges at the same time.
Find easily Increasing/Decreasing RSI as the lines get transparent if their RSI decrease.
You can also select market with high potential of booming as :
Booming Market : 60 < Daily RSI <= 100 (Strong green background)
Potent Market : 55 < Daily RSI <= 60 (Light green background)
Sleepy Market : 50 < Daily RSI <= 55 (Light red background)
Dying Market : 0 < Daily RSI <= 50 (Strong red background)
Futur booming crypto will go from the Potent Market to the Booming Market
Can be used with the following time frames depending on the necessity:
4H
Daily (Preferred)
Weekly
Monthly
Good trades !
Disclaimer (As it should always be one to any script)
***
This script is intended for and only to be used for personal purposes only. No such information provided by it constitutes advice or a recommendation for any investment or trading strategy for any specific person. There is no guarantee presented or implied as to the accuracy of specific forecasts, projections, or predictive statements offered by the script. Users of the script agree that its original developer does not take responsibility for any of your investment decisions. Please seek professional advice before trading.
***

Financial Astrology Crypto ML Daily TrendThis daily trend indicator is based on financial astrology cycles detected with advanced machine learning techniques for the crypto-currencies research portfolio: ADA, BAT, BNB, BTC, DASH, EOS, ETC, ETH, LINK, LTC, XLM, XMR, XRP, ZEC and ZRX. The daily price trend is forecasted through this planets cycles (angular aspects, speed, declination), fast ones are based on Moon, Mercury, Venus and Sun and Mid term cycles are based on Mars, Vesta and Ceres. The combination of all this cycles produce a daily price trend prediction that is encoded into a PineScript array using binary format "0 or 1" that represent sell and buy signals respectively. The indicator provides signals since 2021-01-01 to 2022-12-31, the past months signals purpose is to support backtesting of the indicator combined with other technical indicator entries like MAs, RSI or Stochastic. For future predictions besides 2022 a machine learning models re-train phase will be required.
The resolution of this indicator is 1D, you can tune a parameter where you can determine how many future bars of daily trend are plotted and adjust an hours shift to anticipate future signals into current bar in order to produce a leading indicator effect to anticipate the trend changes with some hours of anticipation. Combined with technical analysis indicators this daily trend is very powerful because can help to produce approximately 60% of profitable signals based on the backtesting results. You can look at our open source Github repositories to validate accuracy using the backtesting strategies we have implemented in Jesse Crypto Trading Framework as proof of concept of the predictive potential of this indicator. Alternatively, we have implemented a PineScript strategy that use this indicator, just consider that we are pending to do signals update to the period July 2021 to December 2022: This strategy have accumulated more than 110 likes and many traders have validated the predictive power of Financial Astrology.
DISCLAIMER: This indicator is experimental and don’t provide financial or investment advice, the main purpose is to demonstrate the predictive power of financial astrology. Any allocation of funds following the documented machine learning model prediction is a high-risk endeavour and it’s the users responsibility to practice healthy risk management according to your situation.

EMA with time-interval dependant visiblity settingThis scrip exposes 4 Exponential Moving Average (EMA) indicators which their visibility can be set to a daily or weekly time-frame (aka intervals). Based on your current chart time-frame, the matching EMA indicators come on and off.
This helps to have meaningful EMAs relevant to your time internal.
In a traditional 10 EMA indicates a plotted indicator would bear a meaning of a 10 day EMA when in daily and 10 week EMA when in weekly chart which may or may not be useful as some who for example only require a 10 week EMA for thier analysis and wouldn't want to cloud a daily chart with an EMA which won't resemble a valuable output for this particular user.
With EMA+, you can choose to see the 10 week EMA only when your chart is in the weekly time interval, so when switched to a daily interval a 10x EMA is not shown anymore.
If you prefer to see a 10 week EMA and a 21 day EMA on the other hand, you will only have 1 EMA shown when in weekly mode which is a 10 week EMA and one EMA when in daily mode with is 21 day EMA.

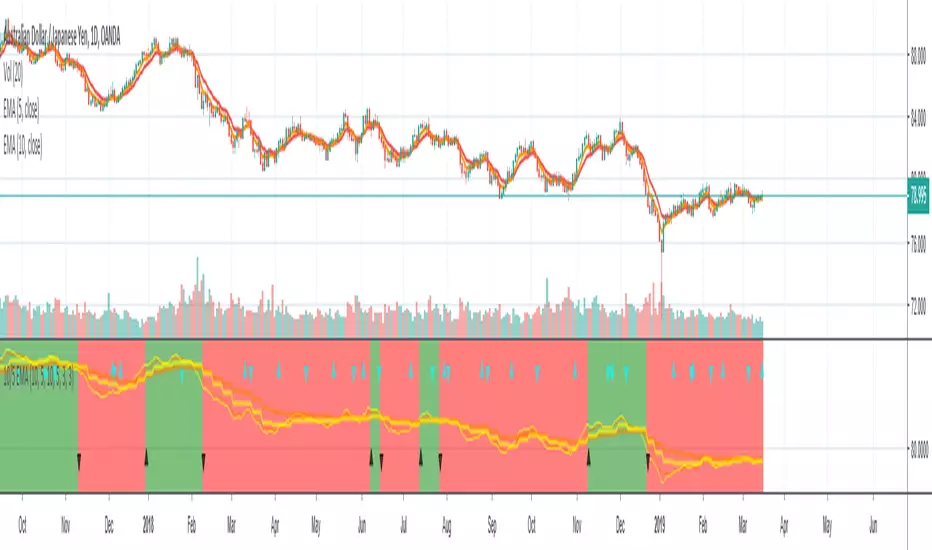
10/5 Weekly/Daily EMAs with ConfirmationsPlots Daily and Weekly 10 & 5 EMAs (but fully customizable to your own).
In addition to plotting the EMAs it color coordinates trend bias and has cross confirmation signals.
Philosophy and how to read:
I use this indicator when trading strictly on the daily timeframe. I have not tested it on other timeframes.
In my trade system I start with both the monthly and weekly charts to define overall bias.
Here’s the general rule of thumb.
10 EMA is direction (bias) and 5 EMA is price.
If 5EMA is below 10EMA there is a bear bias. If 5EMA is above 10EMA there is a bull bias.
This indicator will plot both the daily and weekly 10 & 5 EMAs.
It will also color code the background based on how these EMAs relate to each other.
Light red typically is just the daily is confirmed bear (typically because it could be either or)
Dark red, both daily and weekly in confirmed bear.
Light green, typically just daily is confirmed bull (typically because it could be either or)
Dark green, both daily and weekly in confirmed bull.
In addition to background highlight there is confirmation crosses.
The daily confirmation cross is default yellow triangle.
Down triangle is 5 crossing the 10 downward.
Up triangle is the 5 crossing the 10 upward.
The weekly confirmation is the same only is aqua color.
Generally, on a color change you want to see one or both confirmation in the direction of the bias change.
If you only want to plot the daily bias in the options unclick the setting: Include Weekly Background Plotting. Unclicking this will remove the background coloring for the weekly bias. This might be helpful if you only want to see the strength of what the weekly timeframe is telling you.
Also, I’m primarily a trend trader but I also do have a reversal system I trade with lower R:R parameters.
A good reversal confirmation signal I’ve noticed is the instrument that you are trading should go through a cycle of light color to dark color.
You could also create alerts with this indicator based on just signals. When the signal fires the value will be 1.
Future Updates:
I want to find some way to correlate the distance between these EMAs to enhance the signal. Also to include a velocity component. Plus a few more things.
If you like this indicator please like and leave a comment down below.
Binque's Multi-Moving Average Binque's Multi-Moving Average - One indicator with four simple moving average and four exponential moving averages, plus as a bonus a Day High moving average and a Day Low Moving Average.
Simple Moving Average or MA(14), MA(50), MA(100) and MA(200) all in one indicator
Exponential Moving Average or EMA(8), EMA(14), EMA(20) and EMA(33) all in one indicator
Day High Moving Average - Tracks the Daily High versus most moving averages track the daily close.
Day Low Moving Average - Tracks the Daily Low versus most moving average track the daily close.
To Disable moving averages, Set the color to the chart background and then set the length to 1 and uncheck.
I Use the Daily High Moving Average to track upward resistance in a stock movement for Swing Trading.
I Use the Daily Low Moving Average to track my trailing stop in a stock movement for Swing Trading.


PowerDays - Day of the Week HUDDescription: Midnight HUD & Daily Session Dividers
This indicator is designed to provide a clean, "Heads-Up Display" (HUD) for daily session tracking. It solves the common problem of cluttered charts by pinning the days of the week to the top of the chart window in a perfectly horizontal line, ensuring they remain visible and aligned regardless of price volatility or vertical scrolling.
Key Features:
Strict Midnight Dividers: Unlike standard "New Day" indicators that trigger at the exchange open (which can be 6:00 PM for some futures or forex pairs), this indicator plots a vertical dashed line at exactly 00:00 based on your chart's time zone.
Centered HUD Labels: Days of the week (MONDAY, TUESDAY, etc.) are plotted in a level horizontal row at the top of the pane. Labels are mathematically centered between midnight dividers to provide a clear visual of the current trading day’s range.
"Error-Proof" Architecture: Built using primitive plotting methods to avoid common Pine Script "Undeclared Identifier" errors, ensuring high compatibility across different TradingView versions and devices.
Fully Customizable: Includes a built-in color picker to adjust the Royal Blue labels and session dividers to match your specific chart theme.

ADR% - Average Daily Range % by TrinhDuongSMWThe ADR% (Average Daily Range Percentage) is a volatility measurement tool designed to help traders understand the typical price movement of a stock over a specific period. Unlike the standard ATR (Average True Range) which uses absolute price points, ADR% expresses volatility as a percentage of the stock's price, making it easier to compare volatility across different tickers regardless of their share price.

STDV Extension Zones from Daily Open - OnlyFlowSTDV Extension Zones from Daily Open
This indicator plots standard deviation extension zones based on the current day’s opening price. At the start of each trading day, it calculates the daily standard deviation using a configurable lookback and projects price zones at ±0.5 and ±1.0 standard deviations above and below the daily open.
Each zone is displayed as a horizontal band with a center line and a customizable thickness, extending forward throughout the session. Zones automatically reset and lock in place when a new day begins, preserving prior sessions for historical context.
The indicator is designed to visually highlight statistically significant price extensions relative to the daily open, helping users quickly identify areas where price may be stretched, balanced, or reacting around volatility-based levels.

HA EMA50 Trend Filter No Chop Daily Trade LimitsThis strategy trades strong directional moves using Heikin-Ashi candle confirmation and a 50-period EMA trend filter, while aggressively avoiding consolidation. Entries occur only after two consecutive Heikin-Ashi candles close in the same direction with price on the correct side of the EMA, and are further filtered using ATR-normalized volatility, range, EMA slope, and EMA cross-chop conditions to ensure the market is actively trending. Trades are executed at the open of the next candle, managed with structure-based or fixed stop losses, an optional break-even rule, and exited on Heikin-Ashi color reversal or protective stops. To protect capital and reduce overtrading, the strategy enforces strict daily limits, allowing a maximum of five trades per symbol and automatically stopping trading after two losing trades in a single day. Designed for forex markets during active sessions, this system prioritizes clean trends and capital preservation over frequent entries.

3Y Rolling Correlation vs SPY (Daily)Correlation vs SPY as measured by daily returns over the Trailing Three Years

NQ 5x Daily SessionsThis indicator automatically plots horizontal lines for the Daily Open as well as four of the most significant trading milestones of the day (CET/Berlin time). It helps you instantly identify psychological price levels and institutional opening marks directly on your chart.
Features:
Key Time Stamps: Automatic lines for the daily opening price and specific session opens at 08:00 (Frankfurt/Pre-Market), 10:00, 14:00, and 15:30 (NYSE Open).
Fully Customizable:
Control line thickness, label visibility, and the extension of current intraday lines via the settings menu.
Trading Application:
These levels often act as significant Support & Resistance during intraday trading. The 08:00 and 15:30 marks, in particular, frequently represent turning points or the start of strong trends, as trading volume spikes significantly during these windows.

Bias Daily 5.0Bias Daily Indicator with Breakout Alerts
Plots bullish, bearish, and consolidation bias levels based on previous daily candles. Alerts trigger when price breaks the previous daily high, low, or either, and bias lines show key levels on the chart.

Bias Daily 3.0Bias Daily Indicator with Breakout Alerts
This indicator plots bullish, bearish, and consolidation bias levels based on previous daily candles. It draws horizontal lines at prior candle highs and lows and lets you track momentum shifts visually.
It also includes flexible alerts:
Break previous candle high
Break previous candle low
Break either high or low
Perfect for spotting key breakout levels and identifying market bias across all intraday and higher timeframes. Fully customizable line colors, styles, and number of previous levels displayed.

BTC Spot CVD (Daily Reset) - Multi ExchangeThis indicator plots intraday Cumulative Volume Delta (CVD) for BTC spot markets across multiple major exchanges in a single pane, allowing quick comparison of relative buying/selling pressure throughout the day.
Exchanges / Pairs included
COINBASE:BTCUSD
OKX:BTCUSDT
BINANCE:BTCUSDT
BITFINEX:BTCUSD
KUCOIN:BTCUSDT
KRAKEN:BTCUSD
BYBIT:BTCUSDT
Each exchange is drawn as its own colored CVD line, and the right edge shows a live label with full symbol name + current CVD value.
How CVD is calculated (important)
TradingView spot feeds generally do not provide true aggressor-side trade data (buy vs sell).
This script uses a tick-rule estimate based on bar-to-bar price change:
If close > close → bar volume is treated as buying (+)
If close < close → bar volume is treated as selling (−)
If unchanged → 0
That signed volume is accumulated over time to form CVD.
Intraday reset
CVD resets at the start of each new trading day (based on the symbol’s daily session/day boundary on TradingView). This makes it easy to compare “today’s” flow across venues without long-term drift.
Units toggle: BTC vs USD
In settings you can switch:
BTC mode: CVD in BTC (base units)
USD mode: CVD converted to quote value using the bar’s price (BTC delta × price).
For USDT pairs, USD mode treats USDT as USD-like.
How to use
Add the indicator to any chart/timeframe.
Use the Inputs panel to show/hide specific exchanges.
Compare which venues lead/lag and where delta is strongest/weakest intraday.
Use the zero line as a quick reference for net positive vs net negative delta for the day.
Notes / limitations
This is an approximation of volume delta using OHLCV data, not true order-flow delta from trade prints.
Results can vary by timeframe because the tick-rule sign is derived from the bar close.

HTF Flip Close Levels, Daily Weekly Monthly TASHTF Flip Close Levels (D/W/M) — Support & Resistance Tool
This indicator automatically plots Daily, Weekly, and Monthly support & resistance levels based on higher-timeframe candle close behaviour.
🔹 What this tool does
The script detects HTF momentum flips using closed candles only:
Support is created when:
A red candle is followed by a green candle
The level is drawn at the close of the red candle
Resistance is created when:
A green candle is followed by a red candle
The level is drawn at the close of the green candle
This creates objective, rule-based horizontal levels derived purely from price behavior, not indicators.
🔹 Features
✅ Plots Daily, Weekly, and Monthly levels simultaneously
✅ Works on any timeframe (1m, 5m, 1H, Daily, Weekly, etc.)
✅ Keeps full historical levels, not just the most recent ones
✅ Optional auto-hide tapped levels (when price touches them)
✅ Tap detection:
Wick touch
or Close cross/touch
✅ Levels are always based on HTF candle closes, never wicks
✅ Designed to stay consistent across timeframe changes
🔹 How to use it (IMPORTANT)
This indicator:
❌ Does NOT predict market direction
❌ Does NOT generate buy/sell signals
❌ Does NOT tell you when to enter or exit
It is a context & confluence tool.
You should use these levels together with:
Market structure
Trend analysis
Volume / orderflow / CVD
Your own entry model
Your own risk management
Think of these levels as areas of interest, not automatic trade signals.
🔹 Best use cases
Confluence with:
Local support/resistance
VWAP / Anchored VWAP
Range highs/lows
Liquidity zones
Reversal or continuation patterns
Identifying:
HTF reaction zones
Decision points
Areas where other traders are likely watching
⚠️ Disclaimer
This indicator is a technical analysis tool only.
It is NOT financial advice.
It does NOT guarantee profits.
All trading decisions and risk are your responsibility.
Use it as part of a complete trading system, not as a standalone strategy.

60D Daily Anchored Quadrants + 12M FibJAO 60D Daily Anchored Quadrants + 12M Fib
Use for projecting 5YR 1YR Highs/Lows based on previous range deviations.
Use 60 Day look back to gain insight on narrative whether price is in a premium/discount and or use PDA that line up with levels for true support/resistance areas

Live Daily HA Background (RTH)This indicator paints the backsground with the daily heikin ashi color


FDAX Session Levels (Daily open, 10:00, 14:00)Automated intraday levels for FDAX/DAX traders based on the Europe/Berlin timezone
Monitored Levels:
Daily Open (DO): Midnight open price (00:00 CET).
08:00 CET: Frankfurt session start.
10:00 CET: Morning trend establishment.
14:00 CET: Pre-US session liquidity shift.
Visibility: Clearly labeled levels with adjustable line thickness (Width 3).
Extend Logic: Toggle between infinite lines or session-only historical views.
Precision: Synced with Eurex trading hours.
Ideal for: Identifying intraday Support/Resistance and S/R flips on 1m to 15m timeframes.
