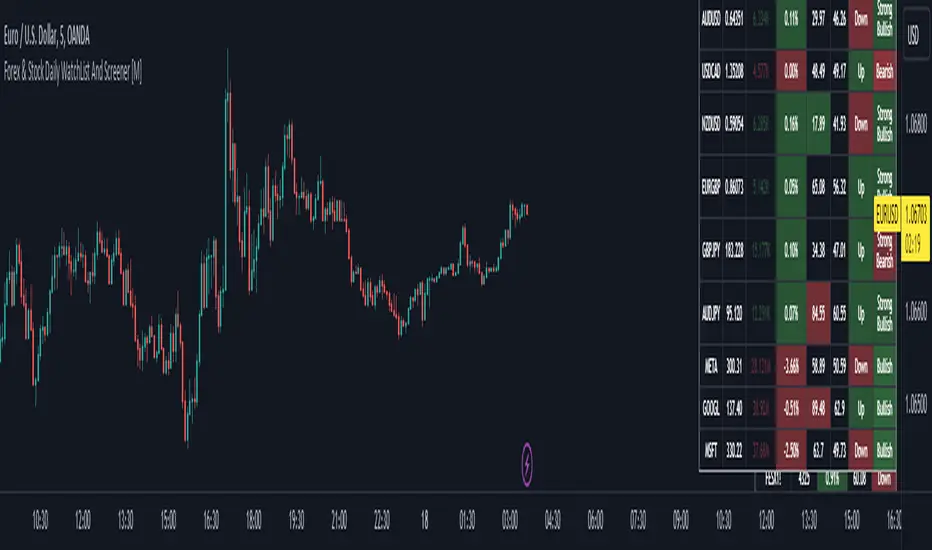
Forex & Stock Daily WatchList And Screener [M]Hi, this is a watchlist and screener indicator for Forex and Stocks.
This indicator is designed for traders who trade in the forex markets and monitor developments in indices and other currency pairs.
It includes information on 14 indices such as the volatility index, Baltic dry index, etc. You can customize the indices as you wish. The indices table contains the index's price (or points), daily change, stochastic value, and trend direction.
The second table is designed for trading forex and stock currency pairs.
In this table, you will find information such as price, volume, change, stochastic, RSI, trend direction, and MACD result for all traded pairs. You can customize all the currency pairs in this table as you wish, and you can also tailor the oscillator settings to your preferences.
In the settings section, you can use checkboxes to hide the pairs in both tables.
The "Customize" section in the settings allows you to personalize the table appearances according to your preferences.
Cari dalam skrip untuk "daily"
OBV Daily High Low Box Realtime (On Balance Volume)Overview
This indicator plots horizontal lines at the daily high and low levels of the On Balance Volume (OBV).
The numerical lines for each day are updated in real-time as the OBV high and low values change.
Please note that there are limitations on how far back in history the indicator can go due to Pine Script's object drawing limitations.

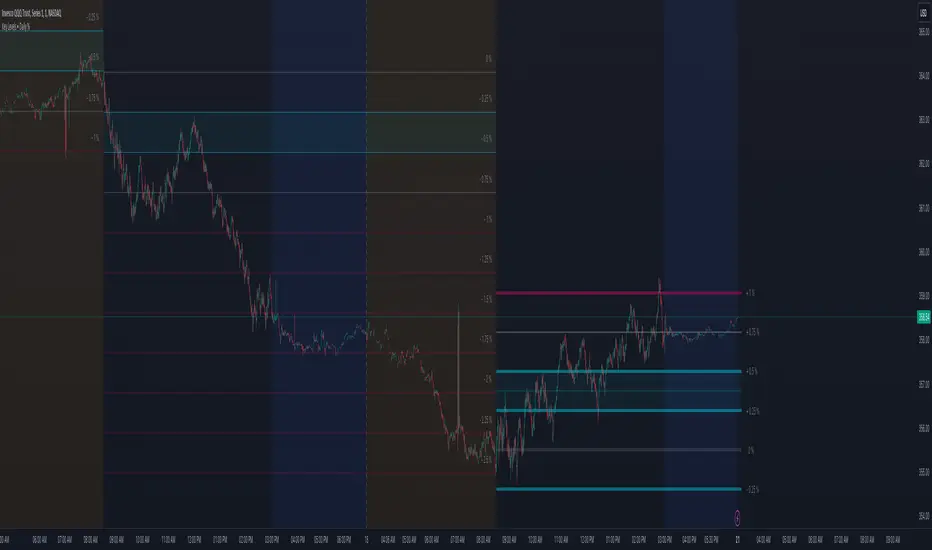
Key Levels (Daily Percentages)OVERVIEW
This indicator automatically identifies and progressively draws daily percentage levels, normalized to the first market bar.
Percentages are one of the most common ways to measure price movement (outside price itself). Being able to visually reference these levels helps contextualize price action, in addition to giving us a glimpse into how algos might "see" the market.
This script is most useful on charts with smaller time frames (1 to 5 minutes). This is not ideal for medium or larger time frames (greater than 5 minutes).
INPUTS
You can configure:
• Line size, style, colors and maximum length
• Label colors and visibility
• Fractional and intra level visibility
• Bidirectional zone parameters (custom range and extended anomalies)
• Normalization source
• Price Proximity features
• Market Hours and Time Zone
INSPIRATION
Broad Assumptions:
• +/- 70% of days move 1%, 20% of days move 1-2%, and 10% of days have moves exceeding 2%.
• +/- 10-20% of days trend, with moves ≥ 1%.
• All trading strategies are effectively scalping, mean reversion, or trend.
• Humans program algos to capitalize on these assumptions, using percentages to mange / execute trades.
MarketSmith Daily Market IndicatorsMarketSmith Daily Market Indicators is designed to mimic the Daily Market Indicators tab found in MarketSmith. This tab contains 4 different secondary indicators to help gauge the health of the overall market.
This indicator allows you to choose which of the 4 indicators to show, as well as which index to pull data from, Nasdaq or NYSE. There is also a snapshot table showing the following:
# of stock advancing and up volume
# of stocks declining and down volume
# of stock unchanged and unchanged volume
# of stocks making new highs and new lows
Now let's look at the 4 indicators and how they work.
Advance/Decline Line
Plots the number of advancing shares vs the number of declining shares. Heavily weighted index stocks can skew price action, this line helps reveal that and whether most stocks are aligned with the trend.
Short Term Overbought/Oversold Oscillator
A 10-day moving average of the number of stocks moving up in price less the number of stocks moving down in price.
10 Day Moving Average of Up & Down Volume
Two 10 day moving averages to represent the volume of all stocks. Blue line: total volume of all stocks moving up in price. Red line: the total volume of all stocks moving down in price.
10 Day Moving Average of New Highs & New Lows
Two 10-day moving average to represent stocks making new highs and new lows. Blue line: The number of stocks making new price highs. Red line: The number of stocks reaching new lows.
Note this indicator is designed to work on a daily time frame chart. Data typically updates 90 minutes after the close. Data may differ from Marketsmith due to different providers, however the general trends are the same.

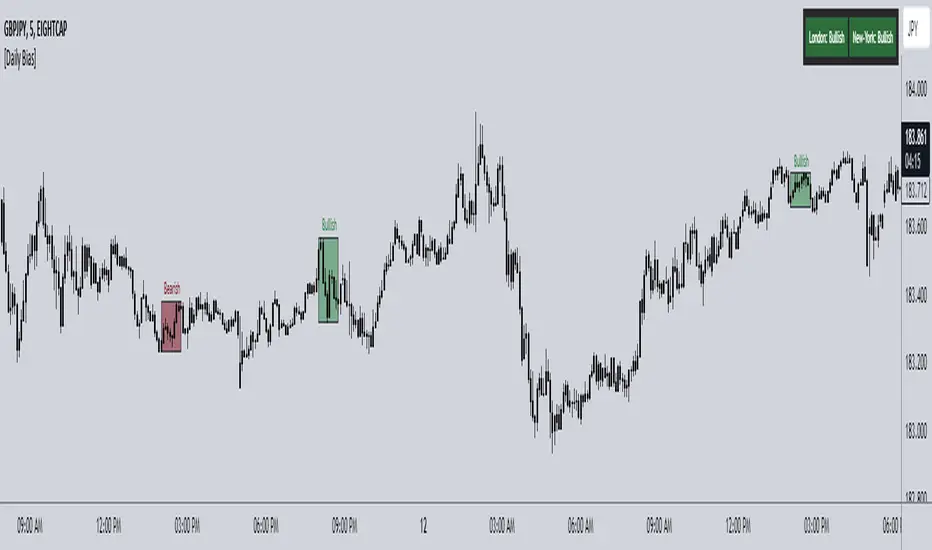
ICT Daily Bias Finder [DTCC]What is This?
The ICT Daily Bias Finder uses a method called "DTCC" to identify the London and New York session's bias, bullish or bearish. This indicator should only be relied on for 5 minute, and not other timeframes.
How do I use it?
Look at the previous days two boxes (labeled DTCC Bear/DTCC Bull), if both are bullish or both are bearish it is NOT recommended to rely on DTCC for that day. If the first one is bullish and second one is bearish, the DTCC for the next day says that London session will turn ABOVE midnight opening price, while New York will turn UNDER midnight opening price (longs in London, shorts in New York). If the second one is bearish and the first is bullish, the DTCC for the next day says that London session will turn UNDER midnight opening price, while New York will turn ABOVE midnight opening price (shorts in London, longs in New York)
Emoji guide to DTCC indicator:
🟢🟢: Don't trust DTCC for that day
🔴🔴: Don't trust DTCC for that day
🟢🔴: Longs in London above Midnight Opening Price, Shorts in New York under Midnight Opening Price
🔴🟢: Shorts in London under Midnight Opening Price, Longs in New York under Midnight Opening Price
Reminder: NEVER rely solely on DTCC, DTCC can be wrong and is not right 100% of times.
Relative Daily Change% by SUMIT
"Relative Daily Change%" Indicator (RDC)
The "Relative Daily Change%" indicator compares a stock's average daily price change percentage over the last 200 days with a chosen index.
It plots a colored curve. If the stock's change% is higher than the index, the curve is green, indicating it's doing better. Red means the stock is under-performing.
This indicator is designed to compare the performance of a stock with specific index (as selected) for last 200 candles.
I use this during a breakout to see whether the stock is performing well with comparison to it`s index. As I marked in the chart there was a range zone (red box), we got a breakout with good volume and it is also sustaining above 50 and 200 EMA, the RDC color is also in green so as per my indicator it is performing well. This is how I do fine-tuning of my analysis for a breakout strategy.
You can select Index from the list available in input
**Line Color Green = Avg Change% per day of the stock is more than the Selected Index
**Line Color White = Avg Change% per day of the stock is less than the Selected Index
If you want details of stocks for all index you can ask for it.
Disclaimer : **This is for educational purpose only. It is not any kind of trade recommendation/tips.

High Volume Daily Warning Signal- Jesse Livermore // values are in %, so on right Y axis a value of 50 means 50% above the average volume of set length (default of 20)
These important confirming volume spurts often end the day with a 50 percent to 500 percent increase in the average daily volume of the stock. - Jesse Livermore
when daily volume increases by 50% of it average daily volume, it is a warning sign in the possible change of trend or pivotal point
you can select horizontal levels of interest

ATR Daily BandThis indicator draws an upper and lower band for each day. It uses the Average True Range calculation (with configurable lookback) and places the band at 1ATR above and 1ATR below the daily open.
I use this indicator as a simple gauge to tell how significant price movement is, and get a feel for the daily volatility. Due to the fractal nature of price action, it can be difficult to determine if a price movement is significant while zoomed in on a single intraday chart. Using this indicator, I can tell if the price action is approaching the ATR or if it's just staying within the band.
Strategies: Useful for both mean reversion and momentum strategies. It's up to you to decide how this metric will fit into your trading strategy. I currently use this indicator to look for mean reversion setups, but that is due to the current market conditions and my personal trading style.

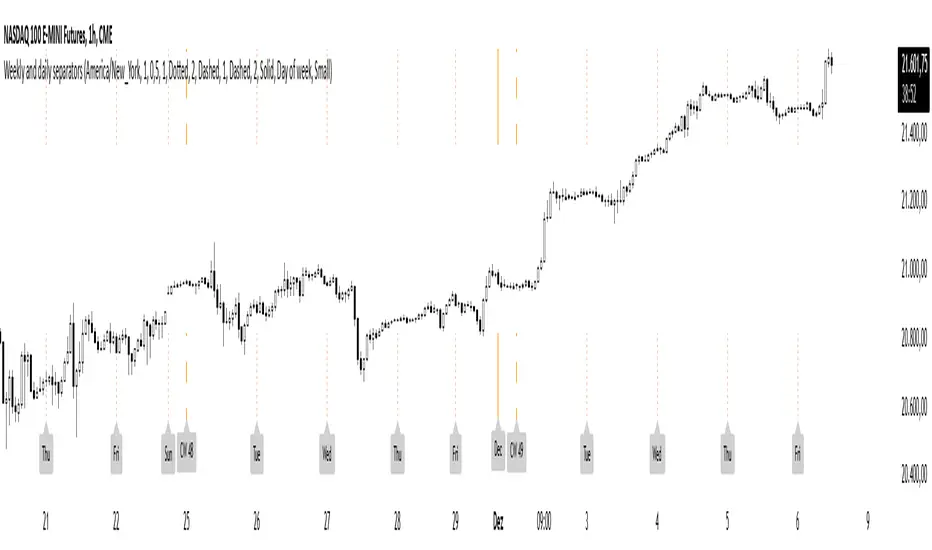
Weekly and daily separatorsThis script plots vertical line between each trading week (thick, solid) and smaller lines (dotted) between each trading day. This helps kepping a better overview on the aspect of time on the higher timeframes below 1D. The distance of the lines to the top and bottom of the chart is controlled by your chart settings menu under Appearance -> Margins.
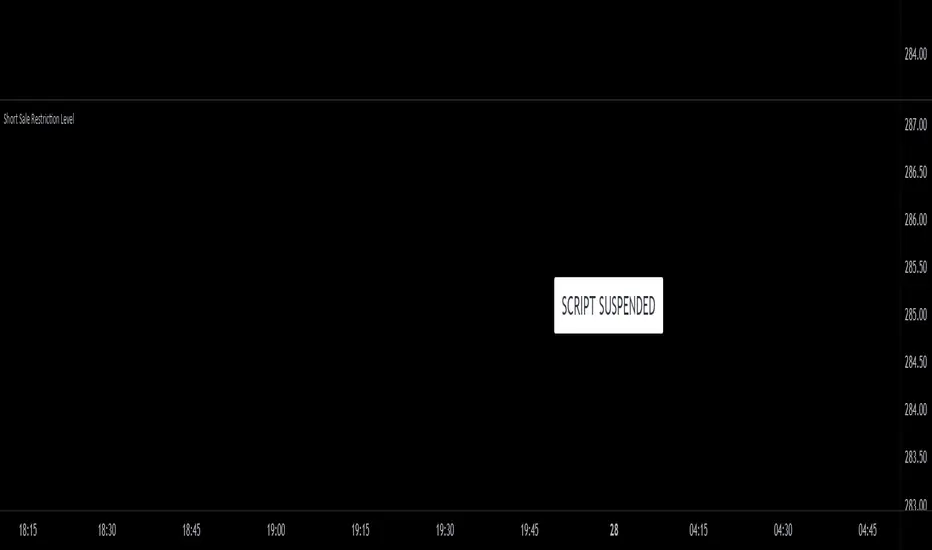
Short Sale Restriction (SSR) Level - Intraday and daily chartsThis script plots the Short Sale Restriction (SSR) Level relative to the previous day's closing price. It works on any time frame from 1 minute to daily, showing the correct level even during the extended session.
The Short Sale Restriction (SSR) is a rule of the Securities and Exchange Commission (SEC) that restricts traders from short-selling stocks that are rapidly decreasing in value in an attempt to profit from the price drop. The rule was introduced in 2010, after the 2008 financial crisis, to prevent market manipulation and excessive volatility.
The SSR works as follows: when the price of a particular stock drops 10% compared to the previous day's closing price, the SSR is triggered and a temporary limitation is imposed on traders' ability to short-sell that stock for the rest of the trading day and the following day. During the SSR activation period, traders can still short-sell, but only if the sale is "covered" by another long position on the same stock.
Knowledge of the SSR level is especially important for day traders because it helps them to plan their trading strategies in advance, avoiding situations where short-selling becomes more difficult. Additionally, if a stock has exceeded the SSR threshold, traders can expect an increase in price volatility.
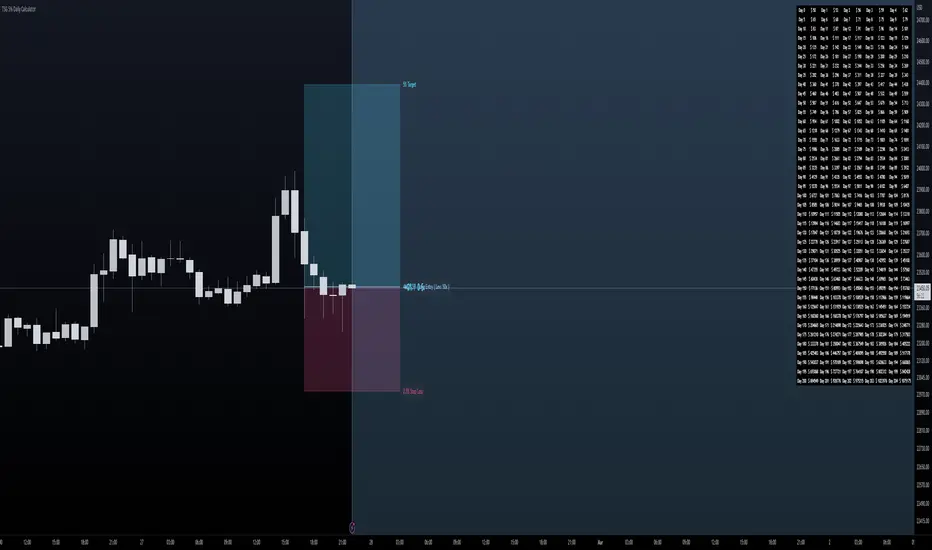
TSG 5% Daily CalculatorThis is a calculator I've created to help visualize Target and Risk Levels based on leverage use to trade crypto.
How to use it ?
Basic Use:
- Set the Direction of your trade - either Long or Short
- Set the Leverage you use in your trade - it is crutial to define the risk and target levels
- Set the Risk Amount you want to risk (in %) of your total balance ( Advised 2-3% )
- Set the Target Amount you want to profit at the target (the idea of this is 5% daily, so 5%).
- Set Entry Price if you have opened a position, and you will visually see your progress. Otherwise the levels will be adjusted to the Close of the candle.
Additions:
- Set your Initial Balance - to help you visualize on the Table your progress
- Set your Current Balance - for visualization purposes on ongoing trades and on the Table
- Entry Date - Advised to set it when you open a trade - you will be tracking the progress of your trade since the candle on which you opened it
- Show Table - to show the table of 5% daily and the target it is set on per day
- Table Size - Set table to be small or normal
- Together with the Table you have a big blue area behind that ends on the day you will become a Millionaire based on the Initial Balance, Current balance and Target % in your inputs
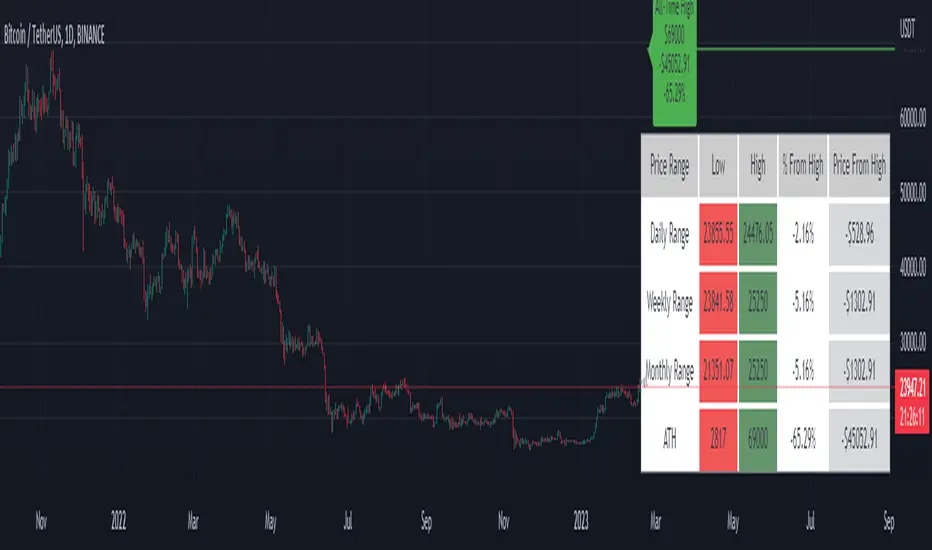
Price Range Tracker D/W/M + ATHIntroducing the Price Range Tracker - it's a tool for monitoring the price of any coin or stock. This indicator provides up-to-date information on the daily, weekly, monthly, and all-time high (ATH) prices of your selected asset.
With the Price Range Tracker, you can easily gauge how far your asset's current price is from its highest point in the daily, weekly, or monthly range. Additionally, it keeps track of the ATH of any coin, providing you with a clear understanding of your asset's historical performance.
This tracker also plots the ATH on the main chart as a label, ensuring that you are always aware of the highest point your asset has reached.
While this tool is a valuable asset for analyzing price trends, it is important to note that past performance may not always indicate future results. Market conditions can change rapidly, and strategies that have been successful in the past may not perform as well in the future. As such, it is essential to use the Price Range Tracker in conjunction with your own research and knowledge.
Please let me know if you find any bugs or would like things adding to the tracker
Finally, please note that this post and the accompanying script do not provide any financial advice. The information provided is for educational purposes only, and you should always consult a financial advisor before making any investment decisions.
Moon Phases + Daily, Weekly, Monthly, Quarterly & Yearly Breaks█ Moon Phases
From LuxAlgo description.
Trading moon phases has become quite popular among traders, believing that there exists a relationship between moon phases and market movements.
This strategy is based on an estimate of moon phases with the possibility to use different methods to determine long/short positions based on moon phases.
Note that we assume moon phases are perfectly periodic with a cycle of 29.530588853 days (which is not realistically the case), as such there exists a difference between the detected moon phases by the strategy and the ones you would see. This difference becomes less important when using higher timeframes.
█ Daily, Weekly, Monthly, Quarterly & Yearly Breaks
This indicator marks the start of the selected periods with a vertical line that help with identifying cycles.
It allows to enable or disable independently the daily, weekly, monthly, quarterly and yearly session breaks.
This script is based on LuxAlgo and kaushi / icostan scripts.
Moon Phases Strategy
Year/Quarter/Month/Week/Day breaks
Month/week breaks

Buy Sell Calendar [LuxAlgo]The Buy Sell Calendar indicator displays a calendar showing the sentiment for the current day/month. Three different methods can be used to determine this sentiment.
The calendar can also highlight the percentage of bullish days/months for a month/year.
🔶 SETTINGS
Frequency: Calendar frequency, options include "Daily" and "Monthly"
Sentiment Method: Method used to determine the sentiment for the day/month, options include: "Linreg", "Accumulated Deltas", and "Max/Min"
Timezone Offset: UTC time zone offset.
Limit Date: Limit date used by the calendar, the sentiment of days/months outside this limit will not be returned.
🔹 Calendar
Show Calendar: Determines whether to display or hide the calendar.
Location: Location of the calendar on the chart.
Size: Calendar size.
🔶 USAGE
The proposed script can allow users to quickly determine if a specific day/month is considered bullish or bearish. A green cell is used for bullish days/months, while a red one is used for bearish days/months.
Additionally vertical lines are displayed on new days/months with a color highlighting the current sentiment for this specific day/month. Note that this is done retrospectively, the color of a line set at time t might differ at time t+n .
🔶 SENTIMENT METHODS
Determining whether a day/month is bullish or bearish can be done using three different methods. Note that each method makes use of the closing price as the input, and as such can eventually return different results depending on the selected timeframe. Each method is described below:
🔹 Linreg
The Linreg method fit lines between each day/month using the method of least squares and determines if that particular day is bullish or bearish based on the line slope sign. For example, a rising line would indicate a bullish day/month.
🔹 Accumulated Deltas
The method of accumulated deltas simply accumulates bullish and bearish price changes for the current day/month, the result with the highest magnitude determines the sentiment for that day/month.
🔹 Max/Min
The max/min method computes a trailing maximum and a trailing minimum for the current day/month. The sentiment is determined by the price position relative to the average between the obtained maximum/minimum, with a bullish sentiment being determined if price is above the average.

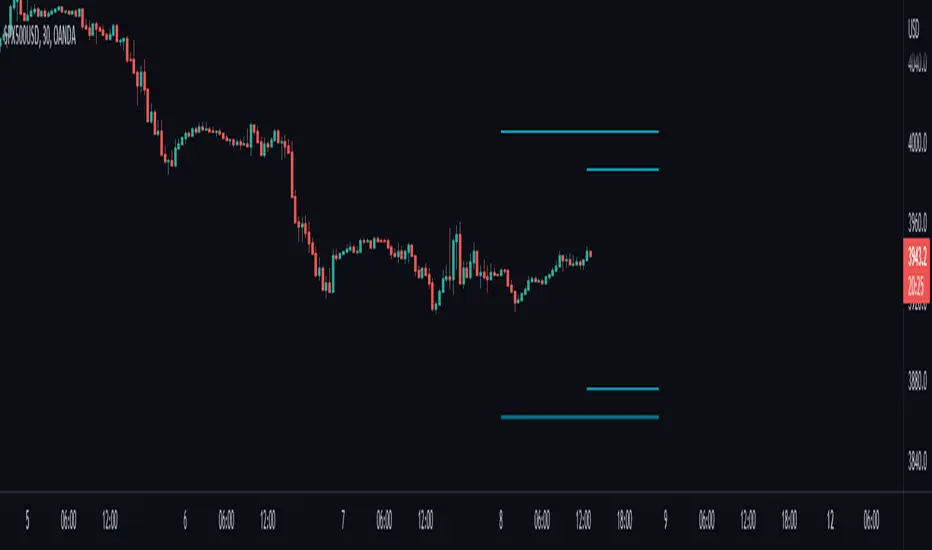
Average Daily Range Expansion Remaindeer for DaytradingThis indicator shows how much will the price need to go to fill its Average Daily Range based on the last 5 days (before today).
5-day ADR is used in concepts by ICT, Poltoratskiy and number of others.
Generally speaking, we would like to enter when there is a lot of room for price movement.
Outer lines are a full expansion. If the price moves only upside from the opening bell, it will reach as far.
Inner lines are a remaining expansion required to hit ADR. If the price initially moves in one direction and then reverses, this drip is substracted. This is more important metric!
Average Daily Range% for DaytradingThis indicator shows how many Average Daily Ranges was covered in today's move.
Average Daily Range is always calculated based on the last 5 previous days (before current day).
Tables show:
► How many % of days exceed their ADR.
► How many days in a row did the range remain lower than 5 Day ADR
► How much is already covered by today's move.
It is designed for Daily chart, don't try to use it elsewhere.

[Pt] Daily Market Profile / TPOA great mentor of mine once told me, trading is like driving. When you are driving, there are directions and road signs to follow. The key areas and levels from TPO market profile are the road signs in trading, you shouldn't trade without them much like you shouldn't drive without road signs, as you will get lost.
From Wikipedia: "A Market Profile is an intra-day charting technique (price vertical, time/activity horizontal) devised by J. Peter Steidlmayer, a trader at the Chicago Board of Trade (CBOT), ca 1959-1985. Steidlmayer was seeking a way to determine and to evaluate market value as it developed in the day time frame. The concept was to display price on a vertical axis against time on the horizontal, and the ensuing graphic generally is a bell shape--fatter at the middle prices, with activity trailing off and volume diminished at the extreme higher and lower prices." If you are unfamiliar with the concept, search for Market Auction Theory, Market Profile, and TPO on the web.
What's cool about this script?
As a professional trading, you should be drafting a trading plan and drawing all your key areas and levels before entering a trade. If you are trading with market profile, with this script, you no longer have to spend the time it takes to manually draw those key areas and levels. All are automatically generated with this script to give you the visual cues in your trades~!!
**IMPORTANT** Please note that due to the limitation on TradingView, there can only be limited number of boxes and lines that can be generated per indicator. Hence, this script only aims to provide you with as many key areas and levels as possible. This may be mitigated by having multiple instances of this indicator. Please use at your risk and discretion.
This script provides a comprehensive set of indicators / elements of daily TPO market profile, which includes the following:
- Market Profile based on TPO
- Point of Control (POC)
- Value Area (VA)
- Single Prints (SP)
- Excess (EX)
- Naked vs Visited (Touched) POC and VA
This script also includes the following key features that hopes to provide value in your trading:
- Automatically generated key areas and levels, including all the elements above
- Those key areas and levels will fade away as they become less significant, based on number of crosses and touches
- Customizable display settings
- Customizable session for generating the MP
- Two positions for MP placement
Setting descriptions:

Herrick Payoff Index DailyModified to include new daily open interest from CME futures contracts versus old script that only captured weekly data from commitment of traders data. Script can now be used on monthly and continuous contract traded on CME.

VWAP & Previous VWAP - MTF█ Volume Weighted Average Price & Previous Volume Weighted Average Price - Multi Timeframe
This script can display the daily, weekly, monthly, quarterly, yearly and rolling VWAP but also the previous ones.
█ Volume Weighted Average Price (VWAP)
The VWAP is a technical analysis tool used to measure the average price weighted by volume.
VWAP is typically used with intraday charts as a way to determine the general direction of intraday prices.
VWAP is similar to a moving average in that when price is above VWAP, prices are rising and when price is below VWAP, prices are falling.
VWAP is primarily used by technical analysts to identify market trends.
█ Rolling VWAP
The typical VWAP is designed to be used on intraday charts, as it resets at the beginning of the day.
Such VWAPs cannot be used on daily, weekly or monthly charts. Instead, this rolling VWAP uses a time period that automatically adjusts to the chart's timeframe.
You can thus use the rolling VWAP on any chart that includes volume information in its data feed.
Because the rolling VWAP uses a moving window, it does not exhibit the jumpiness of VWAP plots that reset.
For the version with standard deviation bands.
MTF VWAP & StDev Bands


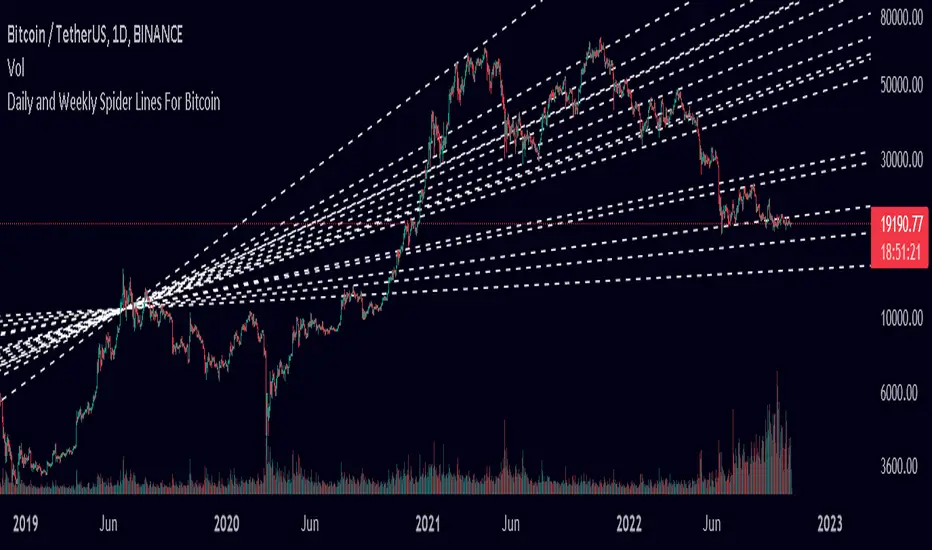
Spider Lines For Bitcoin (Daily And Weekly)I haven't seen any indicator do this, so I decided to publish this to form automatic Spider Charts without actually going through the effort of drawing them!
This script charts dotted lines (spider lines) all over, depicting support and resistance levels.
It works by connecting some candles from the 2018 bear market to the candle from 1st July 2019, followed by extending the lines to the right, making support and resistance levels for the future. The script works only for the daily and weekly charts for Bitcoin.
The levels are accurate to a good extent.
If the lines don't load, zoom out until the 2018 bear market top and it should load then.
Have fun with this indicator!
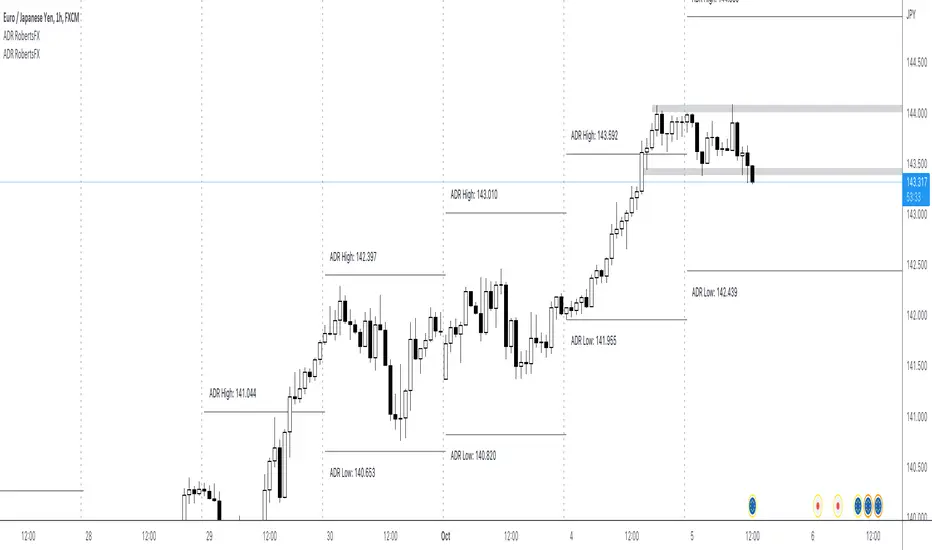
ADR - Average Daily Range RobertsFXThe most overlooked indicator in trading. Average daily range shows you how far the price will move today if moved as on average. It's a great tool to calculate take profits to close within the same day.
[TTI] IBD Market School––––History & Credit
This is a game-changer! Fully based on the Market School Home Study Program (Retail Price $1,500), the script takes the strict, rule-based market timing system developed by Investor's Business Daily and makes it into a easy to ready automated indicator. So that you take the ego and emotions out of the equation!
Over the years, many investors have been asking for a highly specific, quantitative method to assist them in navigating the market, stating that their existing system is too qualitative in character and focused too heavily on feel rather than predetermined principles.
The IBD Market School develops a common sense strategy that will help you enter every major market uptrend and prevent you from entering every major market downtrend/ You will discover the crucial market cues you need to pay attention to in order to manage your account with this indicator.
–––––What it does
The indicator uses 10 buys signals that will get you into the market rally early and 14 sell signal that reduce your market exposure before a downtrend.
👉 Buy Sell signals
Follow Through Days and Failed Rally Attempts
Rules around the 21-Day Moving Average
Rules around the 50-Day Moving Average
Strength and Weakness Rules
Downside Reversals
Distribution Rules
👉 Investment Allocation Rules
Recommended Portfolio Market Exposure at any given time
Buy Switch
Restrain Rules
Power-Trend
–––––How to use it
The combination of the Buy and Sell rules, together with the portfolio management rules, make sure that you are in line with the market trend The Market Exposure box gives information on the Recommended % of total portfolio exposure, that is recommended at any given time. The proliferation of Sell rules indicate danger and the Buy Switch, Restraint Rule and Power Trend indicate show how strong or weak are the current market rallies.
The indicator can be applied on any major market index.
