Daily Bias Panel (with MTF Toggle)Daily Bias Panel Documentation
Overview
The Daily Bias Panel is a TradingView indicator designed to provide a structured, multi factor assessment of market direction for intraday and swing traders. It consolidates several key bias components—Prior Day levels, VWAP, Overnight High/Low, Multi Timeframe Market Structure, and an Overall Bias—into a clean, compact table. A confidence meter summarizes the combined strength of all signals.
This document explains each line item, the rules behind it, and how to interpret the panel.
1. Prior Day Bias
Definition
Compares the current price to the previous day’s high and low.
Rules
• Bullish (1): Close > Prior Day High
• Bearish (-1): Close < Prior Day Low
• Neutral (0): Price is between the prior high and low
Interpretation
This bias reflects whether the market is breaking out above or below the previous day’s range. It is a foundational directional signal.
2. VWAP Bias
Definition
Measures whether price is trading above or below the Volume Weighted Average Price.
Rules
• Bullish (1): Close > VWAP
• Bearish (-1): Close < VWAP
• Neutral (0): Price is at VWAP
Interpretation
VWAP is a widely used institutional benchmark. Trading above VWAP suggests buyers are in control; below VWAP suggests sellers dominate.
3. ONH / ONL Bias (Overnight High / Low)
Definition
Tracks the overnight session’s high and low (18:00–09:30 ET) and compares current price to those levels.
Rules
• Bullish (1): Close > Overnight High
• Bearish (-1): Close < Overnight Low
• Neutral (0): Price is inside the overnight range
Interpretation
ONH/ONL is extremely important for index futures (ES/NQ). Breaking ONH/ONL often signals strong directional intent at the RTH open.
4. Struct MTF (Market Structure Bias)
Definition
A weighted blend of market structure trends across multiple timeframes.
Modes
Swing Mode
• 4H (50%)
• 1H (30%)
• 15M (20%)
Intraday Mode
• 1H (40%)
• 15M (35%)
• 5M (25%)
Rules
Each timeframe is classified as:
• Bullish (1): Higher High + Higher Low
• Bearish (-1): Lower High + Lower Low
• Neutral (0): No clear structure
The weighted average produces a final structure score.
Interpretation
This is your trend engine. It smooths noise and provides a stable directional backbone.
5. Overall Bias
Definition
A strict agreement filter between Prior Day Bias and VWAP Bias.
Rules
• Bullish (1): Both Prior Day and VWAP are bullish
• Bearish (-1): Both are bearish
• Neutral (0): Any disagreement
Interpretation
This prevents false positives by requiring alignment between two major bias components.
6. Confidence Score
Definition
A weighted blend of all bias components:
• Prior Day (25%)
• VWAP (25%)
• ONH/ONL (20%)
• MTF Structure (30%)
Output
A normalized score between -1.00 and +1.00.
Interpretation
• +1.00: Strong bullish alignment across all systems
• -1.00: Strong bearish alignment
• 0.00: Mixed or unclear conditions
7. Confidence Meter (10 Square Visual)
Definition
A visual representation of the confidence score.
Rules
• 0–10 squares filled based on absolute confidence
• Color reflects direction (green/red/yellow)
Interpretation
A quick glance gauge of trend strength.
8. Debug Mode (Optional)
Purpose
Displays all underlying levels and bias markers directly on the chart.
Includes
• Prior High / Low
• VWAP
• ONH / ONL
• Confidence Score line
• Bias markers (P, V, O, M)
Use Case
Great for verifying logic, backtesting visually, and understanding how each component behaves.
9. Panel Layout & Spacing
Top Left Spacer System
When the panel is placed in the top left corner, a 3 row spacer pushes it below the chart header and indicator dropdown.
Panel Size Options
• Small
• Medium
• Large
These adjust font sizes and meter padding.
______________________________________________________________________________
Summary
The Daily Bias Panel is a compact, multi factor decision tool that blends:
• Prior Day context
• VWAP positioning
• Overnight session dynamics
• Multi timeframe trend structure
• A strict overall bias filter
• A confidence scoring engine
Together, these components give traders a clear, structured view of market direction and strength.
This documentation should serve as a complete reference for understanding, using, and publishing the indicator.
Cari dalam skrip untuk "daily"


Objective Daily Bias Seasonality
The Universal Daily Seasonality indicator is a statistical tool designed to analyze and visualize price performance patterns based on the day of the week. It helps traders identify historical tendencies (seasonal bias) for any given asset by processing daily data independently of the current chart timeframe.

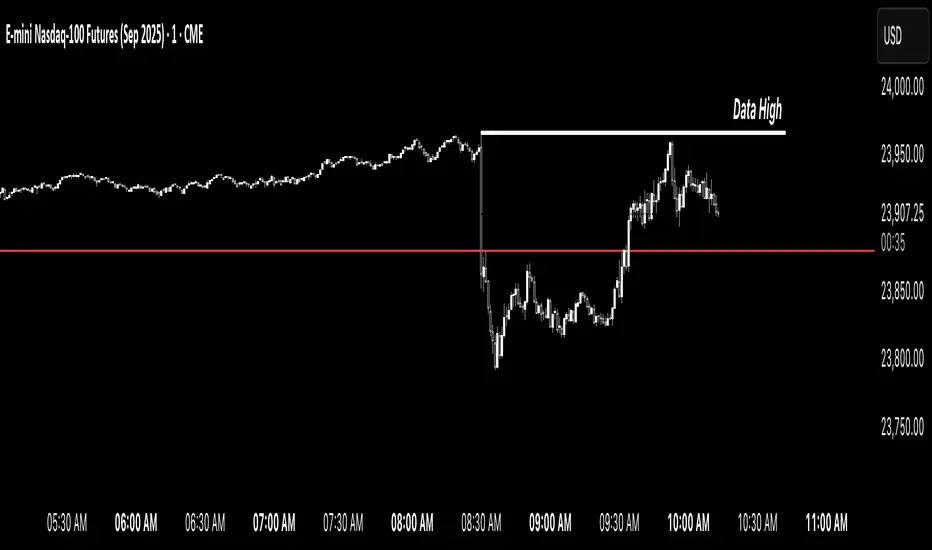
Daily Inputs - The Prometheus InitiativeDaily ES inputs from the Prometheus Initiative is a clean, customizable overlay indicator designed specifically for ES (S&P 500 E-mini futures) day traders who rely on manually selected key price levels each session.
Instead of spending time manually drawing horizontal lines every day, this tool lets you quickly input the daily price levels directly in the settings and instantly see them plotted as horizontal lines across your chart.
Key Features:
• 15 fully editable price inputs with customizable settings.
Why this indicator was created:
Manually drawing 10–15 lines each morning is time-consuming. This indicator was developed to eliminate that friction — allowing fast, accurate plotting of levels so you can focus on execution rather than drawing tools. The largest benefit is that you can toggle the indicator on/off to keep a clean chart as to not interfere with your existing visual levels.
Perfect for:
- ES / NQ futures traders
- Anyone who wants a clean, no-nonsense way to visualize custom horizontal levels
How to use:
1. Add to your chart
2. Open Settings → Enter the daily levels provided
3. Watch price interact with the levels!
Note: This is a manual input tool. Levels do NOT auto-calculate. It's meant to reflect the exact levels posted each day.
Happy trading! 📈
Feel free to leave feedback or suggestions in the comments.
Disclaimer: This indicator is for educational/visual purposes only. Trading futures involves substantial risk of loss and is not suitable for all investors.

Daily Trend Scanner Plus█ DAILY TREND SCANNER PLUS
A professional-grade trading indicator designed to help traders quickly identify intraday trend bias across multiple symbols by tracking price relationships to key technical levels: Prior Day High/Low (PDH/PDL) and Pre-Market High/Low (PMH/PML).
█ FEATURES
► Single Symbol Table
Compact 5-column table displaying PDH, PMH, PDL, PML, and Trend status for the current chart symbol. Shows green dot (🟢) when price breaks above high levels and red dot (🔴) when price breaks below low levels. Progress bars visualize how close price is to breaking key levels.
► Multi Symbol Table
Monitor up to 20 tickers simultaneously in a single table. Each row displays ticker name, price, change %, breakout dots, progress bars, and trend status. Optional columns for actual PMH/PML and PDH/PDL price values. Real-time updates for all symbols with color-coded change percentages.
► Table Sorting
- None - Displays tickers in input order
- Chg % - Sorts by daily change percentage (highest to lowest)
- Bullish - Prioritizes bullish setups at top
- Bearish - Prioritizes bearish setups at top
► PMH/PML Lines (Pre-Market High/Low)
Horizontal lines at pre-market high and low levels (4:00 AM - 9:29 AM ET). Customizable line styles, colors, labels, and optional price display.
► PDH/PDL Lines (Prior Day High/Low)
Horizontal lines at previous trading day's high and low. Uses RTH only for stocks (9:30 AM - 4:00 PM ET) and full 24-hour day for non equities.
► ORB Lines (Opening Range Breakout)
Captures high and low during the opening period with 5-minute, 10-minute, or 30-minute options. Lines persist from market open until next pre-market session.
► EMA Overlays
Three independent EMAs with customizable periods (default: 8, 20, 200). Third EMA can be switched to SMA. Multiple line styles available.
► VWAP Overlay
Volume Weighted Average Price with customizable line style, width, and color.
█ TREND LOGIC
- BULLISH: Price above BOTH Prior Day High AND Pre-Market High
Indicates strong upward momentum breaking through two resistance levels
- BEARISH: Price below BOTH Prior Day Low AND Pre-Market Low
Indicates strong downward momentum breaking through two support levels
- NEUTRAL: Price not above both highs or below both lows
Price is consolidating between key levels
█ PROGRESS BARS
Visual 5-block meter showing progress from midpoint toward target level:
▓▓▓▓▓ (80-100%) → ▓▓▓▓▒ (60-80%) → ▓▓▓▒▒ (40-60%) → ▓▓▒▒▒ (20-40%) → ▓▒▒▒▒ (0-20%)
Replaced with 🟢 or 🔴 when level is actually broken.
█ ASSET TYPE HANDLING
STOCKS:
- Pre-Market: 4:00 AM - 9:29 AM Eastern
- Prior Day: RTH only (9:30 AM - 4:00 PM Eastern)
NON-EQUITIES:
- Prior Day: Full 24-hour trading day
- Automatically detected via symbol type
█ RECOMMENDED SETTINGS
- Chart Timeframe: 10-minute recommended for multi-table accuracy
- Timeframes 60 minutes or less required for ORB functionality
- Enable extended hours on chart for accurate PMH/PML on stocks
█ USAGE TIPS
- Use Bullish sort to find strongest breakout candidates for long trades
- Use Bearish sort to find weakest stocks for short/put candidates
- Progress bars help anticipate upcoming breakouts before they happen
- Combine with ORB lines to confirm trend direction after market open
- Watch for alignment: Price above all key levels = strongest bullish signal
- PDH/PDL breaks often signal continuation of prior day's trend
- PMH/PML breaks can indicate gap-fill or trend reversal setups
█ INDICATOR SETTINGS
█ EXAMPLE OF FULL MULTI TABLE AND SINGLE TABLE
█ MULTI-TABLE SORTING
█ PMH/PML, PDH/PDL, ORB LINES
█ EMA AND VWAP OVERLAYS
█ CUSTOMIZATION

Daily + 4H Candle with Labels finndaily and 4hr candle, shows the exact and current candles and updates whenever they do on the chart

Stress & Recovery Daily Stock/BTC This indicator is a stress → recovery regime tool designed for Daily charts (Bitcoin and equities). It combines Williams Vix Fix (WVF) to detect panic/capitulation conditions (potential bottoms) with RSI vs EMA(RSI) to confirm the start of a recovery phase — but only when that recovery occurs within a configurable number of bars after a WVF panic event.
It is not a generic trend indicator. It focuses on one specific sequence:
Panic spike (WVF) → Recovery confirmation (RSI crossing above EMA(RSI)).
What it Shows
1) Red Bottom Shadow (Panic Zone)
A red shaded area below the baseline appears when WVF triggers a panic condition. This highlights periods where downside pressure and “panic-like” behavior are elevated.
To avoid clutter, the red triangle marker (▼) is plotted only once per red cluster, specifically on the last bar of the panic cluster (end of the WVF signal streak).
2) Green State Ribbon (Recovery Regime)
A green ribbon above the baseline indicates a recovery regime. You can choose how the green signal behaves:
Crossover only: green is active only on the single bar where RSI crosses above EMA(RSI).
State (RSI > EMA): green stays active as long as RSI remains above EMA(RSI).
3) Amber Ribbon (Conflict State)
If panic (WVF) and recovery (green state) overlap, the ribbon turns amber.
This indicates a mixed condition: panic is still present, but momentum is attempting to reverse.
4) Green Triangle Marker (▲) — Validated Recovery Start
A green triangle (▲) appears only when RSI crosses above EMA(RSI) AND that crossover happens within N bars from the most recent WVF panic zone. This time-window filter helps avoid unrelated RSI crossovers that occur far from capitulation events.
How to Use
- Treat red shadow as a “panic/stress zone”.
- Look for the green triangle (▲) as the first validated recovery trigger after panic.
- Use green ribbon as a recovery regime filter (especially in “State” mode).
- Use amber ribbon as a caution zone (overlap = mixed signals).
This indicator is best used as a context and timing filter, not as a complete trading system by itself.
Notes:
- Designed and tuned for Daily timeframe usage.
- Signals may behave differently on intraday timeframes or illiquid assets.

Daily Range SeqDaily Range Seq
Time Window: 04:00 - 10:25 EST
Eval. Window: 10:30 - 15:55 EST
Time Window sets the target for price during the Eval. Window.
If high of time window is created first, then target the high during the Eval. Window.
If low of time window is created first, then target the low during the Eval. Window.

Daily % Change TableDaily % Change Table — Indicator Summary
This indicator provides a compact performance summary for daily candles, designed for backtesting and daily-session analysis. It displays a table in the top-right corner of the chart showing three key percentage-change statistics based on the current candle:
1. Prior Change
Percentage move from the close two days ago to the prior day’s close.
Useful for understanding momentum and context heading into the current session.
2. Change
Percentage move from the prior day's close to the current candle’s close.
Shows today’s full-session change.
3. Premarket
Percentage move from the prior day's close to the current day’s open.
Helps quantify overnight sentiment and gap activity.
Features
Clean, unobtrusive table display
Automatically updates on the most recent bar
Designed for use on Daily timeframe
Useful for gap analysis, backtesting, and volatility/momentum studies

Daily Gap Highlighter (Partial Gaps + Age Filter)Daily Gap Highlighter – 部分的な窓の未埋めエリアを自動描画
このインジケーターは、日足チャートにおける窓(ギャップ)を自動で検出し、
その後の値動きで一部だけ埋まった場合も、埋め残し部分だけを正確に描画するツールです。
🔍 主な特徴
日足ベースで窓を検出
上窓:当日の安値 > 前日の高値
下窓:当日の高値 < 前日の安値
部分的な窓埋めにも対応
例:窓の90%が埋まった → 残り10%だけ窓として残す
完全に埋まった窓は自動的に削除
窓の“鮮度フィルター”を搭載
指定した日数(デフォルト90日)を経過した古い窓は自動で非表示にできます。
トレンド転換ポイントの可視化に最適
未埋めギャップは多くのトレーダーが注目する価格帯であり、
サポート/レジスタンスとして高い機能を持ちます。
📈 活用例
スイングトレードでのターゲット設定
窓埋めの完了・未完了の判定
重要水平ラインとしての分析
長期的な価格メモリーの可視化
日足チャートを使うトレーダーの方にとって、
“本当に意味のある未埋め窓だけ”が残る実用的なインジケーターです。
🇺🇸 English Description (for TradingView Community)
Daily Gap Highlighter – Precise Partial Gap Visualization
This indicator automatically detects daily price gaps and visualizes them on the chart —
but with one powerful upgrade:
It keeps only the unfilled portion of the gap.
🔍 Key Features
Daily-based gap detection
Up Gap: Today’s Low > Previous High
Down Gap: Today’s High < Previous Low
Partial gap filling supported
Example: If 90% of the gap has been filled,
→ Only the remaining 10% is still shown as an active gap.
Fully filled gaps are automatically removed
Gap “age filter” included
Automatically hide gaps older than a chosen number of days (default: 90).
Great for identifying key market levels
Unfilled gaps often act as strong support/resistance zones
and are widely watched by professional traders.
📈 Use Cases
Setting targets for swing trades
Determining whether a gap is filled or partially filled
Highlighting significant horizontal price levels
Visualizing long-term market memory zones
This tool is ideal for traders who want
a clean and accurate view of meaningful unfilled gaps only.

Daily Vertical Lines 6PM (Arctic Blue – No Sundays)Daily vertical lines to show each day's beginning at 6 pm, very simple, just bars to represent the days of each week in arctic blue, no sundays, so that it goes in tandem with my weekly indicator.

Daily Midnight Marker (NYC)Daily Midnight Marker (NYC) automatically plots a vertical light-gray line on your chart at midnight New York time (00:00) to visually mark the start of each trading day.
A small label is displayed at the bottom of the line that reads “Day Start”, helping traders quickly identify daily session boundaries.
This indicator is especially useful for:
Futures or forex traders referencing New York session time
Intraday analysts who want to distinguish daily ranges
Backtesting or reviewing overnight/pre-market activity
Features:
Plots at 00:00 NYC time daily
Light gray, clean design to avoid clutter
Optional label under each day start

Daily Close Cross Above SMA 20 (Low)Daily closing price crosses above SMA 20 low, signals a bullish trend.

Daily Levels: PD / PM / OR (RTH/Pre)# Daily Levels: PD / PM / OR (RTH/Pre)
## Overview
This indicator displays key intraday support and resistance levels for US equity markets, specifically designed for traders who use Previous Day, Pre-Market, and Opening Range levels in their trading strategy.
## Key Features
**Seven Critical Levels Displayed:**
- **PDH (Previous Day High)** - Blue line: The highest price from yesterday's regular trading hours (9:30 AM - 4:00 PM ET)
- **PDL (Previous Day Low)** - Blue line: The lowest price from yesterday's regular trading hours
- **PDC (Previous Day Close)** - Orange line: The closing price from yesterday's regular trading hours
- **PMH (Pre-Market High)** - Yellow line: The highest price during today's pre-market session (4:00 AM - 9:30 AM ET)
- **PML (Pre-Market Low)** - Yellow line: The lowest price during today's pre-market session
- **ORH (Opening Range High)** - Red line: The highest price during the first 30 minutes of trading (9:30 AM - 10:00 AM ET)
- **ORL (Opening Range Low)** - Red line: The lowest price during the first 30 minutes of trading
## How It Works
**At 9:30 AM ET (Market Open):**
- PDH, PDL, PDC levels appear (from previous day's RTH)
- PMH, PML levels appear (from today's pre-market session)
- All lines begin at the 9:30 AM bar and extend right
**At 10:00 AM ET (Opening Range Close):**
- ORH, ORL levels appear (from today's first 30 minutes)
- Lines begin at the 9:30 AM bar and extend right
**Level Persistence:**
- All levels remain visible until the next trading day at 9:30 AM ET
- Levels reset daily for the new trading session
## Use Cases
**Day Trading:**
- Identify key support and resistance zones before placing trades
- Use PDH/PDL as potential profit targets or stop loss areas
- Monitor price reaction at pre-market levels for early trading signals
- Trade breakouts or rejections at opening range levels
**Swing Trading:**
- Assess daily momentum by observing breaks above/below previous day levels
- Use multiple timeframes while maintaining consistent reference points
**Market Structure:**
- Quickly identify if the market is trading above or below key levels
- Recognize accumulation/distribution patterns around these zones
## Technical Details
- **Timezone:** All times referenced are US Eastern Time (America/New_York)
- **Session Windows:**
- Pre-Market: 4:00 AM - 9:30 AM ET
- Regular Trading Hours: 9:30 AM - 4:00 PM ET
- Opening Range: 9:30 AM - 10:00 AM ET
- **Timeframe Agnostic:** Works on any chart timeframe
- **Visual Clarity:** Color-coded lines and labels for easy identification
## Color Scheme
- **Blue:** Previous Day levels (PDH, PDL)
- **Orange:** Previous Day Close (PDC)
- **Yellow:** Pre-Market levels (PMH, PML)
- **Red:** Opening Range levels (ORH, ORL)
## Best Practices
1. Use on US equity indices (SPY, QQQ, ES, NQ) and liquid US stocks
2. Combine with volume analysis for confirmation
3. Pay attention to how price reacts at these levels (bounce vs. break)
4. Most effective during the first 2 hours of trading when volatility is highest
5. Consider the market context (trending vs. ranging) when interpreting these levels
## Note
This indicator is specifically designed for US market hours. Results may vary when applied to international markets or instruments with different trading sessions.

Daily Midnight Lines# Daily Midnight Lines
A simple and efficient TradingView indicator that automatically draws vertical lines at the start of each new day.
* *
## Features
✅ **Precise Timing**: Draws lines at exactly 00:00 or on the first bar of the new day
✅ **Calendar Days**: Uses calendar days, not trading sessions
✅ **Customizable Design**: Green color with transparency for comfortable viewing
✅ **High Performance**: Optimized code without unnecessary calculations
✅ **Universal**: Works on all timeframes and instruments
## Settings
- **Line Color**: Green with 30% transparency (customizable)
- **Line Width**: 1 pixel (1 to 3)
- **Mode**: Exactly at 00:00 or first bar of new day
## Applications
- Separating trading days on the chart
- Analyzing price behavior at the start of the day
- Planning trading strategies
- Statistical analysis by days
## Compatibility
- Pine Script v6
- All timeframes (1m - 1M)
- All instruments (stocks, forex, crypto, futures)
- All markets (24/7, daily, night sessions)
Perfect for day traders, scalpers, and analysts who want better chart orientation and intraday pattern analysis.
---
## Ежедневные Полночные Линии
Простой и эффективный индикатор TradingView, который автоматически рисует вертикальные линии в начале каждого нового дня.
## Особенности
✅ **Точное время**: Рисует линии в 00:00 или на первом баре нового дня
✅ **Календарные дни**: Использует календарные дни, а не торговые сессии
✅ **Настраиваемый дизайн**: Зеленый цвет с прозрачностью для комфортного просмотра
✅ **Высокая производительность**: Оптимизированный код без лишних вычислений
✅ **Универсальность**: Работает на всех таймфреймах и инструментах
## Настройки
- **Цвет линий**: Зеленый с прозрачностью 30% (настраивается)
- **Толщина линий**: 1 пиксель (от 1 до 3)
- **Режим**: Точно в 00:00 или первый бар нового дня
## Применение
- Разделение торговых дней на графике
- Анализ поведения цены в начале дня
- Планирование торговых стратегий
- Статистический анализ по дням
## Совместимость
- Pine Script v6
- Все таймфреймы (1м - 1М)
- Все инструменты (акции, форекс, крипто, фьючерсы)
- Все рынки (24/7, дневные, ночные сессии)
Идеально подходит для дневных трейдеров, скальперов и аналитиков, которые хотят лучше ориентироваться на графике и анализировать внутридневные паттерны.
**Pine Script v6** | **Updated: October 2024** | **Обновлено: Октябрь 2024**

Daily High & Low - 200 bars (Historical)Daily highs and lows.
High marked with a red line.
Low marked with a green line.
plotted on the 5 min chart.

Simple Daily OpenDisplays the daily open line, simple as that.
The line is drawn from the opening price of the first bar of the day. There is an option to choose the color, line style, and thickness.

Daily High/Low Close Breakout - GOLD### **Daily High/Low Close Breakout Indicator**
This indicator is a powerful tool for identifying potential breakout opportunities based on the previous day's price action. It's built on a unique time-based logic that defines key support and resistance levels for the trading day.
---
### **How the Indicator Works**
The indicator operates in two main phases:
1. **Calculation Period (00:00 to 16:30 Tehran Time):** The indicator first observes the price action from the start of the day until 16:30. During this time, it records the highest and lowest **closing prices** of all candles. The chart background is shaded gray to visually mark this period.
2. **Trading Period (16:30 to 16:30 the next day):** At 16:30, the highest and lowest close levels are finalized and drawn as horizontal lines. These levels then become the primary breakout zones for the next 24 hours. The indicator will generate signals whenever the price crosses these lines.
---
### **Trading Signals**
The indicator uses a simple and effective crossover logic for its signals:
* **BUY Signal:** A signal is generated when a candle's closing price **crosses above** the high close line.
* **SELL Signal:** A signal is generated when a candle's closing price **crosses below** the low close line.
---
### **Important Usage Guidelines**
For optimal performance, please follow these specific recommendations:
* **Timeframe:** This indicator is designed and optimized to be used exclusively on the **15-minute timeframe**. Using it on other timeframes may produce inconsistent or unreliable results.
* **Primary Asset:** The logic for this indicator was developed and backtested primarily for **Gold (XAUUSD)**. Its performance and win rate have been observed to be the most consistent on this asset.
* **Asset Restriction:** It is strongly recommended to **avoid using this indicator on other currency pairs or assets**, as it has not been optimized for their specific market behavior.
---
### **Disclaimer**
*This indicator is provided for informational and educational purposes only. It is not financial advice. Past performance is not a guarantee of future results. All trading decisions should be based on your own research and risk analysis. Always use proper risk management.*

Haven Average Daily RangeOverview
This indicator is an enhanced version of the traditional ADR tool that adapts to intraday price movements. Unlike static ADR levels, this indicator dynamically adjusts its range boundaries based on real-time price action while maintaining the original ADR calculation framework.
Key Features
ADR calculation based on multiple periods (5, 10, and 20 days)
ADR levels displayed with automatic style changes upon range reach
Customizable display settings (color, line style)
Price labels for better visualization
The indicator helps traders assess the instrument's volatility, identify potential reversal zones, and plan daily trading targets.
Suitable for all timeframes up to D1 and any trading instrument.
How It Works
Session Start (UTC+0): Calculates ADR based on historical data and sets initial High/Low levels
Dynamic Phase: Monitors price action and adjusts the opposite boundary (ADR Low or High) when new extremes are reached.
When price creates new Day high price above the opening price, the ADR Low level moves upward proportionally.
When price creates new Day low price below the opening price, the ADR High level moves downward proportionally.
Completion Phase: Stops adjustments and highlights breach when price reaches either boundary
Trading Application
Entry and Exit Signals
The ADR boundaries serve as key decision points for trade execution. When price approaches the upper ADR boundary, it often signals a potential selling zone, particularly when confluence exists with other overbought indicators such as RSI divergence or resistance levels. Conversely, price reaching the lower ADR boundary frequently indicates potential buying opportunities, especially when supported by oversold conditions or support confluences.
Trend Continuation Assessment
One of the most valuable applications is gauging the probability of continued directional movement. When the current session's price action has not yet reached either ADR boundary, statistical probability favors trend continuation in the established direction. This information helps traders stay with profitable positions longer rather than exiting prematurely.
Reversal and Consolidation Zones
The visual color change to orange when ADR boundaries are reached provides immediate feedback that the normal daily range has been exhausted. At this point, the probability of trend reversal or sideways consolidation increases significantly. This signal helps traders prepare for potential position adjustments or new counter-trend opportunities.

Daily Asian RangeDaily Asian Range Indicator
This indicator is an enhanced version inspired by @toodegrees' "ICT Friday's Asian Range" indicator. While maintaining the core concepts, this version expands functionality for daily analysis and adds comprehensive customization options.
### Overview
The Asian Range indicator identifies and visualizes potential liquidity areas based on price action during the Asian session (8:00 PM - 12:00 AM ET). It plots both body and wick ranges along with multiple standard deviation levels that can serve as potential price targets or areas of interest.
### Features
- Flexible Display Options
- Choose between Body, Wick, or Both for range boxes and deviation lines
- Customizable colors, styles, and borders for all visual elements
- Historical sessions display (0-20 previous sessions)
- Advanced Standard Deviation Levels
- Multiple deviation multipliers (1.0, 1.5, 2.0, 2.3, 3.5)
- Separate visualization for body and wick-based deviations
- Clear labeling system for easy identification
- Precise Time Management
- Asian session: 8:00 PM - 12:00 AM ET
- Deviation lines extend through the following trading day
- Proper timezone handling for accuracy
### Usage
- Works on timeframes from 1 to 15 minutes
- Use the range boxes to identify key price levels from the Asian session
- Standard deviation levels can serve as potential targets or areas of interest
- Combine with other indicators for enhanced analysis
### Credits
Original concept and base implementation by @toodegrees
Enhanced and expanded by @Omarqqq
### Disclaimer
This indicator is for educational and informational purposes only. Always conduct your own analysis and use proper risk management.

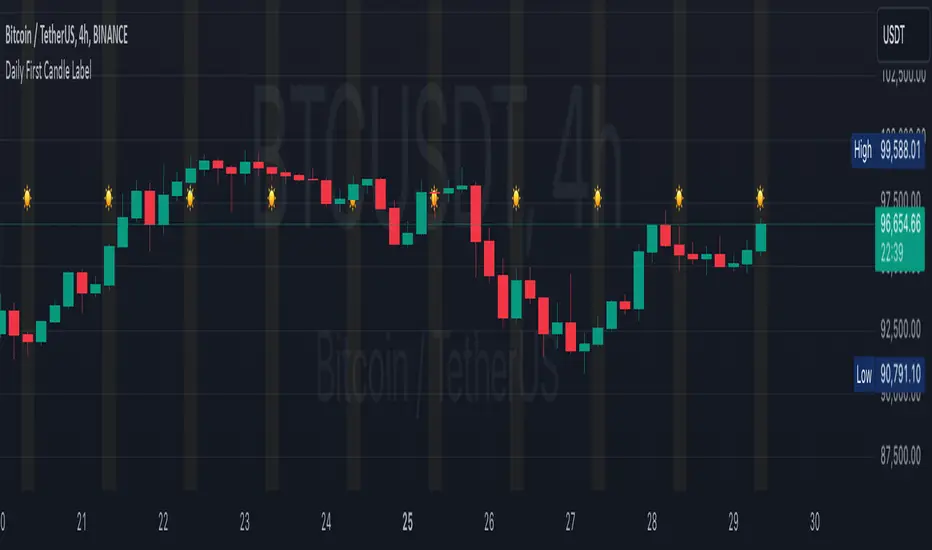
Daily First Candle LabelDaily First Candle Label
The Daily First Candle Label indicator is designed to visually highlight the first candle of each trading day directly on your chart. This tool is ideal for traders who need to quickly identify the start of a new trading session. Key features include:
Candle Marker: A triangle icon labeled with a "☀️" is plotted at the top of the chart to mark the first candle of the day.
Background Highlight: The background of the first candle is subtly shaded in yellow for better visibility.
Clean and Minimalist Design: Keeps your chart clutter-free while providing essential daily context.
This indicator is perfect for scalpers, day traders, and those analyzing session-based trading strategies.
Usage:
Add the indicator to your chart.
The marker and background highlight will automatically update to reflect the first candle of each trading day.
Customizable Options:
None, as this indicator is optimized for simplicity and immediate utility.
Happy Trading! 🚀
每日第一支蜡烛标签
指标旨在直观地标记每个交易日的第一根蜡烛。这对需要快速识别新交易日开盘的交易者非常实用。功能特点如下:
蜡烛标记: 在图表顶部标记每日的第一根蜡烛,使用三角形图标及“☀️”符号。
背景高亮: 自动为第一根蜡烛添加淡黄色背景,增强视觉效果。
简洁设计: 确保图表清晰,提供每日交易日开盘的重要参考点。
此指标适用于日内交易者、剥头皮交易者以及任何分析交易时段策略的用户。
使用说明:
将指标添加到图表。
每日第一根蜡烛会自动显示标记及背景高亮。
可自定义选项:
暂无,指标已优化为简洁实用的设计。
祝交易顺利!🚀
Daily Liquidity Peaks and Troughs [ST]Daily Liquidity Peaks and Troughs
Description in English:
This indicator identifies peaks and troughs of highest liquidity on a daily timeframe by analyzing volume data. It helps traders visualize key points of high buying or selling pressure, which could indicate potential reversal or continuation areas.
Detailed Explanation:
Configuration:
Lookback Length: This input defines the period over which the highest high and lowest low are calculated. The default value is 14. This means the script will look at the past 14 bars to determine if the current high or low is a pivot point.
Volume Threshold Multiplier: This input defines the multiplier for the average volume. For example, a multiplier of 1.5 means the volume needs to be 1.5 times the average volume to be considered a significant peak or trough.
Peak Color: This input sets the color for liquidity peaks. The default color is red.
Trough Color: This input sets the color for liquidity troughs. The default color is green.
Volume Calculation:
Average Volume: The script calculates the simple moving average (SMA) of the volume over the lookback period. This helps to identify periods of significantly higher volume.
Volume Threshold: The threshold is determined by multiplying the average volume by the volume threshold multiplier. Only volumes exceeding this threshold are considered significant.
Identifying Peaks and Troughs:
Liquidity Peak: A peak is identified when the current high is the highest high over the lookback period and the current volume exceeds the volume threshold. This indicates a potential area of strong selling pressure.
Liquidity Trough: A trough is identified when the current low is the lowest low over the lookback period and the current volume exceeds the volume threshold. This indicates a potential area of strong buying pressure.
These peaks and troughs are marked on the chart with labels and shapes for easy visualization.
Plotting Peaks and Troughs:
Labels: The script uses labels to mark peaks and troughs on the chart. Peaks are marked with a red label and troughs with a green label.
Shapes: The script plots triangles above peaks and below troughs to highlight these areas visually.
Indicator Benefits:
Liquidity Identification: Helps traders identify key areas of high liquidity, indicating strong buying or selling pressure.
Visual Cues: Provides clear visual signals for potential reversal or continuation points, aiding in making informed trading decisions.
Customizable Parameters: Allows traders to adjust the lookback length and volume threshold to suit different trading strategies and market conditions.
Justification of Component Combination:
Peaks and Troughs Identification: Combining pivot points with volume analysis provides a robust method to identify significant liquidity areas. This helps in detecting potential market reversals or continuations.
Volume Analysis: Utilizing average volume and volume threshold ensures that only significant volume spikes are considered, enhancing the accuracy of identified peaks and troughs.
How Components Work Together:
The script first calculates the average volume over the specified lookback period.
It then checks each bar to see if it qualifies as a liquidity peak or trough based on the highest high, lowest low, and volume threshold.
When a peak or trough is identified, it is marked on the chart with a label and a shape, providing clear visual cues for traders.
Título: Picos e Fundos de Liquidez Diários
Descrição em Português:
Este indicador identifica picos e fundos de maior liquidez no gráfico diário, analisando os dados de volume. Ele ajuda os traders a visualizar pontos-chave de alta pressão de compra ou venda, o que pode indicar áreas potenciais de reversão ou continuação.
Explicação Detalhada:
Configuração:
Comprimento de Retrocesso: Este input define o período sobre o qual a máxima e mínima são calculadas. O valor padrão é 14. Isso significa que o script analisará os últimos 14 candles para determinar se a máxima ou mínima atual é um ponto de pivô.
Multiplicador de Limite de Volume: Este input define o multiplicador para o volume médio. Por exemplo, um multiplicador de 1.5 significa que o volume precisa ser 1.5 vezes o volume médio para ser considerado um pico ou fundo significativo.
Cor do Pico: Este input define a cor para os picos de liquidez. A cor padrão é vermelha.
Cor do Fundo: Este input define a cor para os fundos de liquidez. A cor padrão é verde.
Cálculo do Volume:
Volume Médio: O script calcula a média móvel simples (SMA) do volume ao longo do período de retrocesso. Isso ajuda a identificar períodos de volume significativamente mais alto.
Limite de Volume: O limite é determinado multiplicando o volume médio pelo multiplicador de limite de volume. Apenas volumes que excedem esse limite são considerados significativos.
Identificação de Picos e Fundos:
Pico de Liquidez: Um pico é identificado quando a máxima atual é a máxima mais alta no período de retrocesso e o volume atual excede o limite de volume. Isso indica uma potencial área de forte pressão de venda.
Fundo de Liquidez: Um fundo é identificado quando a mínima atual é a mínima mais baixa no período de retrocesso e o volume atual excede o limite de volume. Isso indica uma potencial área de forte pressão de compra.
Esses picos e fundos são marcados no gráfico com etiquetas e formas para fácil visualização.
Plotagem de Picos e Fundos:
Etiquetas: O script usa etiquetas para marcar picos e fundos no gráfico. Os picos são marcados com uma etiqueta vermelha e os fundos com uma etiqueta verde.
Formas: O script plota triângulos acima dos picos e abaixo dos fundos para destacar essas áreas visualmente.
Benefícios do Indicador:
Identificação de Liquidez: Ajuda os traders a identificar áreas-chave de alta liquidez, indicando forte pressão de compra ou venda.
Cues Visuais: Fornece sinais visuais claros para pontos potenciais de reversão ou continuação, auxiliando na tomada de decisões informadas.
Parâmetros Personalizáveis: Permite que os traders ajustem o comprimento de retrocesso e o limite de volume para se adequar a diferentes estratégias de negociação e condições de mercado.
Justificação da Combinação de Componentes:
Identificação de Picos e Fundos: A combinação de pontos de pivô com análise de volume fornece um método robusto para identificar áreas significativas de liquidez. Isso ajuda na detecção de potenciais reversões ou continuações de mercado.
Análise de Volume: Utilizar o volume médio e o limite de volume garante que apenas picos de volume significativos sejam considerados, aumentando a precisão dos picos e fundos identificados.
Como os Componentes Funcionam Juntos:
O script primeiro calcula o volume médio ao longo do período especificado de retrocesso.
Em seguida, verifica cada barra para ver se ela se qualifica como um pico ou fundo de liquidez com base
