Penunjuk Pine Script®
Cari dalam skrip untuk "daily"

Penunjuk Pine Script®
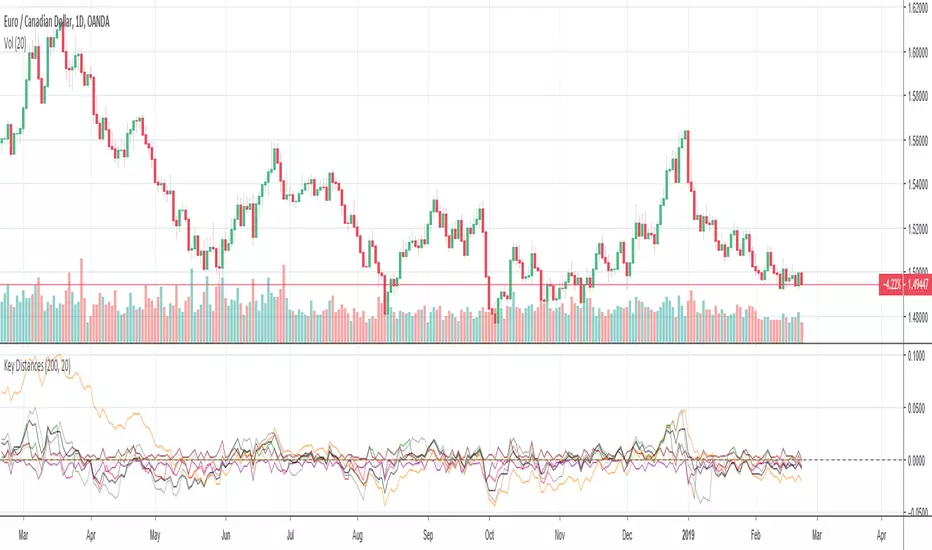
Key Distances (Weekly, Daily Open, & EMA)This indicator provides the pip value from various key levels I've found important in my trading system.
The results are graphed. I suggest that you choose the 2 most important ones you want to graph otherwise the indicator gets difficult to read.
The important data is the actual numbers but I've found it helpful to understand how a ticker moves in regards to weekly open and distance from 200EMA to be most helpful.
Here is the order of the data listed:
Distance from weekly open (green if above open, red if below open, also paints color on line)
Distance from last week opening price
Distance from daily open
Distance to 200EMA
Future Possible Updates:
- customized EMA
- Distance from weekly low/high
Penunjuk Pine Script®
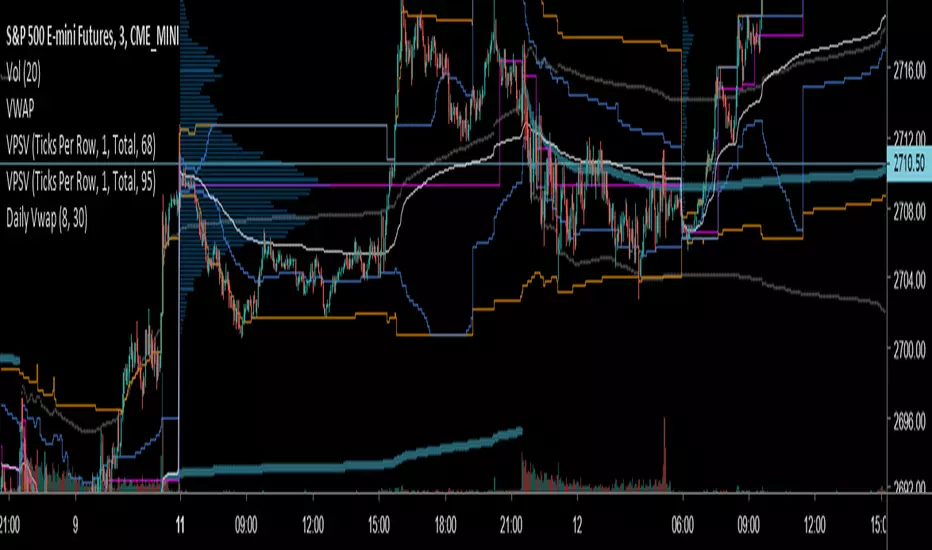
DRS - Daily Range SystemAn indicator that visualizes the evolution of a daily candle, inspired by a thread on forexfactory: www.forexfactory.com
Applied on a timeframe lower than D (actually lower than H4), it visualizes the evolution of the day's high and low, as well as mid and 25% and 75% lines.
The sole input parameters are the hour at which a day is supposed to start, and the extent of the "trade allowed" region as explained in the FF -1.44% thread.
Penunjuk Pine Script®

Always show daily EMAThis script will always plot the daily EMA regardless of which timeframe you are on.
Penunjuk Pine Script®

Average Daily Range - without open barBasic ADR-indicator that is showing the daily range on lower timeframes as well, without using the current open daily bar for calculation.
Also plots as line in a separate indicator window. Updates displayed value when hovering over the candles on the chart to see historical Numbers.
Penunjuk Pine Script®

[naoligo] Pivot Points (Daily)Suporte/Resistência do Pivot diário para gráficos intraday
Marcação do S/R tradicional e S/R Fibonacci
Daily Pivot Point Support/Resistances on intraday charts
Both Traditional and Fibonacci methods plotted
Penunjuk Pine Script®

Penunjuk Pine Script®

Auto Daily Fib Levels R2 by JustUncleLThis study is a variation of my "Automatic Daily Fibonnacci" indicator. This variation automatically draw Fibonacci Pivot levels (or optionally Classic Pivots) based on the previous day's highest and lowest points. The HLC3 is used as the default Daily Pivot level.
Unlike the "Automatic Daily Fibonnacci", this indicator does not redraw/update levels on current day even if the price goes past the R3/S3 levels.
Timeframe: is just a text string and is not checked, so needs to be a valid resolution eg: 60, 120, 240, 360, 480, 720, 1D, 1W, 1M, 2D, 2W, 3M
Pivot LEVELS:
Green = Pivot and Pivot Zone
Blue = R1,S1 Levels and Zone
Red = R2,S2 Levels and Zone
Black = R3,S3 Levels
Penunjuk Pine Script®
Penunjuk Pine Script®

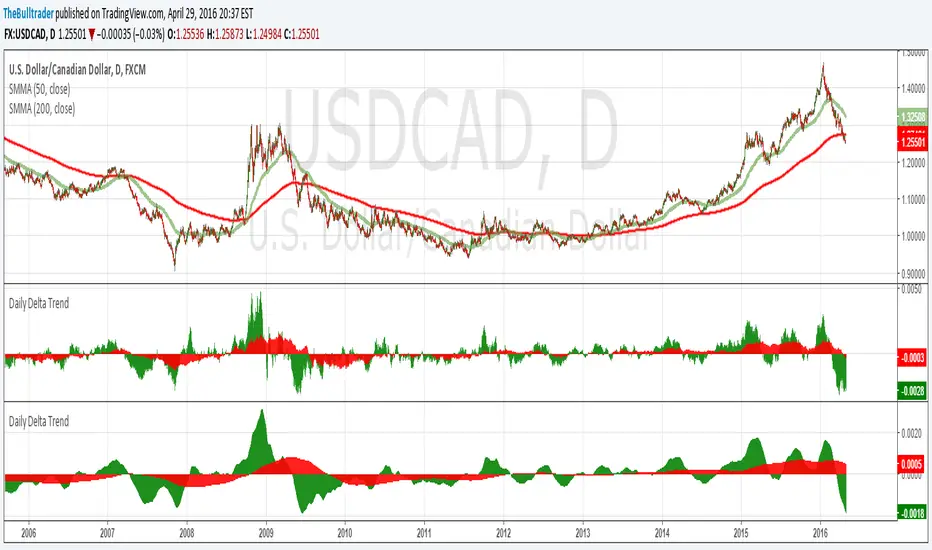
Daily Delta TrendDaily Delta Trend is a useful exponential moving average of the 50 day and 200 day simple moving average. In the first Daily Delta Trend I realized that the simple moving averages were pretty choppy as they were buy then sell over short period of times. So I thought taking an average of another average would smooth my results and give it buy and sell signals more clearly. In chart 1, you can see that it is choppy, and in chart 2 is much smoother.
The way I've been interpreting the chart is to trade it only when the 50-day average (GREEN) Trades with 200-day average (RED). For example, when red and green are both >0 = Buy and both <0 = Sell.
Just from a little of pretesting, I was able to find solid trades from multiple pairs.
DISCLAIMER, I have not actually traded this indicator as I just wrote it for the past few hours, But I thought it was interesting and maybe I might trade it. Feel free to play with it and comment back :P
Penunjuk Pine Script®
CD_Average Daily Range Zones- highs and lows of the dayUses daily average ranges of 5 and 10 (most used) as buy (support) and highs (resistance) areas - half ranges used in calculations for a more accurate "forecast" of the H and L . Uses open but not close, so it does not repaint - experimental
Penunjuk Pine Script®

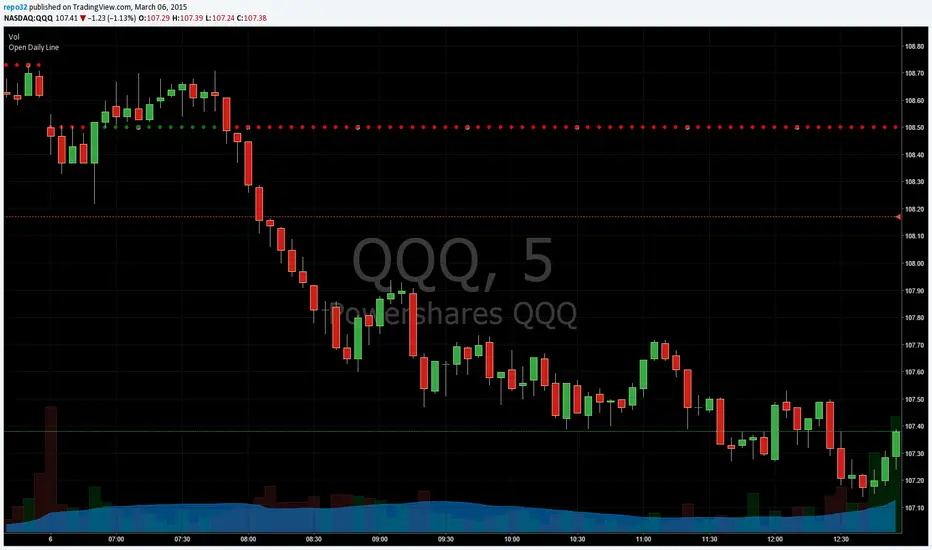
Open Close Daily LineThis will place circles on your chart for the opening daily price. If price is above, the circles are green. If price is below, the circles are red. I wanted to be able to see the opening price a bit easier while in smaller time frames.
I decided to add the previous daily closing line to the original script. Basically looking for good support / resistance
Penunjuk Pine Script®

Open Daily LineThis will place circles on your chart for the opening daily price. If price is above, the circles are green. If price is below, the circles are red. I wanted to be able to see the opening price a bit easier while in smaller time frames.
Penunjuk Pine Script®
Penunjuk Pine Script®

Daily/Weekly EMAs on Lower TimeframesThis indicator allows traders to view Daily and Weekly EMAs (Exponential Moving Averages) directly on lower timeframes such as 1m, 5m, 15m, or 1h charts — providing a higher timeframe perspective without switching charts.
The script includes individual checkboxes for each EMA length — 5, 8, 9, 21, 50, and 200 — organized into two clear sections:
🟢 Daily EMAs
🔵 Weekly EMAs
You can selectively enable or disable any EMA to match your trading style and reduce chart clutter.
Each EMA is color-coded for clarity and consistency:
5 EMA: Green
8 EMA: Blue
9 EMA: Blue
21 EMA: Orange
50 EMA: Purple
200 EMA: Red
Weekly EMAs appear slightly transparent to distinguish them from daily ones.
This makes it easy to visualize higher timeframe trend direction, confluence zones, and dynamic support/resistance levels while trading intraday.
💡 Key Features
View Daily and Weekly EMAs on smaller timeframes.
Individual checkbox toggles for all 6 EMA lengths.
Separate sections for Daily and Weekly EMAs.
Color-coded lines for easy visual recognition.
Works seamlessly on any symbol or timeframe below Daily.
Penunjuk Pine Script®

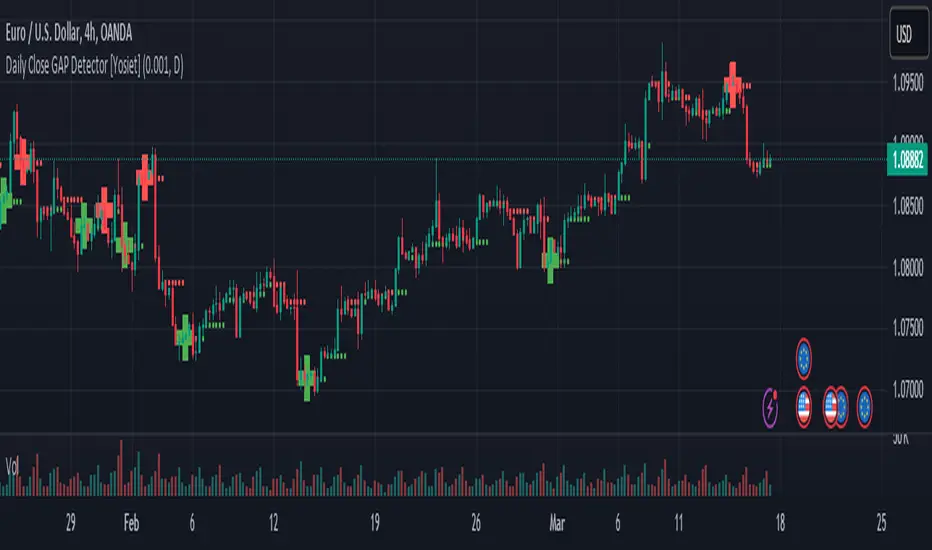
Daily Close GAP Detector [Yosiet]User Manual for "Daily Close GAP Detector "
Overview
This script is designed to help traders identify and react to significant gaps in daily market prices. It plots daily open and close prices and highlights significant gaps with a cross. The script is particularly useful for identifying potential breakouts or reversals based on these gaps.
Configuration
GAP Close Threshold: This input allows you to set a threshold for the gap size that you consider significant. The default value is 0.001.
Timeframe Seeker: This input lets you choose the timeframe for the gap detection. The default is 'D' for daily.
Features
Daily Open and Close Lines: The script plots daily open and close prices. If the close price is lower than the open price, the line is colored red; otherwise, it's green.
Gap Detection: It calculates the difference between the current day's close and the previous day's close, both adjusted for the selected timeframe. If this difference exceeds the threshold, it's considered a significant gap.
Significant Gap Indicator: A cross is plotted on the chart to indicate significant gaps. The color of the cross indicates whether the gap is a short or long gap: red for short gaps and green for long gaps.
Alert Conditions: The script sets up alert conditions for short and long gap breakouts. You can customize the alert messages to include details like the ticker symbol, interval, price, and exchange.
How to Use
Add the Script to Your Chart: Copy the script into the Pine Script editor on TradingView and add it to your chart.
Configure Inputs: Adjust the "GAP Close Threshold" and "Timeframe Seeker" inputs as needed.
Review the Chart: The script will overlay daily open and close prices on your chart, along with crosses indicating significant gaps.
Set Alerts: Use the script's alert conditions to set up alerts for short and long gap breakouts. You can customize the alert messages to suit your trading strategy.
Extending the Code
To extend this script, you can modify the gap detection logic, add more indicators, or integrate it with other scripts for a more comprehensive trading strategy. Remember to test any changes thoroughly before using them in live trading.
Penunjuk Pine Script®
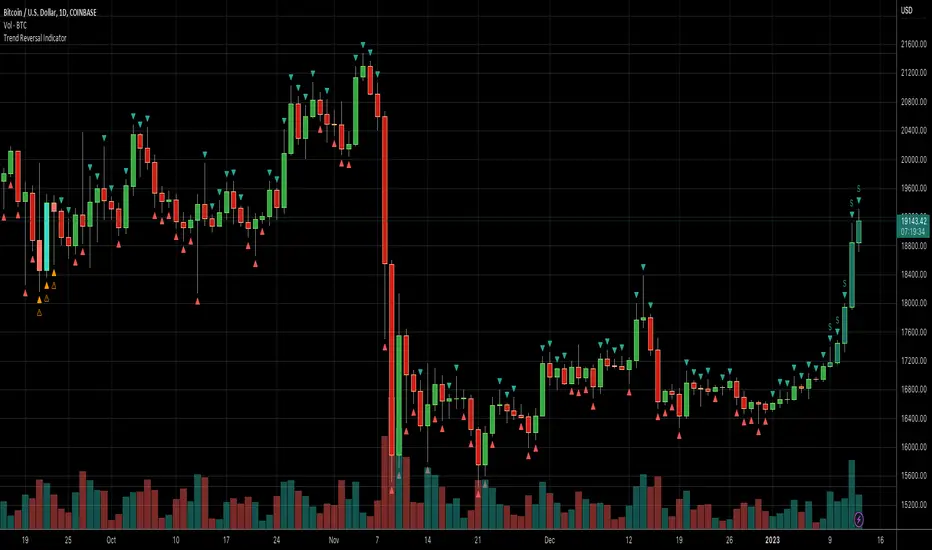
Daily Number/Trend Reversal IndicatorIndicator identifies potential price trend exhaustion.
Compares this period against the 4th prior period for the condition.
9 periods (or more) with the same condition is an indicator that the trend is ending soon.
Penunjuk Pine Script®
Daily Session Windows background highlight indicatorIn intraday studies of stock indexes and Forex I have this weird habit of highlighting premarket, core session, lunch break and extended session with different backgrounds. If done by hand, this is tedious work that has to be repeated daily.
I think this feature should be built-in in TradingView. But it isn't.
For a few months now, I have been using this tiny indicator that does precisely that job. It saved me literally hours of focus time and mistakes. I have decided to revamp it and release it. I'm sure it can be useful to others.
Features:
Background color highlighting for premarket , core session , lunch hour and extended session of the trading day.
Session timing preset to match US session, but can be customized.
Can be enabled or disabled on a day of the week basis, including week-end.
Timezone is selectable, matches the chart's instrument but can be set independently to track a different timezone.
Not affected by the timezone you decided to assign to the chat's time scale.
Ready for stock indexes, but can be used to highlight Forex sessions too.
Penunjuk Pine Script®

Daily Levels Suite + Market BreadthThere are many levels suites out there but many of them use the line series and/or label series to create multiple levels. Pine v5 provides the capability to use line arrays and labels so I wanted to create some code that is extensible to add additional lines/levels and labels to an array of lines with very little effort.
There is also some Market Breadth info that can be shown in the corners of the chart to allow a user to understand how the broader markets are moving compared to the security they are charting.
Current Levels provided are as follows:
Today's Open
Previous Days Close
Previous Days High/Low
Previous Days 50%
T+2 High/Low
All levels and the market breadth table is configurable to be hidden or shown based upon the user's desire.
Penunjuk Pine Script®

Penunjuk Pine Script®

Daily Put Spread Signals - Final Clean v5//@version=5
indicator("Daily Put Spread Signals - Final Clean v5", overlay=true)
//========================
// Inputs
//========================
ma20Len = input.int(20, "MA20 Length")
ma50Len = input.int(50, "MA50 Length")
ma200Len = input.int(200, "MA200 Length")
pullbackPct = input.float(0.01, "Pullback proximity to MA20 (1% = 0.01)", step=0.005)
minRedDays = input.int(1, "Min red days in last 5 bars (0-5)", minval=0, maxval=5)
stopBelow200Pct = input.float(0.005, "STOP: Close below MA200 by % (0.5%=0.005)", step=0.0025)
//========================
// Moving averages
//========================
ma20 = ta.sma(close, ma20Len)
ma50 = ta.sma(close, ma50Len)
ma200 = ta.sma(close, ma200Len)
//========================
// Trend filter (bull regime)
//========================
bullTrend = close > ma50 and close > ma200 and ma50 > ma200
//========================
// Pullback condition (near MA20)
//========================
nearMA20 = close <= ma20 * (1 + pullbackPct)
//========================
// Count red candles in last 5 bars (NO ta.sum)
//========================
isRed(barBack) => close < open ? 1 : 0
redCount = isRed(0) + isRed(1) + isRed(2) + isRed(3) + isRed(4)
hasMinRed = redCount >= minRedDays
//========================
// Bounce confirmation
//========================
bounce = close > open and close > close
//========================
// Entry signal
//========================
enter = bullTrend and nearMA20 and hasMinRed and bounce
//========================
// Exit signals
//========================
takeProfit = ta.crossover(close, ma20)
stopOut = close < ma200 * (1 - stopBelow200Pct)
//========================
// Plots
//========================
plot(ma20, "MA20", linewidth=2)
plot(ma50, "MA50", linewidth=2)
plot(ma200, "MA200", linewidth=2)
plotshape(enter, title="ENTER", style=shape.labelup, location=location.belowbar, text="ENTER\nSell Put Vertical", size=size.small)
plotshape(takeProfit, title="EXIT TP", style=shape.labeldown, location=location.abovebar, text="EXIT\nTake Profit", size=size.small)
plotshape(stopOut, title="EXIT STOP", style=shape.labeldown, location=location.abovebar, text="EXIT\nSTOP", size=size.small)
//========================
// Alerts
//========================
alertcondition(enter, title="ENTER Alert (Daily)", message="ENTER (Daily): Bull trend + pullback near MA20 + bounce. Consider selling put credit spread (30-45 DTE).")
alertcondition(takeProfit, title="EXIT Take Profit Alert (Daily)", message="EXIT TP (Daily): Price reclaimed MA20. Consider taking profit on put spread.")
alertcondition(stopOut, title="EXIT Stop Alert (Daily)", message="EXIT STOP (Daily): Close below MA200 threshold. Consider closing/rolling defensive.")
Penunjuk Pine Script®

Daily DashboardThe Daily Dashboard indicator provides a quick, at-a-glance view of essential daily market statistics directly on your TradingView chart.
Features:
- Daily High & Low: Track the highest and lowest prices of the current trading day.
- Total Daily Volume: Monitor the total trading volume accumulated during the day.
- Previous Day Breakouts: See if today’s price has broken the previous day’s high or low.
- Automatic Updates: All values refresh automatically at the start of a new trading day.
- Pinned Table Layout: Fixed in the top-right corner of the chart for easy reference, independent of price movements.
- Clean Design: White text on a semi-transparent blue background for maximum readability.
Use Cases:
- Day traders needing a quick overview of daily market activity.
- Swing traders monitoring key levels and breakout potential.
- Traders wanting a professional, lightweight dashboard without cluttering the chart.
How It Works:
- Tracks daily high, low, and volume in real time.
- Compares today’s price to the previous day’s high and low to identify breakouts.
- Displays all data neatly in a fixed table pinned to the chart.
Customization:
- Table position is fixed in the top-right corner.
- Background transparency and colors can be adjusted in the script if desired.
Pro Tip:
Combine this dashboard with trend or momentum indicators to create a complete trading setup.
Penunjuk Pine Script®
