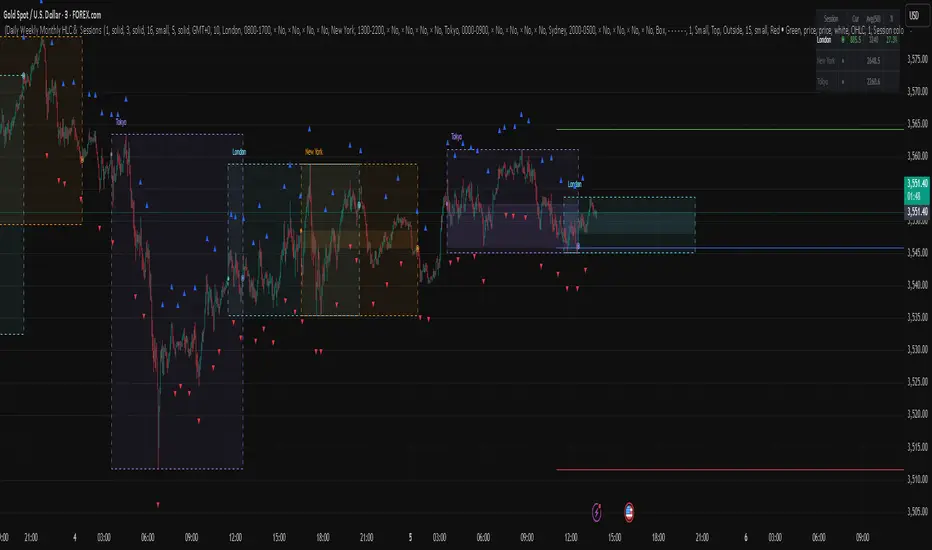
Daily Weekly Monthly HLC (بهداد)خطوط مهم روزانه هفتگی ماهانه This is an indicator that shows the closing lines and the highest and lowest prices for daily, weekly and monthly periods. In addition, we can divide the entire weekly period into several parts.
Cari dalam skrip untuk "daily"
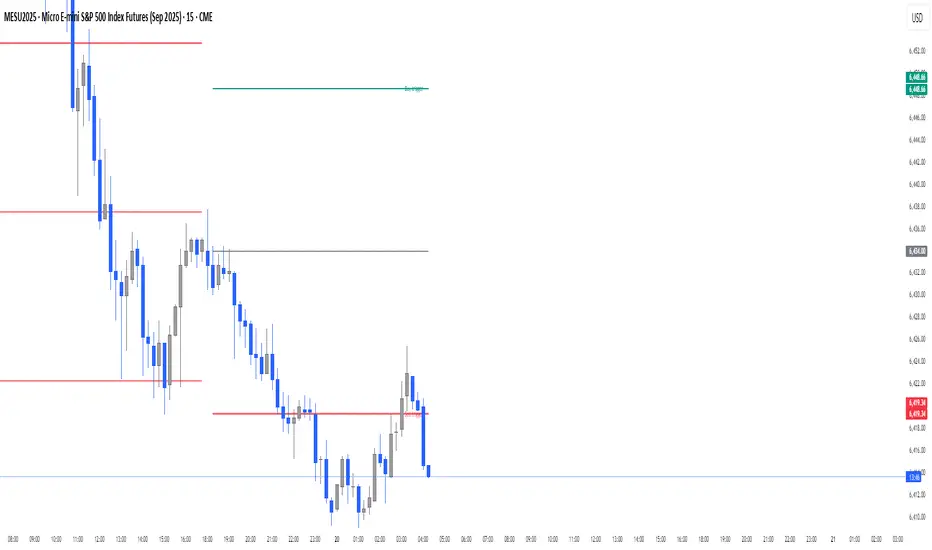
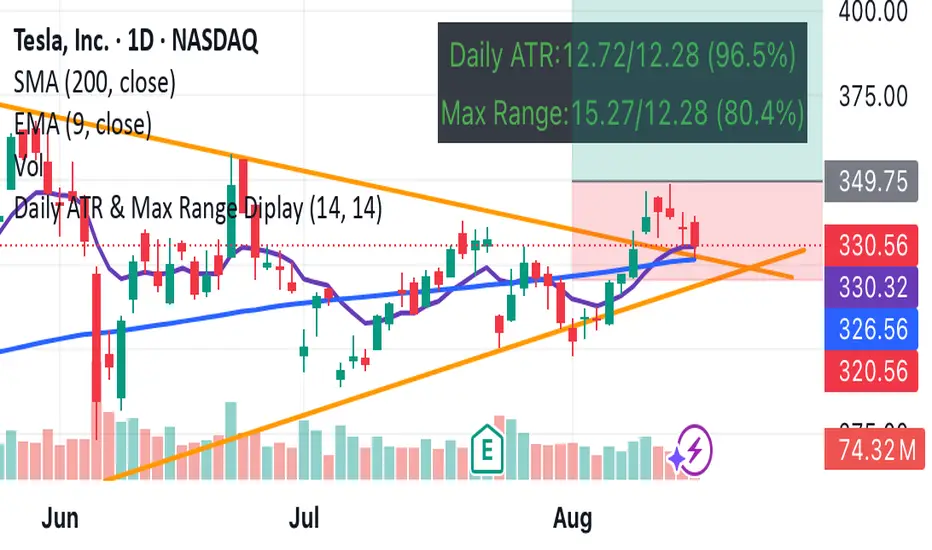
Daily Buy/Sell Triggers + ATR TargetsThis tool gives you a once-per-day, objective ATR map: Buy Trigger above the open, Sell Trigger below the open, clean ATR targets, and FULL ATR extremes. It’s designed for clarity, precision, and zero intraday repainting so you can plan the session and execute with confidence.
This indicator prints a new, static grid of intraday levels every New York 18:00 (end of the NY trading day). The grid is anchored at the day’s open and spaced by the Daily ATR so you get tick-precise Buy Trigger, Sell Trigger, intermediate ATR targets, and the FULL ATR bounds for the session.
The levels act as objective support/resistance and intraday measuring sticks for continuation, mean-reversion, and range expansion trades.
What you see on the chart
A thin midline at the Daily Open (anchor).
Green lines above, red lines below, spaced at your chosen ATR multiples.
Text at the far right for:
Buy trigger
Sell trigger
FULL ATR (both sides)
Intermediate targets are unlabeled to keep the chart clean (they’re still tradable S/R).
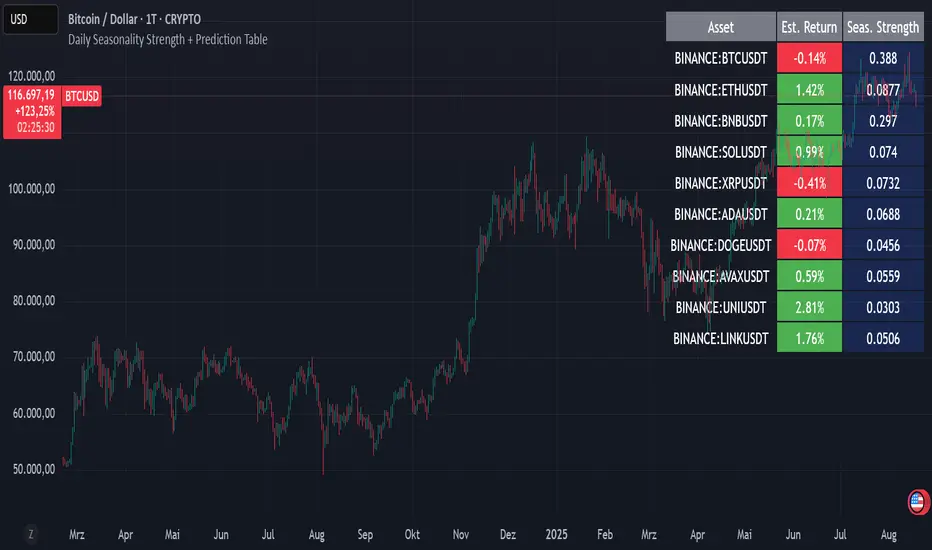
Daily Seasonality Strength + Prediction TableDaily Seasonality Strength + Prediction Table
Return Estimates:
This indicator uses historical price data to calculate average returns for each day (of the week or month) and uses these to predict the next day’s return.
Seasonality Strength:
It measures seasonality strength by comparing predicted returns with actual returns, using the inverse of MSE (higher values mean stronger seasonality).
supports up to 10 assets
This script is for informational and educational purposes only. It does not constitute financial, investment, or trading advice. I am not a financial advisor. Any decisions you make based on this indicator are your own responsibility. Always do your own research and consult with a qualified financial professional before making any investment decisions.
Past performance is no guarantee of future results. The value of the instruments may fluctuate and is not guaranteed
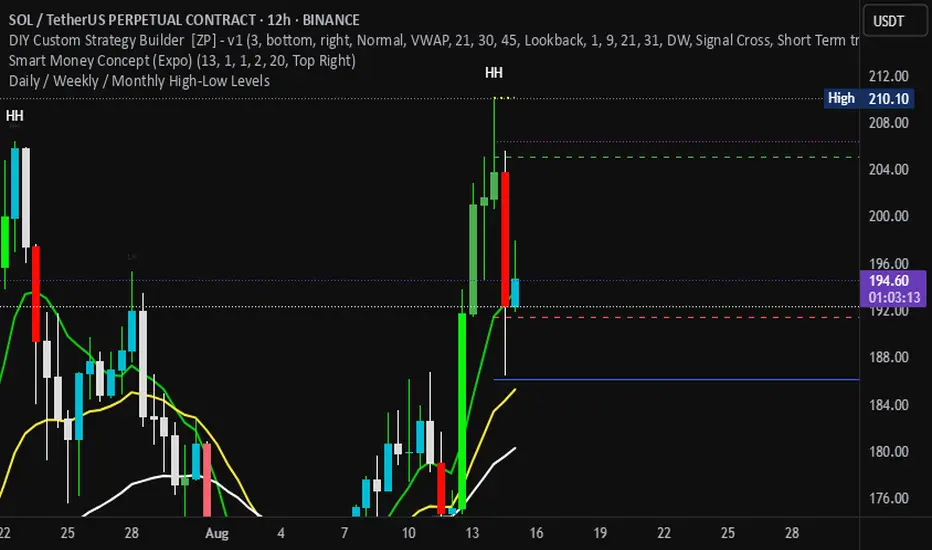
Daily / Weekly / Monthly High-Low Levels (Arindam )How it works:
Daily levels are taken from the previous day.
Weekly levels are from the previous week.
Monthly levels are from the previous month.
They extend across the chart for visual reference.
You can customize colors, line styles, or whether they reset each session.
Do you want me to also add labels on the right side (e.g., “Daily High”, “Weekly Low”) so the lines are clearly marked?
Daily Pivot Points + R1 S1 R2 S2 with PricesThis indicator automatically plots daily pivot points (PP) along with the first and second resistance (R1, R2) and support (S1, S2) levels on your chart. Each level is clearly labeled with its price, making it easy to identify key areas for potential reversals or breakouts. Perfect for day traders and swing traders looking for reliable intraday support and resistance zones.

Daily Levels3 simple daily levels
Todays Open will label any historical points an yesterdays close
There are plenty of these available but they all seemed overly complex so I adapted this to suit my needs
This indicator plots customizable daily session levels (Today's Open, Previous High/Low/Close) on intraday charts, with options for historical days back, session start/close times, labels, colours, and visibility. Ideal for forex and stock traders analysing prior sessions.

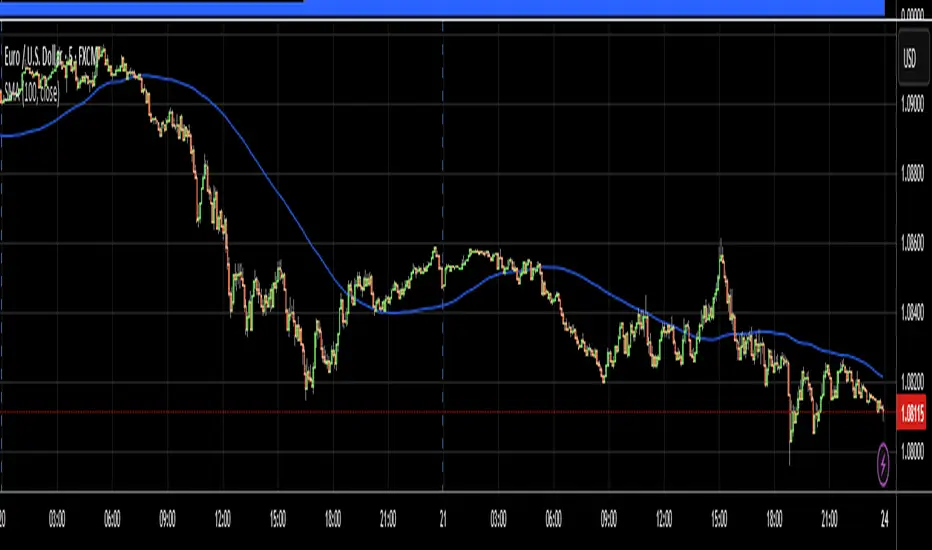
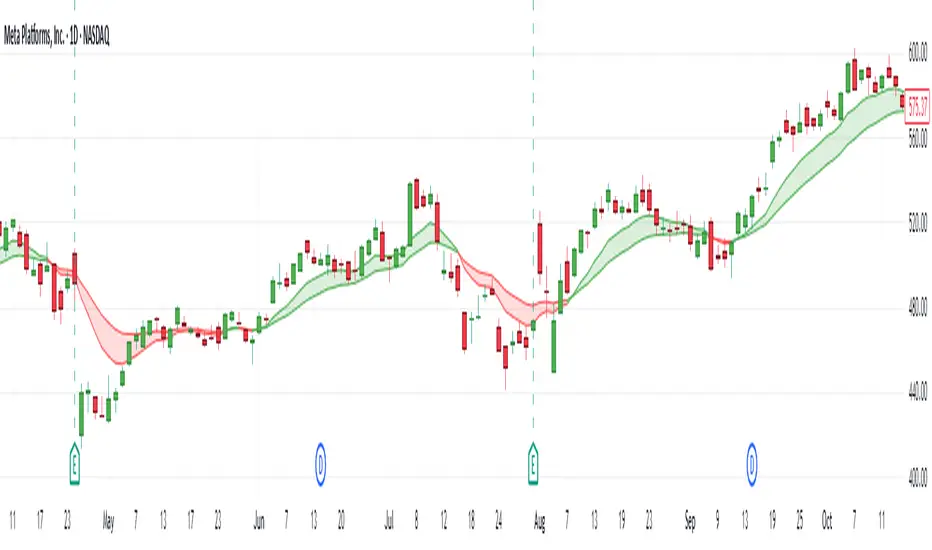
Daily EMA Cloud on Smaller TimeframesSee the daily cloud on any time frame... Colors and Exponential Moving Average (EMA) are adjustable settings.
Daily EMA-21/34/50The EMAs and color coding can be changed, by default it contains 21/34/50 on Daily, The script can be edited to suit the timeframe whichever wanted

Daily Performance Analysis [Mr_Rakun]The Daily Performance Analysis indicator is a comprehensive trading performance tracker that analyzes your strategy's success rate and profitability across different days of the week and month. This powerful tool provides detailed statistics to help traders identify patterns in their trading performance and optimize their strategies accordingly.
Weekly Performance Analysis:
Tracks wins/losses for each day of the week (Monday through Sunday)
Calculates net profit/loss for each trading day
Shows profit factor (gross profit ÷ gross loss) for each day
Displays win rate percentage for each day
Monthly Performance Analysis:
Monitors performance for each day of the month (1-31)
Provides the same detailed metrics as weekly analysis
Helps identify monthly patterns and trends
Add to Your Strategy:
Copy the performance analysis code and integrate it into your existing Pine Script strategy
Optimize Strategy: Use insights to refine entry/exit timing or avoid trading on poor-performing days
Pattern Recognition: Identify which days of the week/month work best for your strategy
Risk Management: Avoid trading on historically poor-performing days
Strategy Optimization: Fine-tune your approach based on empirical data
Performance Tracking: Monitor long-term trends in your trading success
Data-Driven Decisions: Make informed adjustments to your trading schedule

Daily EMAs (8, 21 & 50) with BandDescription:
This script plots the Daily EMAs (8, 21, and 50) on any intraday or higher timeframe chart. It provides a clear, multi-timeframe view of market trends by using daily exponential moving averages (EMAs) and a dynamic visual band. I use this on the major indexes to decide if I should be mostly longing or shorting assets.
-In addition to identifying the trend structure, the 8-Day EMA often serves as a key area where buyers or sellers may become active, depending on the market direction:
-In an uptrend, the 8 EMA can act as a dynamic support zone, where buyers tend to re-enter on pullbacks.
-In a downtrend, the same EMA may act as resistance, where sellers become more aggressive.
-The script also includes a colored band between the 8 and 21 EMAs to highlight the short-term trend bias:
-Green fill = 8 EMA is above the 21 EMA (bullish structure).
Blue fill = 8 EMA is below the 21 EMA (bearish structure).
The 50-Day EMA is included to give additional context for intermediate-term trend direction.
Features:
- Daily EMA levels (8, 21, and 50) calculated regardless of current chart timeframe.
- 8 EMA acts as a potential buyer/seller zone based on trend direction.
- Color-coded band between 8 and 21 EMAs:
- Green = Bullish short-term bias
- Blue = Bearish short-term bias
- Customizable price source and EMA offset.
- Suitable for trend trading, pullback entries, and higher-timeframe confirmation.
Use Cases:
Identify key dynamic support/resistance areas using the 8 EMA.
Assess short-, medium-, and intermediate-term trend structure at a glance.
Enhance confluence for entry/exit signals on lower timeframes.

Daily Trading Barometer (DTB) with DJIA OverlayThe "Daily Trading Barometer (DTB) with DJIA Overlay" is a custom technical indicator designed to identify intermediate-term overbought and oversold conditions in the stock market, inspired by Edson Gould's original DTB methodology. This indicator combines three key components:
A 7-day advance-decline oscillator, a 20-day volume oscillator, and a 28-day DJIA price ratio, normalized into a composite index scaled around 110–135. Values below 110 signal potential oversold conditions, while values above 135 indicate overbought territory, aiding in timing market reversals.
The overlay of a normalized DJIA plot allows for visual correlation with the broader market trend. Use this tool to anticipate turning points in oscillating markets, though it’s best combined with other indicators for confirmation. Ideal for traders seeking probabilistic insights into bear or bull market transitions.
How to use -
If the DTB line (blue) and normalized DJIA (orange) are under the green dashed line, high probability for a long and reversal.
Use with the symbol SPX/QQQ
Dow Jones Industrial Average - DJIA

Daily Open Line (9:30-16:00)This indicator automatically plots a horizontal line at each day's opening price during regular trading hours (9:30 AM to 4:00 PM, US Eastern Time).
The line starts exactly at the opening bar of the day and ends at the close (16:00).
Each day, a new line is drawn, making it easy to visualize and reference the daily open price throughout the session.
Useful for intraday traders to identify key support/resistance and monitor price action relative to the open.
You can customize the color, line width, and whether to display the open price label.

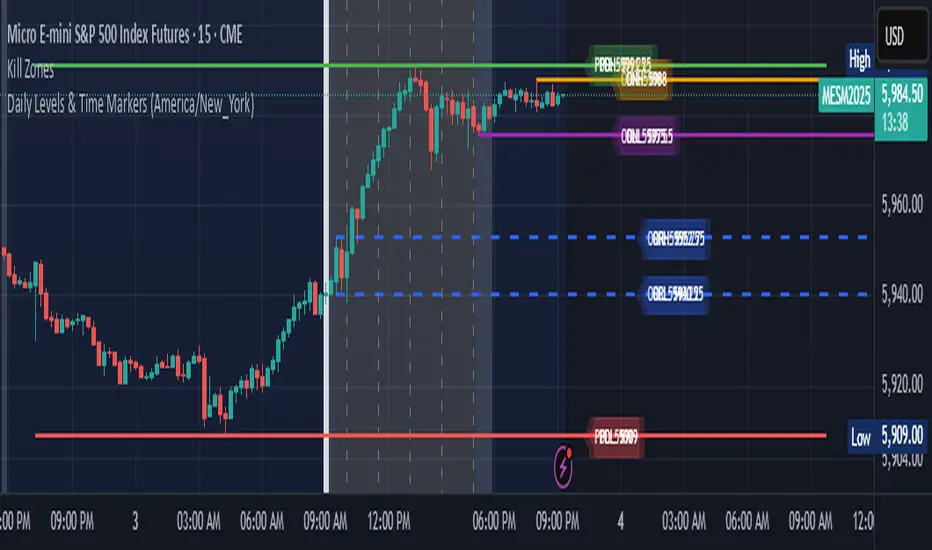
Daily Levels & Time MarkersKey Features:
Price Level Tracking:
Previous Day High/Low (PDH/PDL) - Shows yesterday's highest and lowest prices as horizontal lines
Overnight High/Low (ONH/ONL) - Tracks the highest and lowest prices during overnight sessions (4:00 PM to 9:30 AM ET)
Opening Range High/Low (ORH/ORL) - Captures the price range during the first 30 minutes of regular trading (9:30-10:00 AM ET)
Visual Elements:
Draws horizontal lines for previous day levels that extend across the chart
Creates rays (extending lines) for overnight and opening range levels that project forward from when they were established
Uses different colors and line styles for each level type (solid lines for daily levels, dashed for opening range)
Adds text labels showing the exact price values (PDH, PDL, ONH, ONL, ORH, ORL)
Time Markers:
Draws vertical dashed lines at key trading times: 10:00 AM, 11:30 AM, 1:00 PM, 2:30 PM, and 4:00 PM ET
Uses Eastern Time zone by default but allows customization
Customization Options:
Toggle each feature on/off independently
Customize colors for all line types
Adjust timezone settings
Daily ADR TableDaily ADR Table Indicator
The Daily Average Daily Range (ADR) Table displays real-time volatility statistics directly on your chart. It shows both the current day's range and the historical average daily range as percentages of the current price, providing essential volatility metrics for trading decisions.
The indicator tracks today's range in real-time throughout the trading session using session-based calculations to ensure accuracy. It compares this against a customizable historical average (default 20 days, adjustable from 1-500 days) to help traders assess whether current volatility is above or below normal levels.
All values are displayed as percentages for easy comparison across different price levels and formatted to two decimal places for precision. The table position, text size, alignment, and colors are fully customizable with nine position options and professional default styling optimized for readability.
This indicator is valuable for day traders, swing traders, and market analysts who need to quickly assess current market volatility relative to historical norms. It assists in position sizing decisions, setting stop losses, and identifying potential breakout or consolidation scenarios based on range expansion or contraction.

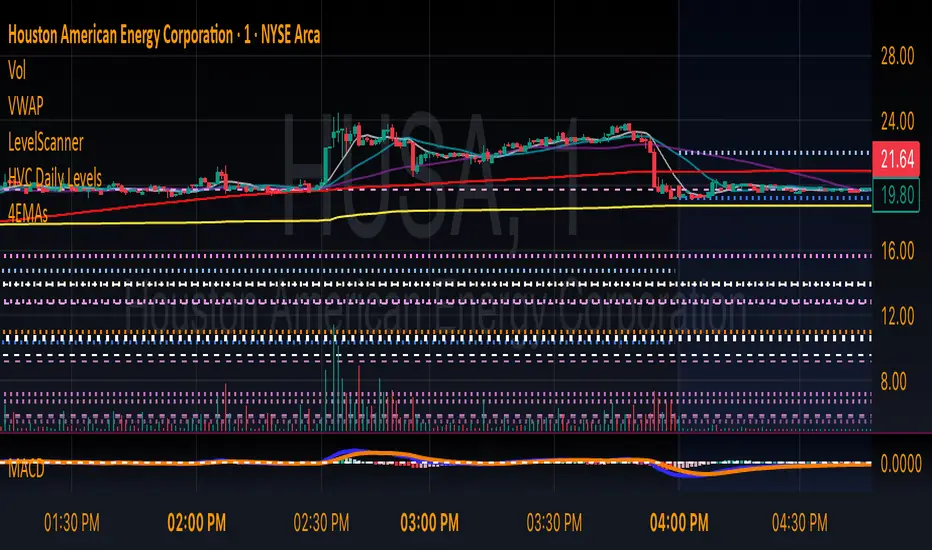
HVC Daily LevelsDaily High Volume Candle Levels Marked on all Timeframes
HVC Level Sentinel v6 — High Volume Candle Levels
HVC Level Sentinel v6 automatically detects and highlights “High Volume Candles” (HVCs) — bars with the highest trading volume in a rolling, user-defined window (e.g., 30 days). This tool helps you spot key price levels where significant trading activity occurred, which can act as important support or resistance zones.
Features
Customizable Lookback: Choose how many bars to look back for HVC detection (default: 30 days, adjustable).
Automatic Highlighting: HVC candles are highlighted on your chart with a customizable color.
Level Lines: Draws horizontal lines at the Open, High, Low, and Close of each recent HVC, so you can easily track these key levels.
Line Fading: Only the most recent N HVCs (user-adjustable) have lines, with older lines fading out or disappearing for clarity.
Per-Line Control: Turn on/off Open, High, Low, and Close lines individually in the settings.
Fully Customizable: Adjust colors, line styles, widths, and opacity to fit your chart style.
How It Works
On each new bar, the script checks if the current bar’s volume is the highest in the last N bars.
If so, it marks the bar as an HVC and draws lines at its O/H/L/C (if enabled).
You can highlight all HVCs historically, but only the most recent N will have lines for a clean, focused chart.
Use Cases
Identify major breakout or reversal points driven by high volume.
Track where institutional or “smart money” activity may have occurred.
Use HVC levels as dynamic support/resistance for entries, exits, or stop placement.
Tip :
Adjust the lookback window and number of HVCs with lines to match your trading style—shorter for active trading, longer for swing/position trading.
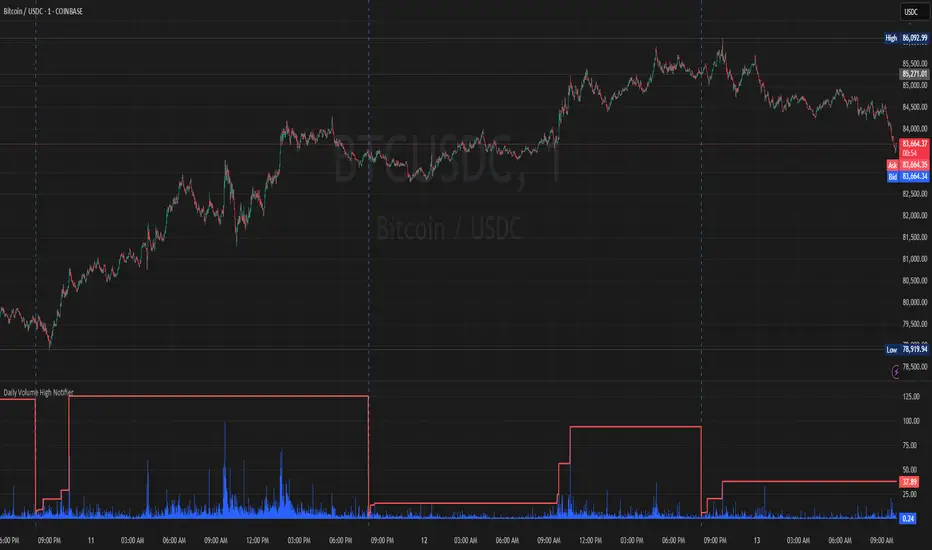
Daily Volume High Notifier📜 Script Description – Daily Volume High Notifier
This indicator monitors trade volume and sends an alert whenever a new daily high in volume is reached. The high volume is reset at the beginning of each trading day, allowing traders to stay informed of significant intraday volume spikes.
🛠️ Features:
Tracks the highest trade volume for the current day.
Resets the volume high tracker at the start of each new day.
Sends a real-time notification (alert()) whenever a new volume high is detected.
Useful for identifying unusual activity, potential breakouts, or institutional participation.
📊 Visual Elements:
Blue histogram for standard volume.
Red line showing the current day’s highest volume so far.
🔔 How to Use:
Add the script to any chart.
Enable alerts using the built-in alert() function.
Receive notifications every time volume hits a new high for the day.
🔔 Setting up Alerts in TradingView:
After adding this indicator to your chart:
Click the Alarm Clock (Alerts) icon.
Set condition: Daily Volume High Notifier → alert() function call .
Choose your alert type (app notification, email, popup, etc.).
Name it something like "Volume High Alert" and hit Create.
This tool is ideal for day traders, scalpers, and volume-based strategy traders who want to be instantly notified of spikes in market activity.
Daily Performance HeatmapThis script displays a customizable daily performance heatmap for key assets across crypto, equities, bonds, commodities, currencies, and volatility indices.
Each cell shows the current price and the percent change since the daily open, color-coded using a gradient from negative to positive. Assets are arranged in a left-to-right, top-down grid, with adjustable layout and styling.
⚙️ Features:
🔢 Displays current price and daily % change
🎨 Color-coded heatmap using customizable gradients
🧱 Adjustable layout: number of columns, cell size, and text size
🧠 Smart price formatting (no decimals for BTC, Gold, etc.)
🪟 Clean alignment with padded spacing for UI clarity
🛠️ Future plans:
User-input asset lists and labels
Category grouping and dynamic sorting
Optional icons, tooltips, or alerts

Daily LevelsOverview:
The Daily Levels indicator plots key price levels from the previous trading day, including the high, low, median (pivot), and projected extensions. These levels help traders identify potential support/resistance zones and anticipate breakout or reversal opportunities.
Key Features:
✅ Previous Day High & Low – Visualizes the prior day’s high and low as dynamic support/resistance levels.
✅ Median (Pivot) Line – Calculates the midpoint between the previous day’s high and low, acting as a key intraday reference.
✅ Projected Levels – Extends the high/low range symmetrically above and below the median, highlighting potential breakout zones.
✅ Customizable Display – Toggle visibility, adjust colors, and modify line styles (solid, dotted, dashed).
✅ Price Labels – Clear on-chart labels showing exact price values for quick reference.
✅ Built-in Alerts – Get notified when price crosses any of the key levels.
How to Use:
Trend Identification: If price holds above the median, the bias is bullish; below suggests bearish momentum.
Breakout Trading: Watch for moves beyond the projected levels for potential continuation.
Mean Reversion: Fade moves toward the previous day’s high/low if the median holds as support/resistance.
Ideal For:
Day Traders – Intraday support/resistance levels.
Swing Traders – Context for multi-day trends.
Breakout/Reversal Strategies – Clear levels for trade triggers.
Settings Recommendations:
High/Low Lines: Use semi-transparent colors (e.g., green/red) for clarity.
Projections: Helpful for anticipating extended moves (e.g., teal for upper, orange for lower).
Alerts: Enable notifications for key crosses (e.g., median or high/low breaks).

Daily Bollinger Band StrategyOverview of the Daily Bollinger Band Strategy
1. Strategy Overview and Features
This strategy is a tool for backtesting a trading method that uses Bollinger Bands. It is *not* a tool for automated trading.
1-1. Main Display Items
The main chart displays the Bollinger Bands and the 200-day moving average.
It also shows the entry and exit points along with the position size (in units of 100 shares).
1-2. Summary of Trading Rules
For long (buy) strategies, the trade enters when the price crosses above the +1σ line of the Bollinger Bands, aiming to ride an upward trend. The position is exited when the price crosses below the middle band.
For short (sell) strategies, the trade enters when the price crosses below the -1σ line of the Bollinger Bands, aiming to ride a downward trend. The position is exited when the price crosses above the middle band.
1-3. Strategic Enhancements
The strategy uses the slope of the 200-day moving average to determine the trend direction and enter trades accordingly. This improves the win rate and payoff ratio.
Additionally, to reduce the probability of ruin, the risk per trade is limited to 1.0% of capital, and position sizing is adjusted using ATR (a volatility indicator).
2. Trading Rules
2-1. Chart Type
Only daily charts are used.
2-2. Indicators Used
(1) Bollinger Bands** (used for entry and exit signals)
- Period: Fixed at 80 days
- Upper and lower bands: Fixed at ±1σ
(2) Moving Average** (used to determine trend direction)
- Period: Fixed at 200 days
- Trend direction is judged based on whether the difference from the previous day is positive (upward) or negative (downward)
2-3. Buy Rules
Setup:
- Price crosses above the +1σ line from below
- Both the middle band and 200-day moving average are upward sloping
Entry:
- Buy at the next day’s market open using a market order
Exit:
- If the price crosses below the middle band, sell at the next day’s open using a market order
2-4. Sell Rules
Setup:
- Price crosses below the -1σ line from above
- Both the middle band and 200-day moving average are downward sloping
Entry:
- Sell at the next day’s market open using a market order
Exit:
- If the price crosses above the middle band, buy back at the next day’s open using a market order
2-5. Risk Management Rules
- Risk per trade: 1.0% of total capital (acceptable loss = capital × 1.0%)
- Position size: Acceptable loss ÷ 2ATR (rounded down to the nearest unit of 100 shares)
2-6. Other Notes
- No brokerage fees
- No pyramiding
- No partial exits
- No reverse positions (no “stop-and-reverse” trades)
3. Strategy Parameters
The following settings can be specified:
3-1. Period Settings
- Start date: Set the start date for the backtest period
- Stop date: Set the end date for the backtest period
3-2. Display of Trend and Signals
- Show trend: When checked, the background color of the bars is light red for an uptrend and light blue for a downtrend
- Show signal: When checked, entry and exit signals are displayed (note: signals are executed at the next day’s open, so there is a one-day lag in the display)
3-3. Capital Management Settings
- Funds: Capital available for trading (in JPY)
- Risk rate: Specify what percentage of the capital to risk per trade
Settings in the “Properties” tab are not used in this strategy.
4. Backtest Results (Example)
Here are the backtest results conducted by the author:
- Target Stocks: All components of the Nikkei 225
- Test Period: January 4, 2000 – December 30, 2024
- Data Points: 12,886
- Win Rate: 33.45%
- Net Profit: ¥82,132,380
- Payoff Ratio: 2.450
- Expected Value: ¥6,373.8
- Risk Rate: 1.0%
- Probability of Ruin: 0.00%
---
デイリー・ボリンジャーバンド・ストラテジーの概要
1. ストラテジーの概要と特徴
このストラテジーは、ボリンジャーバンドを使ったトレード手法のバックテストを行うツールです。自動売買を行うツールではありません。
1-1. 主な表示項目
メインチャートにボリンジャーバンドと 200日移動平均線を表示します。
また、エントリーと手仕舞いのタイミングと数量(100株単位)も表示されます。
1-2. トレードルールの概要
買い戦略の場合、ボリンジャーバンドの +1σ 超えでエントリーして上昇トレンドに乗り、ミドルバンドを割ったら決済します。
売り戦略の場合、ボリンジャーバンドの -1σ 割りでエントリーして下降トレンドに乗り、ミドルバンドを上抜けたら決済します。
1-3. ストラテジーの工夫点
200日移動平均線の傾きを見てトレンド方向にエントリーをしています。こうして勝率とペイオフレシオの成績を向上しています。
また、破産確率を抑えるために、リスク資金比率を 1.0% にして、ATR(ボラティリティ指標) を使って注文数を調整しています。
2. 売買ルール
2-1. 使用するチャート
日足チャートに限定します
2-2. 使用する指標
(1) ボリンジャーバンド(仕掛けと手仕舞いのシグナルに使用)
期間は80日に固定
上下バンドは ±1σ に固定
(2) 移動平均線(トレンドの方向を見るために使用)
期間は200日に固定
移動平均の値の前日との差がプラスのとき上向き、マイナスのとき下向きと判断
2-3. 買いのルール
セットアップ:ボリンジャーバンドの +1σ を価格が下から上に交差 かつ ミドルバンドと 200日移動平均線が上向き
仕掛け:翌日の寄り付きに成行で買う
手仕舞い:ボリンジャーバンドのミドルバンドを価格が上から下に交差したら、翌日の寄り付きに成行で売る
2-4. 売りのルール
セットアップ:ボリンジャーバンドの -1σ を価格が上から下に交差 かつ ミドルバンドと 200日移動平均線が下向き
仕掛け:翌日の寄り付きに成行で売る
手仕舞い:ボリンジャーバンドのミドルバンドを価格が下から上に交差したら、翌日の寄り付きに成行で買い戻す
2-5. 資金管理のルール
リスク資金比率:資産の 1.0%(許容損失 = 資産 × 1.0%)
注文数:許容損失 ÷ 2ATR(単元株数未満は切り捨て)
2-6. その他
仲介手数料:なし
ピラミッディング:なし
分割決済:なし
ドテン:しない
3. ストラテジーのパラメーター
次の項目が指定できます。
3-1. 期間の設定
Staer date : バックテストの検証期間の開始日を指定します
Stop date : バックテストの検証期間の終了日を指定します
3-2. トレンドとシグナルの表示
Show trend : チェックを入れると、バーの背景色が、トレンドが上昇のときは薄い赤で、下落のときは薄い青で表示されます
Show signal : チェックを入れると、エントリーと手仕舞いのシグナルを表示します(シグナルの出た翌日の寄り付きに売買をするので表示に1日のずれがあります)
3-3. 資金管理用の設定
Funds : トレード用の資金(円)
Risk rate : 許容損失を資金の何%にするかで指定します
「プロパティタブ」で設定する値は、このストラテジーでは有効ではありません。
4. バックテストの結果(例)
作者がバックテストを実施した結果をお知らせします。
対象銘柄:日経225構成銘柄すべて
対象期間:2000年1月4日~2024年12月30日
データ件数:12,886
勝率:33.45%
純利益:82,132,380
ペイオフレシオ:2.450
期待値:6,373.8
リスク資金比率:1.0%
破産確率:0.00%

Daily OHLC from 8:00 UTCDisplays Daily Open, High, and Low price levels, resetting at 8:00 AM UTC each day. Ideal for intraday trading reference points.

Daily ProtractorDaily Protractor Indicator
Overview
The Daily Protractor is a visually intuitive tool designed for traders who want to analyze price action through angular measurements on a 5-minute chart. By overlaying a protractor on the chart, this indicator helps identify potential support, resistance, and trend directions based on angular relationships from the first 5-minute candle of each day. It’s particularly useful for intraday traders looking to incorporate geometric analysis into their strategies for spot or strike charts.
Key Features
Dynamic Protractor Overlay: Draws a protractor centered on the low of the first 5-minute candle of each day, with customizable radius in both bars (horizontal) and price units (vertical).
Angular Measurements: Displays angles in 5-degree increments, covering a full 360° circle or a 105° to -105° (91° to 269°) half-circle, depending on user preference.
Customizable Display:
Adjust the number of days to display protractors (up to 5 days).
Customize line colors for different angle ranges (0° to 180°, 180° to 360°, and 0° specifically).
Modify line thickness, label size, and label colors for better visibility.
Center Point Highlight: Marks the center of each protractor with a labeled point for easy reference.
Efficient Design:
Optimized with max_lines_count, max_labels_count, and max_bars_back to ensure smooth performance on TradingView.
How It Works
The indicator identifies the first 5-minute candle of each day and uses its low price as the center point for a protractor. It then draws lines at 5-degree intervals, radiating from the center, with each line representing an angle from 0° to 360°. Labels at the end of each line display the angle in degrees, with negative values shown for angles between 195° and 345° (e.g., 270° is displayed as -90°). The protractor’s radius can be adjusted in both time (bars) and price units, allowing traders to scale the tool to their chart’s characteristics.
Usage Instructions
Add to Chart:
Apply the indicator to a 5-minute chart of your chosen instrument (e.g., spot or strike charts).
Interpret the Protractor:
Use the angular lines to identify potential price levels or trend directions.
The 0° line (horizontal) can act as a reference for horizontal support/resistance.
Angles between 0° and 180° (upper half) and 180° and 360° (lower half) are color-coded for quick identification.
Customize Settings:
Toggle the Show 105° to -105° option to display a half-circle (91° to 269°) instead of a full 360° protractor.
Adjust the Radius in Bars and Radius in Price Units to scale the protractor to your chart.
Set the Maximum Days to Display to control how many daily protractors are shown.
Modify line thickness, colors, and label settings to suit your visual preferences.
Customization Options
Protractor Settings:
Show 105° to -105° (91° to 269°): Toggle between a full circle or a half-circle protractor.
Radius in Bars: Set the horizontal span of the protractor (default: 75 bars).
Radius in Price Units: Set the vertical span in price units (default: 1000.0).
Maximum Days to Display: Limit the number of protractors shown (default: 5 days).
Line Settings:
Line Thickness: Adjust the thickness of the protractor lines (1 or 2).
Line Color (0° to 180°): Color for the upper half (default: light blue).
Line Color (180° to 360°): Color for the lower half (default: light red).
Line Color (0°): Color for the 0° line (default: black).
Label Settings:
Label Size: Choose between small, normal, or large labels.
Label Color (0° to 180°): Color for labels in the upper half (default: red).
Label Color (180° to 360°): Color for labels in the lower half (default: green).
Notes
The indicator was designed with the help of Grok3 for use on 5-minute charts only, as it relies on the first 5-minute candle of the day to set the protractor’s center.
For best results, adjust the radius settings to match the volatility and price scale of your instrument. However, where the price is in single digits it is advised to switch off the labels or I would suggest not to use the same.
The protractor can be used alongside other technical tools to confirm trends, reversals, or key price levels.
Limitations: This cannot be used on instruments that trade for more than 75 candles with a timeframe of 5 minutes as the angles would not cover the entire trading window. I am working coming up with a script to address this limitation.
Feedback
I’d love to hear your thoughts! If you find the Daily Protractor helpful or have suggestions for improvements, please leave a comment or reach out. Happy trading!

Daily Range %The Daily Range % Indicator calculates and plots a percentage of the daily range (high to low) based on a custom lookback period. It identifies outside bars from past daily data, prioritizing the most recent unbroken range. If no outside bar is found, it defaults to yesterday's range. The selected percentage of this range is then displayed on the chart, updating once per 5-minute bar (or the chosen resolution).