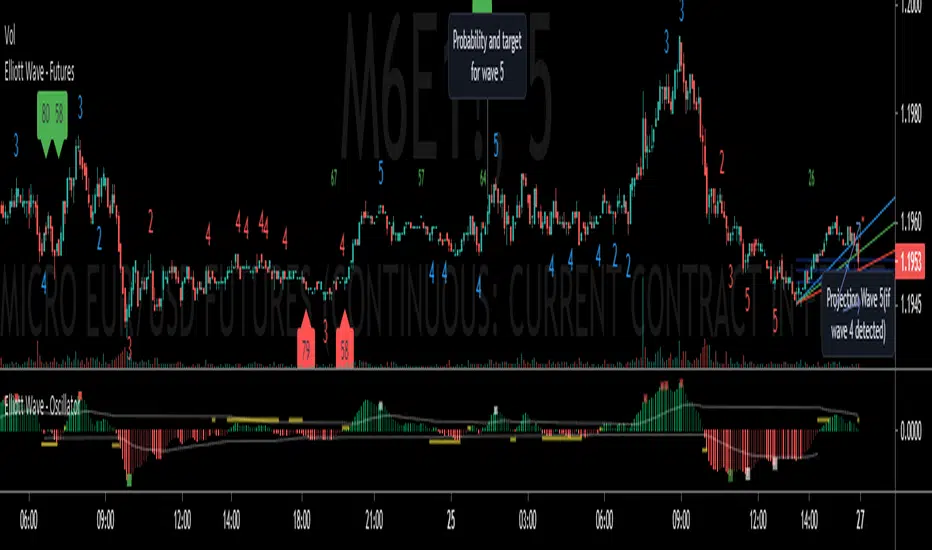
Elliott Wave - FuturesElliott Wave, indicating possible waves 2, 3, 4 and 5
Based on my Elliott Wave - Oscillator, this signals are converted into numbers displayed on chart:
Waves2, Waves3, Waves4, Waves5:
- Indicated on Chart with numbers
Fib fan Wave 4 retracement
- Blue, green and red lines for optimum retracement
Probability and target for wave 5
- Plotted when wave 4 is found
- Stays visible in chart
- Target is based on Daily Fibonnacci
- Probability: If current trend volume is bigger than previous opposite wave trend volume, probability is painted with color of trend background(for a trend to continue, value is recommended bigger than 35)
Projection Wave 4 (if wave 3 detected) and Projection Wave 5(if wave 4 detected)
- Only displayed when waves are active, else not displayed and not saved on chart
- For upside trend 2 blue target lines are displayed based on Daily Fibonnacci
- For downside trend 2 red target lines are displayed based on Daily Fibonnacci
REMINDER OF OSCILATOR USE:
Waves3: Indicated in RED Line(Upwards) and Green Line(Downwards)
- Detects wave greater than SMA
Waves4: Maximum height indicated in yellow Line
- Detects when wave greater than SMA (Wave 3 or 5) approaches wave 4 regression point
Waves5: Indicated in White Line
- Detects divergence in oscilator and price, meaning end of trend
Appreciate any suggestions, collaboration, comments or ideas.
Detects Waves 2, 3 , 4 and 5
Fib fan Wave 4 retracement
Probability and target for wave 5
Projection Wave 4 (if wave 3 detected)
Projection Wave 5(if wave 4 detected)
Alerts for Waves 2, 3, 4 and 5
Better and accurate targets for waves based on Futures
Cari dalam skrip untuk "elliott"
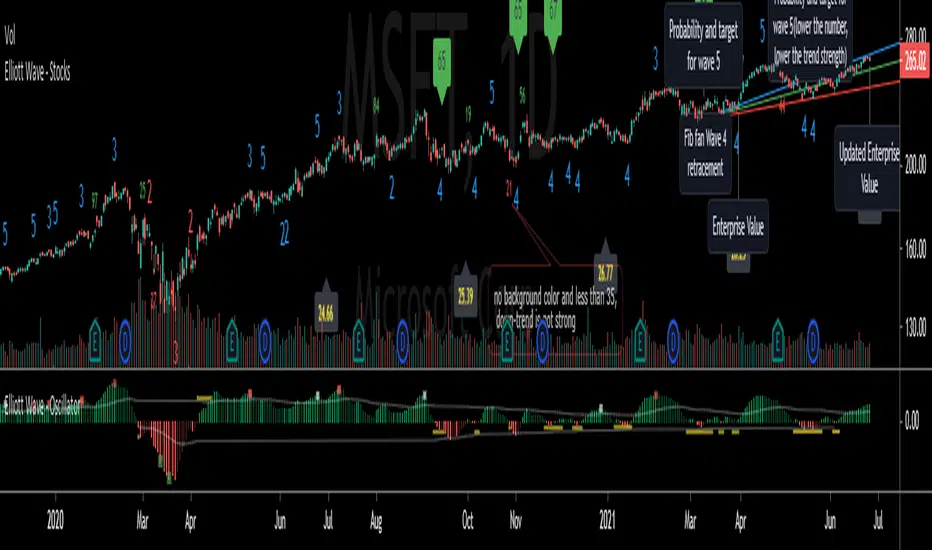
Elliott Wave - StocksElliott Wave, indicating possible waves 2, 3, 4 and 5
Based on my Elliott Wave - Oscillator, this signals are converted into numbers displayed on chart:
Waves2, Waves3, Waves4, Waves5:
- Indicated on Chart with numbers
Fib fan Wave 4 retracement
- Blue, green and red lines for optimum retracement
Probability and target for wave 5
- Plotted when wave 4 is found
- Stays visible in chart
- Target is based on Monthly Fibonnacci
- Probability: If current trend volume is bigger than previous opposite wave trend volume, probability is painted with color of trend background(for a trend to continue, value is recommended bigger than 35)
Projection Wave 4 (if wave 3 detected) and Projection Wave 5(if wave 4 detected)
- Only displayed when waves are active, else not displayed and not saved on chart
- For upside trend 2 blue target lines are displayed based on Monthly Fibonnacci
- For downside trend 2 red target lines are displayed based on Monthly Fibonnacci
Fundamentals: Enterprise Value
- Displayed when financial reports are updated to database
- Also displayed the latest calculated enterprise value with current stock price and last financial report
REMINDER OF OSCILATOR USE:
Waves3: Indicated in RED Line(Upwards) and Green Line(Downwards)
- Detects wave greater than SMA
Waves4: Maximum height indicated in yellow Line
- Detects when wave greater than SMA (Wave 3 or 5) approaches wave 4 regression point
Waves5: Indicated in White Line
- Detects divergence in oscilator and price, meaning end of trend
Appreciate any suggestions, collaboration, comments or ideas.
Detects Waves 2, 3 , 4 and 5
Fib fan Wave 4 retracement
Probability and target for wave 5
Projection Wave 4 (if wave 3 detected)
Projection Wave 5(if wave 4 detected)
Alerts for Waves 2, 3, 4 and 5
Fundamentals: Enterprise Value
Better and accurate targets for waves based on Stocks
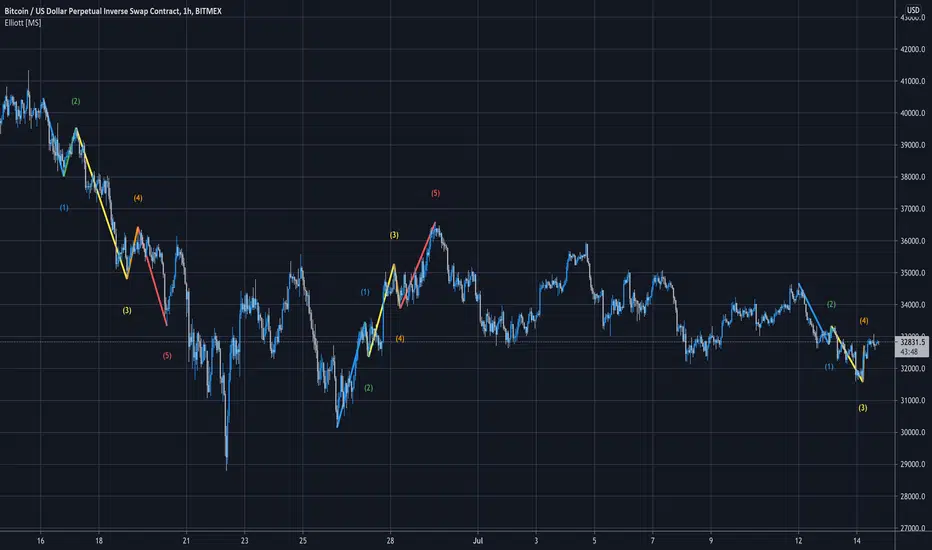
Elliott Wave [MS]Elliott Wave counter for TradingView! Automatically count Elliott waves on any asset and any timeframe. The script will count in-progress patterns as well as show past patterns that have completed (adjustable in Settings).
Simple to use, just add to your chart and choose how big of waves you're looking for with the Size setting.
Smaller numbers will auto count smaller sized Elliott Waves.
Larger numbers will auto count bigger sized Elliott Waves.
Scan for multiple size waves by adding the indicator to your chart multiple times.
Settings
Size - Set how big or small of waves you want to scan for
Hide Failed Patterns - Show or hide past waves that didn't get to 5
Color Mode - Set your own colors for each wave
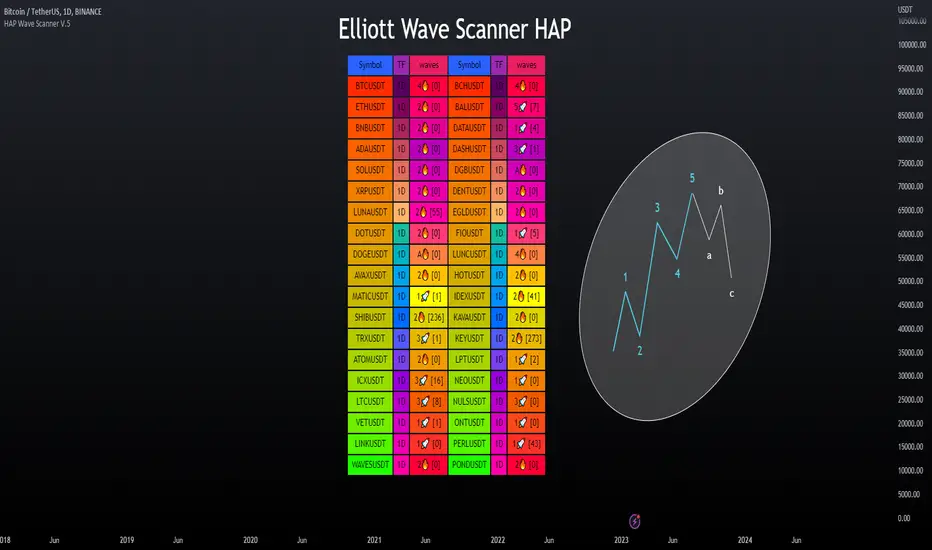
Elliott Wave Scanner - HAP [PRO] ▶Elliott Wave Scanner
This is an added feature of the wave drawing version, but this version is used for scanning multiple currency pairs simultaneously, based on the custom list you have specified as your preferred ones, making it more convenient for you.
This :
════════════════════════
This will be an adjustment of the number bars to be similar to the version in the drawing wave, with the only difference being that this version will be a scan of multiple waveforms simultaneously, including the input data format. It is recommended to only change the numbers, maintaining the original structure to avoid any errors, as demonstrated in the example below.
This is a valid example.👇
Wave0= (21),
Wave1= (13),
Wave2= (8),
Wave3= (21),
Wave4= (13),
Wave5= (34),
WaveA= (13),
WaveB= (8),
WaveC= (21)
**Kindly note to specify the numerical sequence of each wave. Parentheses should always be preceded by a comma and conclude on the final line without one.
════════════════════════
▶Let's take a look at the different parts of the scanned version.
════════════════════════
🎯 Bringing in the RSI to help make decisions, as referenced in the book by "Jason Perl".
if the market is advancing as part of a bullish HAP WAVE up sequence, then the RSI should remain above `40` during corrective setbacks for HAP WAVEs 2 and 4. Similarly, if the market is declining as part of a bearish HAP WAVE down sequence, then the RSI should remain beneath 60 during corrective for HAP WAVEs 2 and 4
For example, an uptrend in Wave tends to cause an RSI divergence between Wave 5 and Wave 3. When Wave 5 exceeds Wave 3, the RSI is often seen at Wave 5, which is lower than Wave 3.

Elliott Wave - HAP [PRO] █ OVERVIEW
Meet HAP WAVE's real-time automated wave drawing tool on the chart. HAP WAVES Indicator is a technical analysis tool that uses Elliott Wave Theory and various technical indicators to analyze price and volume data in financial markets, such as crypto, stocks, and forex. It automatically draws Elliott Waves on the chart in real-time and provides features to identify potential buy and sell signals. The indicator can be used to identify target areas for waves 3, 5, and C, and shows both downward and upward waves. Additionally, the tool displays the real-time ratio of each wave and allows users to adjust wave rules flexibly. The tool also provides pre-sign analysis to help users predict future waves and includes alerts for various events, such as the start of a wave or the failure of a wave pattern. The indicator includes a trend channel and has several pairs of scan-wave tools. including real-time wave counting
════════════════════════
🎯 Feature
• Can draw wave lines in real time, indicating at that moment what wave the market is in.
• Automatically identify the target area of waves 3, 5, and C.
• Keep drawing waves automatically. All waves
• Shows both a downward wave (Bear) and an upward wave (Bull).
• Displays the real time ratio of each wave. (when hovering over the wave number)
• Each wave rule can be adjusted flexibly.
• Pre-show signs analyze waves that may occur in the future.
• Alert yourself when you encounter waves that are likely to occur in advance.
• Notify when meeting the start of a given wave.
• Alert when wave 2,4,A,B fail
• Notify when the wave is expanding again
• Multiple alert formats (save your alert, set it up just once, and receive all alerts according to 9–12)
• Hit Trend Channel from Automatic Coupled Price Swing
*There are also several pairs of scan wave tools.
════════════════════════
🔻Components
🎯 Unlocking the Power of the Elliott Wave Theory
feature that can set the starting point of the wave. by yourself
Trend Following Of course, adding this could be an element to help you make your decision easier.
Support and resistance
🎲 Scan version
This :
================================
🎯 Explanation of the wave counter setting section
════════════════════════
⬜ Understanding its basic principles and rules
Elliott Wave Prediction
Elliott Wave Theory is a technical analysis tool that seeks to identify patterns in financial market data and to make predictions about future price movements. The theory was developed by Ralph Nelson Elliott in the 1930s and is based on the idea that financial markets move in repetitive patterns, or waves, that can be analyzed and traded.
The Elliott Wave Theory has specific rules and guidelines for counting waves and determining their characteristics, including direction, size, and duration. The theory divides waves into two categories: motive waves (1, 2, 3, 4, and 5) and corrective waves (A, B, C). Motive waves are those that move in the direction of the overall trend and are subdivided into five smaller waves. Corrective waves are those that move against the trend and are subdivided into three smaller waves.
The theory also includes guidelines for determining the end of a wave and the start of a new wave, as well as rules for determining the characteristics of each wave, such as its size and duration. By analyzing the characteristics of waves and applying the rules and guidelines of the Elliott Wave Theory, traders and investors can make informed decisions about buying and selling in financial markets.
In summary, the Elliott Wave Theory is a technical analysis tool that seeks to identify patterns in financial market data and to make predictions about future price movements. The theory is based on the idea that financial markets move in repetitive patterns, or waves, and has specific rules and guidelines for counting and analyzing these waves.
>> The Elliott Wave Theory divides financial market movements into two categories: motive waves and corrective waves. Each wave has its own cycle and purpose, and understanding these cycles is important for making informed decisions about buying and selling in financial markets.
Motive Waves: Motive waves move in the direction of the overall trend and are subdivided into five smaller waves. The five waves of a motive wave cycle are:
•Wave 1: The first wave of a motive wave cycle is often referred to as the "impulse wave." This wave represents the beginning of a new trend and is characterized by strong price movements in the direction of the trend.
•Wave 2: The second wave is a corrective wave that retraces a portion of the gains made in Wave 1. This wave is usually smaller and less intense than Wave 1.
•Wave 3: The third wave is usually the longest and strongest wave of the motive wave cycle, and it represents the continuation of the trend. This wave is characterized by strong price movements in the direction of the trend and is usually much larger than Waves 1 and 2.
•Wave 4: The fourth wave is a corrective wave that retraces a portion of the gains made in Wave 3. This wave is usually smaller and less intense than Waves 1 and 3, and it provides a temporary pause in the trend.
•Wave 5: The fifth wave is the final wave of the motive wave cycle and is usually the shortest and weakest wave. This wave represents the end of the trend and is characterized by a final push in the direction of the trend.
Corrective Waves: Corrective waves move against the trend and are subdivided into three smaller waves. The three waves of a corrective wave cycle are:
•A. Wave A: The first wave of a corrective wave cycle is often referred to as the "A wave." This wave is characterized by a downward move against the trend and represents the start of a correction.
•B. Wave B: The second wave of a corrective wave cycle is the "B wave." This wave is characterized by an upward move against the trend, and it represents the counter-trend rally.
•C. Wave C: The final wave of a corrective wave cycle is the "C wave." This wave is characterized by a downward move in the direction of the trend, and it represents the completion of the correction.
In summary, the Elliott Wave Theory divides financial market movements into two categories: motive waves, which move in the direction of the trend, and corrective waves, which move against the trend. Understanding the cycle of each wave is important for making informed decisions about buying and selling in financial markets.
════════════════════════
🎯 CONCEPTS (Disclaimer)
Elliott Wave Count
The HAP WAVES indicator is designed for experienced traders who are familiar with advanced trading techniques. This tool is intended for day traders and long-term investors who have a solid understanding of the market and are looking to improve their trading strategy. The indicator was created by a well-known market analyst and is based on the principles and techniques documented in several books, including those by `Jason Perl`.
It is recommended that users of the HAP WAVES indicator have a good understanding of the concepts and techniques discussed in the books that cover this indicator. Before using the tool, it is important to have a good understanding of the underlying principles and techniques in order to make the most of the indicator and potentially improve your trading performance.
════════════════════════
🎯 Rules and Principles of this Indicator
* This description only addresses bullish (uptrend) markets, while bearish (downtrend) gives let you look a vice versa.
• ▶ HAP WAVES Requirements for Wave 1
The Wave 1 HAP WAVES requirements for a bullish (rising) market require that the market has closed a minimum of 21 bars below all 20 previous closes, then closes a maximum of 13 bars above all 12 previous closes, and finally reaches an 8 bar close below all 7 previous closes, to confirm that Wave 2 has formed.
• ▶ HAP WAVES Requirements for Wave 2
The first requirement for Wave 2 is the last requirement for Wave 1, which is a close of at least 8 bars with a close less than the previous 7 bars. Wave 2 continues until the market records a 21-bar close above all 20 previous closes, indicating the start of Wave 3.
• ▶ HAP WAVES Requirements for Wave 3
Wave 3 is confirmed after Wave 2 closes at 21 bars high, and it continues until there is a 13 bar close, indicating the end of Wave 3 and the start of Wave 4.
• ▶ HAP WAVES Requirements for Wave 4
The first requirement for Wave 4 is that there is a close at 13 bars after the end of Wave 3. Wave 4 is complete when the market records a 34 bar close (above all previous 33 closes), indicating the start of Wave 5.
• ▶ HAP WAVES Requirements for Wave 5
The first requirement for Wave 5 is a 34 bar close, signaling the end of Wave 4. The wave is considered complete when a 13 bar close is published, resulting in Wave A.
• ▶ HAP WAVES Requirements for Wave A
The HAP WAVES Requirements for Wave A state that the first call for Wave A is a 13 bar close (close below all previous 12 closes), signaling the end of Wave 5. Wave A is considered complete with an 8 bar high close (close above previous 7 closes), leading to the start of Wave B.
• ▶ HAP WAVES Requirements for Wave B
The first requirement for Wave B is a 8 bar high close (close above the previous 7 closes) after Wave A. Wave B is complete when there is a 21 bar low close (close below all 20 previous closes).
• ▶ HAP WAVES Requirements for Wave C
Wave C starts with a close of 21 bars low for Wave C, meaning the market close is below all 20 previous closes. Wave C is considered closed when the market closes below the close low of Wave A.
* Additional rules to apply the HAP WAVES indicator to the bullish trend
• The peak of Wave 3 must be higher than the close of Wave 1, and the peak of Wave 5 must be higher than the peak of Wave 3.
• If the pullback from Wave 1 is shallow, and the market later retraces above the high close of Wave 1, Wave 1 will slide to the right to align with the new high close.
• If the pullback from Wave 3 is shallow, and the market later retraces above the high close of Wave 3, Wave 3 will slide to the right to align with the new high close.
• Wave 5 will only be confirmed if Wave C crosses the low close of Wave A. If Wave B closes above the high close of Wave 5, Waves A, B and C will be erased and Wave 5 will slide to the right.
• If Wave 2 closes below the low close of Wave 1, the countdown will start over, and if Wave 4 closes below the low close of Wave 2, Wave 2 will move to the location of Wave 4.
• After Wave C crosses the low close of Wave A, Wave 5 will be locked in and cannot move. If the market later retraces above the high close of Wave 5, it will be marked as a new advance in Wave 1 rather than a blur of the previous Wave 5.
════════════════════════

Elliott Wave [LuxAlgo]The Elliott Wave indicator allows users to detect Elliott Wave (EW) impulses as well as corrective segments automatically on the chart. These are detected and displayed serially, allowing users to keep track of the evolution of an impulse or corrective wave.
Fibonacci retracements constructed from detected impulse waves are also included.
This script additionally allows users to get alerted on a wide variety of trigger conditions (see the ALERTS section below).
🔶 SETTINGS
🔹 Source
• "high" -> options high, close, maximum of open/close
• "low" -> options low, close, minimum of open/close
🔹 ZigZag
• The source and length are used to check whether a new Pivot Point is found.
Example:
• source = high/low, length = 10:
• There is a new pivot high when:
- previous high is higher than current high
- the highs of 10 bars prior to previous high are all lower
• These pivot points are used to form the ZigZag lines, which in their turn are used for pattern recognition
🔶 USAGE
The basic principles we use to identify Elliott Wave impulses are:
• A movement in the direction of the trend ( Motive/Impulse wave ) is divided in 5 waves (Wave 1 -> 5)
• The Corrective Wave (against the trend) is divided in 3 waves (Wave A -> C)
• The waves can be subdivided in smaller waves
• Wave 2 can’t retrace more than the beginning of Wave 1
• Wave 4 does not overlap with the price territory of Wave 1
Here we see an example:
Let's look at the development:
• 1 bar after point (5) a confirmed 5 Motive Wave pattern is found (1 -> 5; The 5 Waves can also be seen as one large Wave 1 ).
• Next, the script draws a set of Fibonacci lines, which are area's where the Corrective Wave potentially will bounce.
Here we see the fifth wave is getting larger, the previous highest point is updated, and the Wave 5 is larger than Wave 3 :
(At this point, the pattern is invalidated, and it display as dotted)
Further progression in time:
At this point, a confirmed " 3 Corrective Wave pattern " is found (a -> c)
When a new high has developed, a circle is drawn (in the same color of the lines)
However, when the bottom of the drawn box has breached, a red cross will be visualized.
Further progression:
Later on, a bearish confirmed " 5 Motive Wave pattern " is found (1 -> 5):
When a Corrective Wave becomes invalidated, the ABC pattern will display as dashed (not dotted):
🔶 TECHNIQUES
Pine Script™ introduces methods!
• More information can be found here:
• Pine Script™ v5 User Manual 👉 Methods
• Pine Script™ language reference manual 👉 method
🔶 ALERTS
Dynamic alerts are included in the script, you only need to set 1 alert to receive following messages:
• When a new EW Motive Pattern is found (Bullish/Bearish )
• When a new EW Corrective Pattern is found (Bullish/Bearish )
• When an EW Motive Pattern is invalidated (Bullish/Bearish )
• When an EW Corrective Pattern is invalidated (Bullish/Bearish )
• When possible, a start of a new EW Motive Wave is found (Bullish/Bearish )
• Here is information how you can set these alerts()

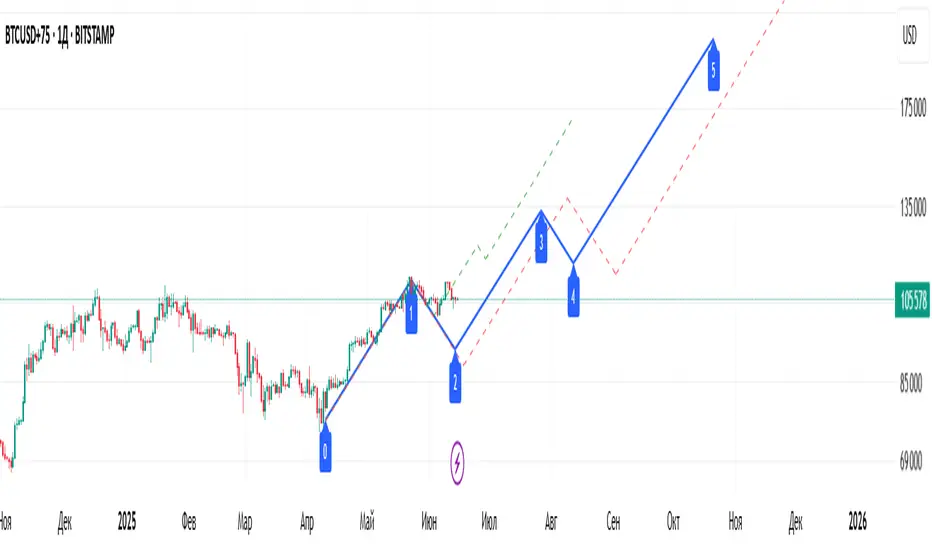
Elliott Wave [BigBeluga]🔵 OVERVIEW
Elliott Wave automatically finds and draws an Elliott-style 5-wave impulse and a dashed projection for a potential -(a)→(b)→(c) correction. It detects six sequential reversal points from rolling highs/lows — 1, 2, 3, 4, 5, (a) — validates their relative placement, and then renders the wave with labels and horizontal reference lines. If price invalidates the structure by closing back through the Wave-5 level inside a 100-bar window, the pattern is cleared (optionally kept as “broken”) while key dotted levels remain for context.
🔵 CONCEPTS
Reversal harvesting from extremes : The script scans highest/lowest values over a user-set Length and stores swing points with their bar indices.
Six-point validation : A pattern requires six pivots (1…5 and (a)). Their vertical/temporal order must satisfy Elliott-style constraints before drawing.
Impulse + projection : After confirming 1→5, the tool plots a curved polyline through the pivots and a dashed forward path from (a) toward (b) (midpoint of 5 and (a)) and back to (c).
Risk line (invalidator) : The Wave-5 price is tracked; a close back through it within 100 bars marks the structure as broken.
Minimal persistence : When broken, the wave drawing is removed to avoid noise, while dotted horizontals for waves 5 and 4 remain as reference.
🔵 FEATURES
Automatic pivot collection from rolling highs/lows (user-controlled Length ).
Wave labeling : Points 1–5 are printed; the last collected swing is marked b
. Projected i
& i
are shown with a dashed polyline.
Breaker line & cleanup : If price closes above Wave-5 (opposite for bears) within 100 bars, the pattern is removed; only dotted levels of 5 and 4 stay.
Styling controls :
Length (pivot sensitivity)
Text Size for labels (tiny/small/normal/large)
Wave color input
Show Broken toggle to keep invalidated patterns visible
Lightweight memory : Keeps a compact buffer of recent pivots/draws to stay responsive.
🔵 HOW TO USE
Set sensitivity : Increase Length on noisy charts for cleaner pivots; decrease to catch earlier/shorter structures.
Wait for confirmation : Once 1→5 is printed and (a) appears, use the Wave-5 line as your invalidation. A close back through it within ~100 bars removes the active wave (unless Show Broken is on).
Plan with the dashed path : The (a)→(b)→(c) projection offers a scenario for potential corrective movement and risk placement.
Work MTF : Identify cleaner waves on higher TFs; refine execution on lower TFs near the breaker or during the move toward (b).
Seek confluence : Align with structure (S/R), volume/Delta, or your trend filter to avoid counter-context trades.
🔵 CONCLUSION
Elliott Wave systematizes discretionary wave analysis: it detects and labels the 5-wave impulse, projects a plausible (a)-(b)-(c) path, and self-cleans on invalidation. With clear labels, dotted reference levels, and a practical breaker rule, it gives traders an objective framework for scenario planning, invalidation, and timing.

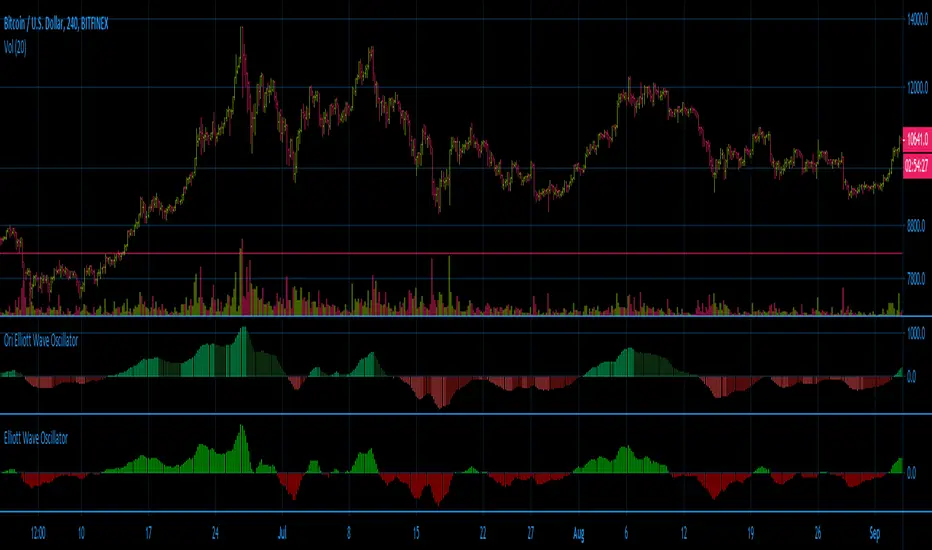
Elliott Wave Oscillator Signals by DGTElliott Wave Principle , developed by Ralph Nelson Elliott, proposes that the seemingly chaotic behaviour of the different financial markets isn’t actually chaotic. In fact the markets moves in predictable, repetitive cycles or waves and can be measured and forecast using Fibonacci numbers. These waves are a result of influence on investors from outside sources primarily the current psychology of the masses at that given time. Elliott wave predicts that the prices of the a traded currency pair will evolve in waves: five impulsive waves and three corrective waves. Impulsive waves give the main direction of the market expansion and the corrective waves are in the opposite direction (corrective wave occurrences and combination corrective wave occurrences are much higher comparing to impulsive waves)
The Elliott Wave Oscillator (EWO) helps identifying where you are in the 5-3 Elliott Waves, mainly the highest/lowest values of the oscillator might indicate a potential bullish/bearish Wave 3. Mathematically expressed, EWO is the difference between a 5-period and 35-period moving average based on the close. In this study instead 35-period, Fibonacci number 34 is implemented for the slow moving average and formula becomes ewo = ema(source, 5) - ema(source, 34)
The application of the Elliott Wave theory in real time trading gets difficult because the charts look messy. This study (EWO-S) simplifies the visualization of EWO and plots labels on probable reversals/corrections. The good part is that all plotting’s are performed on the top of the price chart including a histogram (optional and supported on higher timeframes). Additionally optional Keltner Channels Cloud added to help confirming the price actions.
What to look for:
Plotted labels can be used to follow the Elliott Wave occurrences and most importantly they can be considered as signals for possible trade setup opportunities. Elliott Wave Rules and Fibonacci Retracement/Extensions are suggested to confirm the patters provided by the EWO-S
Trading success is all about following your trading strategy and the indicators should fit within your trading strategy, and not to be traded upon solely
Disclaimer : The script is for informational and educational purposes only. Use of the script does not constitutes professional and/or financial advice. You alone the sole responsibility of evaluating the script output and risks associated with the use of the script. In exchange for using the script, you agree not to hold dgtrd TradingView user liable for any possible claim for damages arising from any decision you make based on use of the script

Elliott Wave - AutoCounting [NXT2017] draws the Wave 3 and 5HI BIG PLAYERS,
here's another indicator that I use pretty often.
The waves of Elliott Wave theory are automatically detected and displayed.
It makes it possible to count the Elliott waves almost always correctly and plausibly. However, the tool can only detect wave 3 as well as waves 5, A, B and C. The rest you have to draw yourself.
Sometimes the waves 3 and 5/A/B/C overlap - so I only use the view with wave 3 myself.
Kind regards
NXT2017

Elliott Wave with Customizable Visualization and Toggle1. Key User Inputs
a. Setting Wave 1 Start and High Points
- Wave 1 Start (Low Point): Enter the starting point (low point) of the first wave.
- Default: 10000.
- Wave 1 High (Previous High): Enter the high point (end point) of the first wave.
- Default: 11000.
b. Setting Targets and Retracement Ratios for Each Wave
- Wave 1 Target: Select the target ratio for Wave 1.
- Options: 1.0, 1.272, 1.414, 1.618, 2.0.
- Default: 1.618.
- Wave 2 Retrace: Select the retracement ratio for Wave 2.
- Options: 0.236, 0.382, 0.5, 0.618, 0.786.
- Default: 0.618.
- Wave 3 Target: Select the target ratio for Wave 3.
- Options: 1.0, 1.272, 1.414, 1.618, 2.0.
- Default: 1.618.
- Wave 4 Retrace: Select the retracement ratio for Wave 4.
- Options: 0.236, 0.382, 0.5, 0.618.
- Default: 0.382.
- Wave 5 Target: Select the target ratio for Wave 5.
- Options: 0.618, 1.0, 1.272, 1.414, 1.618.
- Default: 1.0.
c. Setting Colors and Styles for Each Wave
You can customize the color and line style of each wave:
- Wave 1 Color: Color of Wave 1 (Default: Green).
- Wave 2 Color: Color of Wave 2 (Default: Red).
- Wave 3 Color: Color of Wave 3 (Default: Blue).
- Wave 4 Color: Color of Wave 4 (Default: Purple).
- Wave 5 Color: Color of Wave 5 (Default: Orange).
- Wave 1 Line Style: Select the line style for Wave 1 (Options: Solid, Dotted, Dashed).
- Default: Solid.
- The same settings can be applied to the remaining waves.
d. Setting Wave Display Options
- You can toggle the visibility of specific waves:
- Example: Set Show Wave 1 to false to hide Wave 1 from the chart.
- Default: true (All waves are displayed).
2. Outputs and Visualization
Wave Target Lines
- The target price and retracement levels for each wave are displayed as horizontal lines on the chart.
- Selected ratios (Fibonacci ratios) are highlighted based on the user-defined style.
Labels
- Labels next to the target lines display the target price and Fibonacci ratio.
- Example: Wave 1 (1.618): 11236.54.
3. Key Calculations and Wave Explanations
a. Wave 1
- Length: Wave 1 High - Wave 1 Start.
- Target: The target price is calculated based on the selected ratio (Wave 1 Target).
- Display: The target line and label are displayed starting from Wave 1 Start.
b. Wave 2
- Retracement Length: Wave 1 Target - Wave 1 Start.
- Retracement Target: The retracement price is calculated based on the selected ratio (Wave 2 Retrace).
- Display: The retracement line and label are displayed starting from Wave 1 Target.
c. Wave 3
- Length: Same as the length of Wave 1.
- Target: The target price is calculated based on the selected ratio (Wave 3 Target).
- Display: The target line and label are displayed starting from Wave 1 Target.
d. Wave 4
- Retracement Length: Wave 3 Target - Wave 1 Target.
- Retracement Target: The retracement price is calculated based on the selected ratio (Wave 4 Retrace).
- Display: The retracement line and label are displayed starting from Wave 3 Target.
e. Wave 5
- Length: Same as the length of Wave 3.
- Target: The target price is calculated based on the selected ratio (Wave 5 Target).
- Display: The target line and label are displayed starting from Wave 3 Target.
4. Usage Examples
Trend Analysis
- Visualize the target price and retracement levels of each wave to understand upward or downward trends.
Determining Entry/Exit Points
- Plan entry and exit strategies by observing when target prices reach specific Fibonacci ratios.
Customization
- Enhance visual convenience by adjusting chart styles and colors to suit your preferences.
5. Notes and Precautions
Input Validation
- Ensure that the Wave 1 Start and Wave 1 High values match actual price ranges to achieve accurate results.
Market Conditions
- Elliott Wave Theory is a predictive tool and may differ from actual market movements.
Risk Management
- Use the results as a reference and always incorporate risk management strategies when making investment decisions.

Any Problems with ELLIOTT WAVES? Here my secret to count the EW!Hi at all!
Have someone any problems to count the Elliott Waves correctly? Then use my modified indicator.
The indicator shows a fast and a slow RSI oscillator.
I use this indicator to find the 3. wave on any big wave -> so I can find always trend wave und can indicate with that than the correction wave.
I set an example on the chart, so you can look at the peaks the RSI oscillator shows. The highest peak show the 3. wave of Elliott Waves. If you know the 3. wave you can immediately see the wave 1, 2 and of course 4 and 5.
For better instruction this indicator get green and red, if the fast RSI is higher or lower than the slow RSI. This color changing helps also to see every spectrum of a wave.

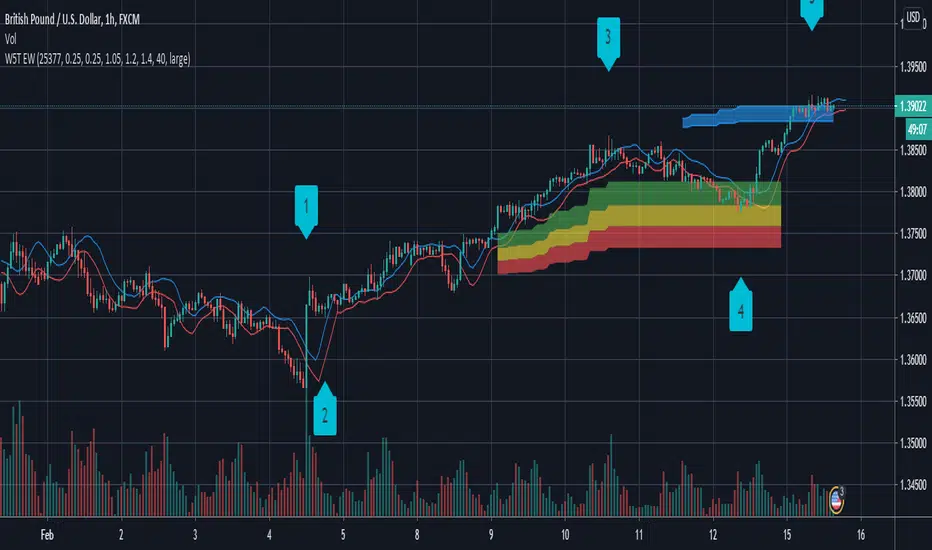
W5T Elliott Wave Indicator SuiteThe Elliott Wave Indicator Suite brings order and reason to the world of Swing Trading, Intraday Trading and Day Trading. It greatly illuminates the path through the forest of chaotic markets versus getting lost among all the trees. Perfect for Stocks, Forex, Futures, Commodities, Indexes and even Crypto Currency markets. Watch the Video Tour and find out More >>>HERE<<<
Includes:
Elliott Wave Indicator
High Probability Pull Back Zones
Elliott Wave isolation
Automated Target Zones
False Breakout Stochastic
Automated Elliott Wave Count
Special 5/35 Pull Back Oscillator
6/4 MA High & Low for Trade Entry & Management
Training Bootcamp
Free Monthly Live Support Webinars
TopTenAlgo 8. Elliottwave Cycle EN: The Elliottwaves Cycle Oscillator is an indicator that allows the detection of impulsive (impulsive / ascend) or corrective (correction / fall) waves, ie each cycle (cycle) in Elliott Waves . The aim is to measure the speed of a real trend and to predict returns. In the uptrend or impulsive movement, Cycle continues its movement in the upper band after the price is set on a certain band, while in the downtrend or corrective move, the Cycle continues its movement in the lower band.
This algorithm is prepared with @Top10Algo ...
TR: Elliottwaves Cycle Osilatörü Elliott Dalgalarında ki impulsive (itkisel/yükseliş) yada corrective (düzeltme/düşüş) dalgaların yani her bir siklus’ un (cycle) önceden tespit edilmesini sağlayan bir göstergedir. Amaç gerçek bir trendin hızını ölçmek ve geri dönüşleri önceden tespit etmektir. Yükseliş trendi içinde yada impulsive bir harekette fiyat belli bir banda oturduktan sonra Cycle üst band’ da hareketine devam ederken, düşüş trendi içinde yada corrective bir harekette fiyat belli bir banda oturduktan sonra Cycle alt bandda hareketine devam eder.
Bu algoritma @Top10Algo ile beraber hazırlanmıştır...

[blackcat] L1 Elliott Wave3 CatcherLevel: 1
Background
Elliott wave theory is a method of technical analysis that looks for recurring long-term price patterns that are related to persistent changes in investor sentiment and psychology. The theory identifies waves that are identified as impulse waves that form a pattern and corrective waves that counteract the larger trend.
Function
L1 Elliott Wave3 Catcher is trying to observe Elliott wave more clear with different color candles.
Key Signal
var7 --> bull reveral signal which exists along motive wave
var7-var9 --> long in green color; short in red color; retracement in fuchsia color
var26/27/28 --> they are used for wave swing low detection and long entry
Pros and Cons
Pros:
1. Exhibit Elliott waves in different color candles
2. Highlight motive wave with yellow candles
3. Detect bottom and long entry points
Cons:
1. No complete long and short entries can be obtained
2. It cannot be applied for crypto due to lack of financial() functions
Remarks
Tribute to Elliott
Readme
In real life, I am a prolific inventor. I have successfully applied for more than 60 international and regional patents in the past 12 years. But in the past two years or so, I have tried to transfer my creativity to the development of trading strategies. Tradingview is the ideal platform for me. I am selecting and contributing some of the hundreds of scripts to publish in Tradingview community. Welcome everyone to interact with me to discuss these interesting pine scripts.
The scripts posted are categorized into 5 levels according to my efforts or manhours put into these works.
Level 1 : interesting script snippets or distinctive improvement from classic indicators or strategy. Level 1 scripts can usually appear in more complex indicators as a function module or element.
Level 2 : composite indicator/strategy. By selecting or combining several independent or dependent functions or sub indicators in proper way, the composite script exhibits a resonance phenomenon which can filter out noise or fake trading signal to enhance trading confidence level.
Level 3 : comprehensive indicator/strategy. They are simple trading systems based on my strategies. They are commonly containing several or all of entry signal, close signal, stop loss, take profit, re-entry, risk management, and position sizing techniques. Even some interesting fundamental and mass psychological aspects are incorporated.
Level 4 : script snippets or functions that do not disclose source code. Interesting element that can reveal market laws and work as raw material for indicators and strategies. If you find Level 1~2 scripts are helpful, Level 4 is a private version that took me far more efforts to develop.
Level 5 : indicator/strategy that do not disclose source code. private version of Level 3 script with my accumulated script processing skills or a large number of custom functions. I had a private function library built in past two years. Level 5 scripts use many of them to achieve private trading strategy.

W5T Bar number for Elliott Wave IsolationSpecial Bar counting tool to allow Isolation of Elliott Wave wave count. Watch the Video Tour >>HERE<<< of this full and comprehensive Elliott Wave Indicator Suite.

W5T Elliott Wave OscillatorSpecial Elliott Wave Oscillator which is part of the W5T Elliott Wave Indicator suite. Watch the quick Video tour >>>HERE<<< and find out about this incredible and complete Elliott Wave Indicator Suite

Elliott Wave — HYBRID BEAST MODE⭐ Elliott Wave — HYBRID BEAST MODE
Description (Copy/Paste for Publishing)
Elliott Wave — HYBRID BEAST MODE is an advanced, automated Elliott Wave detection engine that blends classical wave theory with modern algorithmic logic. This tool identifies impulsive waves, corrective structures, wave-strength conditions, and volume-enhanced Wave 3 confirmations — all while automatically adapting to any timeframe.
This script uses a hybrid approach:
• Elliott Oscillator (5/35 MA difference)
• Pivot-based wave structure detection
• Automated wave spacing (dynamic by timeframe)
• Fibonacci projection mapping
• Wave channels & structure geometry
• Dashboard for quick-read market conditions
• Automatic alerts for Wave 3, Wave 5, and corrective waves
Key Features
✔ Auto Wave Detection using pivot geometry and spacing logic
✔ Elliott Oscillator histogram for momentum confirmation
✔ Wave Labels (1–5, A–B–C) with intelligent spacing
✔ Adaptive Timeframe System that recalculates wave spacing automatically
✔ Wave 3 Strength Logic using your custom volume multiplier
✔ Fibonacci Levels for projection and confirmation
✔ Wave Channels for structure alignment
✔ Built-In Alerts for key high-probability moments
✔ Designed for 4H / Daily, but optimized for all timeframes
Use Cases
• Identifying impulsive wave cycles
• Confirming corrections & retracements
• Determining trend exhaustion
• Timing Wave 3 and Wave 5 extensions
• Integrating wave theory with oscillator momentum
This is a full Elliott Wave toolbox packed into one script — ideal for traders who want automatic structure detection without the subjectivity of manual wave counting.
Elliott Wave + SMC Fusion # Elliott Wave + SMC Fusion
## TITLE:
Elliott Wave + Smart Money Concepts Fusion
---
## SHORT DESCRIPTION:
Automated Elliott Wave pattern detection with Smart Money Concepts confirmation, EWO oscillator integration, and confluence scoring system.
---
## FULL DESCRIPTION:
### 📊 OVERVIEW
This indicator combines three powerful trading methodologies into a unified system:
- **Elliott Wave Theory** - Automated detection of Wave 1-2 impulse patterns
- **Smart Money Concepts (SMC)** - Order Blocks and Fair Value Gaps for institutional confirmation
- **Elliott Wave Oscillator (EWO)** - Momentum-based signal validation
The core concept is to identify high-probability Wave 3 entries by detecting completed Wave 1-2 structures and validating them with SMC and momentum indicators.
---
### 🔧 HOW IT WORKS
**1. Pattern Detection (ZigZag Method)**
- Uses pivot high/low detection to identify swing points
- Validates Wave 2 retracement using Fibonacci ratios (default: 38.2% - 88.6%)
- Requires minimum wave size to filter noise
- Applies confirmation bars to avoid premature signals
**2. Wave Projections**
- Wave 3 target: Fibonacci extension of Wave 1 (default: 1.618)
- Wave 4 retracement: Percentage of Wave 3 (default: 38.2%)
- Wave 5 projection: Extension of Wave 1 from Wave 4
**3. Smart Money Validation**
- **Order Blocks**: Identifies last opposing candle before breakout (institutional footprint)
- **Fair Value Gaps**: Detects price imbalances for potential support/resistance
**4. EWO Confirmation**
- Calculates momentum: (EMA5 / EMA34 - 1) × 100
- Signal line crossovers confirm trend direction
- Strong signals occur at extremes (< -13 or > 13 threshold)
**5. Confluence Scoring (0-100%)**
Points awarded for:
- Fibonacci quality of Wave 2 retracement (10-30 pts)
- Order Block presence (15 pts)
- Fair Value Gap presence (10 pts)
- Volume confirmation (10-15 pts)
- Trend alignment with EMA50 (10 pts)
- EWO confirmation (10-20 pts)
---
### 🎯 UNIQUE FEATURES
**Pattern Locking System**
- Once a valid pattern is detected, it locks until:
- Pattern invalidates (price breaks Wave 0)
- Pattern completes (Wave 5 reached)
- Auto-timeout (configurable bars)
- Prevents rapid signal flipping and false alerts
**Signal Stability Controls**
- Adjustable cooldown between signals (default: 20 bars)
- Minimum bar distance between wave points
- Direction change requirement option
- Confirmation bars after Wave 2 formation
**Visual Wave Tracking**
- Solid lines for impulse waves (0→1, 2→3, 4→5)
- Dashed lines for corrective waves (1→2, 3→4)
- Numbered labels on each wave point
- Real-time projection lines to targets
**Comprehensive Dashboard**
- Current wave status and lock state
- Pattern grade (A+ to D based on confluence)
- Projected vs actual wave levels (✓ when completed)
- SMC confirmation status
- Risk/Reward ratio calculation
- EWO trend direction
---
### 📈 TRADING APPLICATION
**Entry Strategy**
- Wait for Wave 1-2 pattern detection (diamond signal)
- Check confluence score (>65% = higher probability)
- Verify EWO alignment with pattern direction
- Enter after 30% retracement of Wave 2 (customizable)
**Risk Management**
- Stop Loss: Below Wave 0 (with buffer)
- Take Profit 1: Wave 3 projection
- Take Profit 2: Wave 5 projection
- R:R displayed in dashboard
**Invalidation Rules**
- Price breaks below Wave 0 (bullish) or above (bearish)
- Wave 2 level violated before Wave 3 forms
- Pattern timeout exceeded
---
### ⚙️ KEY SETTINGS
**Elliott Wave**
- ZigZag Length: Pivot detection sensitivity
- Fib Tolerance: Acceptable retracement range
- Min Wave Size: Filter small movements
**Signal Stability**
- Signal Cooldown: Minimum bars between signals
- Lock Pattern Until Invalid: Prevent signal changes
- Confirmation Bars: Wait after Wave 2
**Wave Projection**
- Wave 3/4/5 Fibonacci extensions
- Projection display distance
**EWO Settings**
- Fast/Slow EMA lengths
- Signal smoothing
- Strength threshold
**SMC Settings**
- Order Block lookback period
- FVG minimum size percentage
---
### 🔔 ALERTS
- New bullish/bearish pattern detected
- High confluence setup (>75%)
- Pattern invalidation
- Wave completion
---
### ⚠️ IMPORTANT NOTES
- This indicator identifies **potential** Elliott Wave patterns based on mathematical rules
- Elliott Wave analysis is subjective - patterns may be interpreted differently
- Always combine with other analysis methods and proper risk management
- Past pattern performance does not guarantee future results
- Pattern locking prevents repainting but delays new pattern detection
- Best used on higher timeframes (1H+) for cleaner wave structures
---
### 📚 METHODOLOGY REFERENCES
**Elliott Wave Theory**
- Wave 2 typically retraces 38.2% - 88.6% of Wave 1
- Wave 3 is often the strongest, extending 161.8% of Wave 1
- Wave 4 usually retraces 38.2% of Wave 3
- Wave 5 completes the impulse structure
**Smart Money Concepts**
- Order Blocks represent institutional supply/demand zones
- FVGs indicate price inefficiencies that may act as magnets
**Elliott Wave Oscillator**
- Developed to identify wave momentum
- Crossovers signal potential wave transitions
- Extreme readings often coincide with wave completions
---
### 🎨 VISUAL ELEMENTS
- **Green**: Bullish patterns and projections
- **Red**: Bearish patterns and projections
- **Orange**: Wave projection levels
- **Purple**: Order Block zones
- **Yellow**: Fair Value Gaps
- **Blue**: Entry levels
- **Diamond shapes**: New pattern signals
- **Triangle shapes**: EWO crossover signals
---
### 💡 TIPS FOR BEST RESULTS
1. Use on liquid markets with clear trend behavior
2. Higher timeframes produce more reliable patterns
3. Look for confluence scores above 65%
4. Verify EWO alignment before entry
5. Consider market context (overall trend, key levels)
6. Adjust ZigZag length based on your trading style
7. Increase cooldown period for longer-term signals
---
**Indicator Type**: Overlay
**Markets**: All (Crypto, Forex, Stocks, Commodities)
**Timeframes**: All (1H+ recommended)
**Style**: Pattern Recognition + Momentum + Price Action

Elliott Wave Expert AdvisorElliott Wave Expert Advisor - Professional Wave Analysis Tool
OVERVIEW
--------
The Elliott Wave Expert Advisor is a comprehensive Pine Script indicator designed for TradingView that automates Elliott Wave analysis and generates high-probability trading signals. Built on Ralph Nelson Elliott's Wave Principle, this indicator identifies impulse wave patterns, validates them against strict Elliott Wave rules, and provides precise entry points with calculated risk management levels.
CORE FUNCTIONALITY
------------------
1. TREND DETECTION
- Dual Moving Average system (Fast/Slow MA)
- MACD confirmation for trend strength
- Automatic trend classification (Uptrend/Downtrend/Sideways)
- Only generates signals aligned with main trend
2. SWING POINT DETECTION
- Automatic pivot high/low identification
- Configurable sensitivity (lookback periods)
- Minimum swing size filtering to reduce noise
- ZigZag visualization connecting swing points
3. WAVE IDENTIFICATION
- 5-wave impulse pattern recognition (1-2-3-4-5)
- 3-wave corrective pattern detection (A-B-C)
- Wave labels displayed on chart
- Color-coded validation status (Blue = Valid, Orange = Pending)
4. ELLIOTT WAVE RULES VALIDATION
Strictly enforces three cardinal rules:
- Rule 1: Wave 2 never retraces more than 100% of Wave 1
- Rule 2: Wave 3 is never the shortest impulse wave
- Rule 3: Wave 4 never overlaps Wave 1 price territory
5. FIBONACCI ANALYSIS
- Automatic Fibonacci retracement calculations (23.6%, 38.2%, 50%, 61.8%, 78.6%)
- Fibonacci extension projections (100%, 161.8%, 261.8%)
- Wave 3 and Wave 5 target projections
- Fibonacci-based Take Profit levels
6. SIGNAL GENERATION
- Entry signals at Wave 2 completion (catch Wave 3)
- Entry signals at Wave 4 completion (catch Wave 5)
- Automatic Stop Loss placement below/above pivot points
- Multiple Take Profit targets (TP1 at 1.618 extension, TP2 at Wave 5 projection)
- Risk/Reward ratio calculation and filtering
- Minimum R:R threshold (default 1.5:1)
7. VISUAL ELEMENTS
- Pivot markers (H/L) showing swing highs and lows
- ZigZag lines connecting swing points
- Wave number labels (1-2-3-4-5) with validation colors
- Entry signal arrows (Green = BUY, Red = SELL)
- Stop Loss lines (Red dashed)
- Take Profit lines (Green dashed and dotted)
- Real-time status dashboard showing:
* Number of pivots detected
* Wave count progress (X/5)
* Pattern validation status
* Market trend direction
* Signal active status
* Helpful tips and guidance
OPTIMAL USAGE
-------------
• Timeframes: H1, H4, D1 (avoid M1-M5 due to noise)
• Markets: Forex majors (EUR/USD, GBP/USD), Gold (XAU/USD), Major Cryptocurrencies
• Market Conditions: Strong trending markets (avoid ranging/sideways conditions)
• Risk Management: Never risk more than 1-2% per trade
• Position Sizing: Based on calculated Stop Loss distance
CONFIGURATION PARAMETERS
------------------------
Trend Detection:
- MA Fast Period (default: 20)
- MA Slow Period (default: 50)
- MACD settings (12/26/9)
Swing Detection:
- Pivot Lookback Left/Right (default: 10/10, reduce to 5/5 for M15)
- Min Swing Size % (default: 0.1%, reduce to 0.05% for M15)
Wave Detection:
- Min Wave Size % (default: 0.5%, reduce to 0.2-0.3% for smaller timeframes)
Risk Management:
- SL Buffer % (default: 0.1%)
- TP1 Fibonacci Ratio (default: 1.618)
- Min Risk/Reward (default: 1.5)
Visualization:
- Toggle visibility for MAs, ZigZag, Wave Labels, Signals, SL/TP
- Customizable colors for all elements
- Optional trend background coloring
IMPORTANT NOTES
---------------
• Elliott Wave analysis is subjective - this indicator implements one specific interpretation
• Works best in trending markets; automatically suppresses signals in sideways conditions
• Signals are NOT repainting after pivot confirmation
• Not a "holy grail" - combine with other analysis and proper risk management
• Requires patience - quality setups are infrequent but high-probability
• Always backtest on historical data before live trading
ELLIOTT WAVE THEORY BACKGROUND
------------------------------
Elliott Wave Theory, developed by Ralph Nelson Elliott in the 1930s, proposes that market prices move in predictable wave patterns driven by investor psychology. An impulse wave consists of five sub-waves (three in the trend direction, two corrections), followed by a three-wave correction. This indicator automates the identification of these patterns and validates them against Elliott's original rules.
DISCLAIMER
----------
This indicator is for educational and informational purposes only. Past performance does not guarantee future results. Always conduct your own analysis and never trade with money you cannot afford to lose. The indicator provides signals based on technical analysis patterns and does not constitute financial advice.
VERSION
-------
v1.0 - Initial Release
Pine Script v5
Created: 2024
SUPPORT
-------
For detailed usage instructions, refer to the included documentation:
- usage_guide.md - Complete user manual with examples
- elliott_rules.md - Elliott Wave theory reference and implementation details

Elliott Wave Universal PRO [Full Ratios]Elliott Wave Universal PRO
Overview
This advanced Elliott Wave indicator helps traders identify and project potential wave structures with Fibonacci ratios. It supports both impulse and corrective patterns with multiple variations, providing visual projections for standard, minimal, and maximal wave extensions.
Key Features
✅ Multiple Wave Patterns
Impulse waves (Classic, Extended, Diagonal, Truncated, etc.)
Corrective waves (Zigzag, Flat, Triangle, Double/Triple Zigzag, etc.)
✅ Customizable Projections
Adjustable start/end points for wave labeling
Standard, minimal, and maximal Fibonacci-based projections
✅ Visual Customization
Color/style settings for different ratio types
Clean labeling for wave structure clarity
✅ Flexible Display
Toggle between impulse/correction modes
Enable/disable ratio projections as needed
How to Use
Set Points: Define the start (0) and first wave (A) using the input settings.
Select Pattern: Choose from impulse or correction templates.
Adjust Display: Customize colors, line styles, and ratio visibility.
⚠ Note: This tool is for educational purposes and should be used alongside other analysis methods. Past performance does not guarantee future results.
Elliott Wave Universal PRO
Обзор
Этот продвинутый индикатор волн Эллиотта помогает трейдерам определять и прогнозировать волновые структуры с использованием соотношений Фибоначчи. Поддерживает импульсные и коррекционные модели с различными вариациями, визуализируя стандартные, минимальные и максимальные проекции волн.
Основные функции
✅ Различные волновые модели
Импульсы (Классические, Удлиненные, Диагонали, Усеченные и др.)
Коррекции (Зигзаги, Плоскости, Треугольники, Двойные/Тройные зигзаги и др.)
✅ Настраиваемые проекции
Ручное задание точек начала (0) и первой волны (A)
Стандартные, минимальные и максимальные проекции на основе Фибоначчи
✅ Гибкость отображения
Настройка цветов и стилей линий
Четкие метки для удобного анализа структуры
✅ Управление отображением
Переключение между импульсами и коррекциями
Включение/отключение типов проекций
Как использовать
Установите точки: Задайте начало (0) и первую волну (A) во входных параметрах.
Выберите шаблон: Укажите тип структуры (импульс/коррекция).
Настройте отображение: Измените цвета, стили линий и видимость проекций.
⚠ Важно: Индикатор предназначен для образовательных целей. Используйте его в сочетании с другими методами анализа.
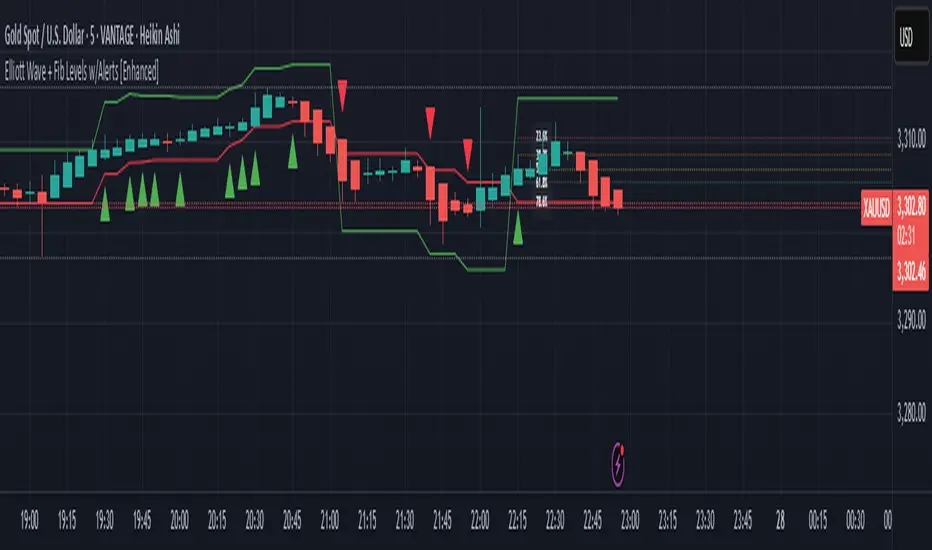
Elliott Wave + Fib Levels w/Alerts [Enhanced]Elliott Wave + Fibonacci Levels with Alerts
This powerful TradingView indicator combines Elliott Wave detection with customizable Fibonacci retracement levels to help identify key price zones and potential trade opportunities. It automatically detects bullish and bearish waves based on recent highs and lows, with an optional EMA filter to improve trend accuracy.
Key features include:
Dynamic detection of Elliott Waves based on configurable wave length.
Visualization of Fibonacci retracement levels on detected waves, with customizable percentage levels and optional labels for clarity.
ATR-based automatic calculation of stop loss and take profit levels with adjustable multipliers.
Real-time alerts triggered on new wave formations, indicating bullish or bearish setups with precise entry price details.
Clean plotting of entry signals, stop loss, and take profit zones directly on the chart.
User-friendly input controls to tailor the indicator to your trading style, including options to toggle EMA filtering, Fibonacci level display, and alert activation.
Ideal for traders looking to combine classic wave analysis with Fibonacci support/resistance levels and actionable trade alerts, this indicator streamlines technical analysis and trade management in one easy-to-use tool.