EMA StrategyThis is a simple EMA cross strategy. This script was published by CaptJava. I added in the ability to check off a box and allow shorting, the ability to select a back testing date range and also the ability to enter the buy message and sell message in the properties. You then create the webhook alert and put only this in the message:
{{strategy.order.alert_message}}
That will pull in your alert message dynamically.
I may add more features to this over time.
Cari dalam skrip untuk "ema strategy"

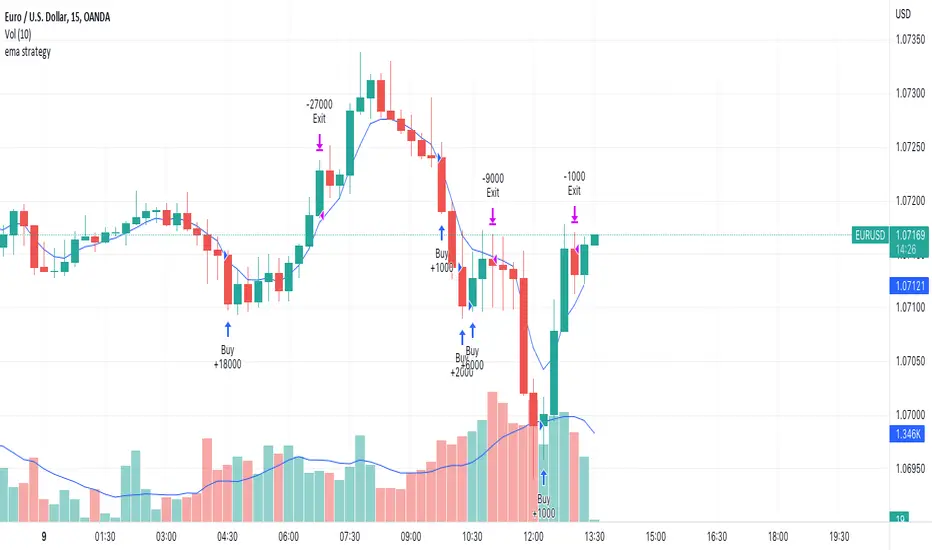
ema strategyEMA STRATEGY Scalping with staggered buy and profit Booking
try and like if you get profitable
three Supertrend EMA Strategy by Prasanna +DhanuThe indicator described in your Pine Script is a Supertrend EMA Strategy that combines the Supertrend and EMA (Exponential Moving Average) to create a trend-following strategy. Here’s a detailed breakdown of how this indicator works:
1. EMA (Exponential Moving Average):
The EMA is a moving average that places more weight on recent prices, making it more responsive to price changes compared to a simple moving average (SMA). In this strategy, the EMA is used to determine the overall trend direction.
Input Parameter:
ema_length: This is the period for the EMA, set to 50 periods by default. A shorter EMA will respond more quickly to price movements, while a longer EMA is smoother and less sensitive to short-term fluctuations.
How it's used:
If the price is above the EMA, it indicates an uptrend.
If the price is below the EMA, it indicates a downtrend.
2. Supertrend Indicator:
The Supertrend indicator is a trend-following tool based on the Average True Range (ATR), which is a volatility measure. It helps to identify the direction of the trend by setting a dynamic support or resistance level.
Input Parameters:
supertrend_atr_period: The period used for calculating the ATR, set to 10 periods by default.
supertrend_multiplier1: Multiplier for the first Supertrend, set to 3.0.
supertrend_multiplier2: Multiplier for the second Supertrend, set to 2.0.
supertrend_multiplier3: Multiplier for the third Supertrend, set to 1.0.
Each Supertrend line has a different multiplier, which affects its sensitivity to price changes. The ATR period defines how many periods of price data are used to calculate the ATR.
How the Supertrend works:
If the Supertrend value is below the price, the trend is considered bullish (uptrend).
If the Supertrend value is above the price, the trend is considered bearish (downtrend).
The Supertrend will switch between up and down based on price movement and ATR, providing a dynamic trend-following signal.
3. Three Supertrend Lines:
In this strategy, three Supertrend lines are calculated with different multipliers and the same ATR period (10 periods). Each line is more or less sensitive to price changes, and they are plotted on the chart in different colors based on whether the trend is bullish (green) or bearish (red).
Supertrend 1: The most sensitive Supertrend with a multiplier of 3.0.
Supertrend 2: A moderately sensitive Supertrend with a multiplier of 2.0.
Supertrend 3: The least sensitive Supertrend with a multiplier of 1.0.
Each Supertrend line signals a bullish trend when its value is below the price and a bearish trend when its value is above the price.
4. Strategy Rules:
This strategy uses the three Supertrend lines combined with the EMA to generate trade signals.
Entry Conditions:
A long entry is triggered when all three Supertrend lines are in an uptrend (i.e., all three Supertrend lines are below the price), and the price is above the EMA. This suggests a strong bullish market condition.
A short entry is triggered when all three Supertrend lines are in a downtrend (i.e., all three Supertrend lines are above the price), and the price is below the EMA. This suggests a strong bearish market condition.
Exit Conditions:
A long exit occurs when the third Supertrend (the least sensitive one) switches to a downtrend (i.e., the price falls below it).
A short exit occurs when the third Supertrend switches to an uptrend (i.e., the price rises above it).
5. Visualization:
The strategy also plots the following on the chart:
The EMA is plotted as a blue line, which helps identify the overall trend.
The three Supertrend lines are plotted with different colors:
Supertrend 1: Green (for uptrend) and Red (for downtrend).
Supertrend 2: Green (for uptrend) and Red (for downtrend).
Supertrend 3: Green (for uptrend) and Red (for downtrend).
Summary of the Strategy:
The strategy combines three Supertrend indicators (with different multipliers) and an EMA to capture both short-term and long-term trends.
Long positions are entered when all three Supertrend lines are bullish and the price is above the EMA.
Short positions are entered when all three Supertrend lines are bearish and the price is below the EMA.
Exits occur when the third Supertrend line (the least sensitive) signals a change in trend direction.
This combination of indicators allows for a robust trend-following strategy that adapts to both short-term volatility and long-term trend direction. The Supertrend lines provide quick reaction to price changes, while the EMA offers a smoother, more stable trend direction for confirmation.
The indicator described in your Pine Script is a Supertrend EMA Strategy that combines the Supertrend and EMA (Exponential Moving Average) to create a trend-following strategy. Here’s a detailed breakdown of how this indicator works:
1. EMA (Exponential Moving Average):
The EMA is a moving average that places more weight on recent prices, making it more responsive to price changes compared to a simple moving average (SMA). In this strategy, the EMA is used to determine the overall trend direction.
Input Parameter:
ema_length: This is the period for the EMA, set to 50 periods by default. A shorter EMA will respond more quickly to price movements, while a longer EMA is smoother and less sensitive to short-term fluctuations.
How it's used:
If the price is above the EMA, it indicates an uptrend.
If the price is below the EMA, it indicates a downtrend.
2. Supertrend Indicator:
The Supertrend indicator is a trend-following tool based on the Average True Range (ATR), which is a volatility measure. It helps to identify the direction of the trend by setting a dynamic support or resistance level.
Input Parameters:
supertrend_atr_period: The period used for calculating the ATR, set to 10 periods by default.
supertrend_multiplier1: Multiplier for the first Supertrend, set to 3.0.
supertrend_multiplier2: Multiplier for the second Supertrend, set to 2.0.
supertrend_multiplier3: Multiplier for the third Supertrend, set to 1.0.
Each Supertrend line has a different multiplier, which affects its sensitivity to price changes. The ATR period defines how many periods of price data are used to calculate the ATR.
How the Supertrend works:
If the Supertrend value is below the price, the trend is considered bullish (uptrend).
If the Supertrend value is above the price, the trend is considered bearish (downtrend).
The Supertrend will switch between up and down based on price movement and ATR, providing a dynamic trend-following signal.
3. Three Supertrend Lines:
In this strategy, three Supertrend lines are calculated with different multipliers and the same ATR period (10 periods). Each line is more or less sensitive to price changes, and they are plotted on the chart in different colors based on whether the trend is bullish (green) or bearish (red).
Supertrend 1: The most sensitive Supertrend with a multiplier of 3.0.
Supertrend 2: A moderately sensitive Supertrend with a multiplier of 2.0.
Supertrend 3: The least sensitive Supertrend with a multiplier of 1.0.
Each Supertrend line signals a bullish trend when its value is below the price and a bearish trend when its value is above the price.
4. Strategy Rules:
This strategy uses the three Supertrend lines combined with the EMA to generate trade signals.
Entry Conditions:
A long entry is triggered when all three Supertrend lines are in an uptrend (i.e., all three Supertrend lines are below the price), and the price is above the EMA. This suggests a strong bullish market condition.
A short entry is triggered when all three Supertrend lines are in a downtrend (i.e., all three Supertrend lines are above the price), and the price is below the EMA. This suggests a strong bearish market condition.
Exit Conditions:
A long exit occurs when the third Supertrend (the least sensitive one) switches to a downtrend (i.e., the price falls below it).
A short exit occurs when the third Supertrend switches to an uptrend (i.e., the price rises above it).
5. Visualization:
The strategy also plots the following on the chart:
The EMA is plotted as a blue line, which helps identify the overall trend.
The three Supertrend lines are plotted with different colors:
Supertrend 1: Green (for uptrend) and Red (for downtrend).
Supertrend 2: Green (for uptrend) and Red (for downtrend).
Supertrend 3: Green (for uptrend) and Red (for downtrend).
Summary of the Strategy:
The strategy combines three Supertrend indicators (with different multipliers) and an EMA to capture both short-term and long-term trends.
Long positions are entered when all three Supertrend lines are bullish and the price is above the EMA.
Short positions are entered when all three Supertrend lines are bearish and the price is below the EMA.
Exits occur when the third Supertrend line (the least sensitive) signals a change in trend direction.
This combination of indicators allows for a robust trend-following strategy that adapts to both short-term volatility and long-term trend direction. The Supertrend lines provide quick reaction to price changes, while the EMA offers a smoother, more stable trend direction for confirmation.

Commodity Channel Index CCI + EMA strategy
================================================================================
COMMODITY CHANNEL INDEX CCI + EMA STRATEGY - STRATEGY GUIDE 📊
================================================================================
💡 COLLABORATION & SUPPORT
---------------------------
If you want to collaborate, have an idea for a strategy, or need help writing
or customizing code, send an email to burdytrader@gmail.com or send me a
message. Suggestions, ideas, and comments are always welcome! 🤝
I also develop automated trading codes for other trading platforms including:
- CTrader (C#)
- MetaTrader 4 (MQL4)
- MetaTrader 5 (MQL5)
If you need a strategy converted or developed for any of these platforms, feel
free to contact me!
================================================================================
⚠️ IMPORTANT: INSTRUMENT SELECTION 📈
-------------------------------------
This strategy performs BEST with currency pairs (forex). The CCI indicator
works particularly well in the forex market due to the nature of currency
movements and the effectiveness of the CCI in identifying overbought and
oversold conditions in trending markets.
Why Currency Pairs? 🎯
- CCI is highly effective in identifying reversals in forex markets
- Currency pairs show clear overbought/oversold patterns
- EMA filter (50/200) aligns well with major forex trends
- High liquidity ensures reliable signal execution
Performance Highlights:
In specific currency pairs, when properly configured, this strategy can achieve:
- Profit Factor: Over 2.0
- Win Rate: Up to 70%
- Particularly effective pairs: USDCAD, EURUSD, GBPJPY
While the strategy can work with other instruments (stocks, indices, commodities),
currency pairs provide the most consistent and reliable results. For optimal
performance, focus on major forex pairs with good liquidity and clear trending
characteristics.
================================================================================
WHAT DOES THIS STRATEGY DO? 🎯
---------------------------
This strategy combines the Commodity Channel Index (CCI) with Exponential
Moving Averages (EMA) to identify high-probability trading opportunities.
The strategy uses CCI crossovers with a smoothing moving average and filters
signals using EMA trend confirmation. The strategy automatically enters trades
when CCI crosses the smoothing MA in specific zones, indicating potential trend
reversals or continuations.
HOW IT WORKS? ⚙️
---------------
1. CCI CALCULATION 📈
The strategy calculates the Commodity Channel Index using:
- CCI = (Price - SMA(Price, length)) / (0.015 × Deviation(Price, length))
- Default length: 20 periods
- Source: HLC3 (typical price)
The CCI shows:
- Values above +100 = Overbought conditions
- Values below -100 = Oversold conditions
- Values around 0 = Neutral conditions
2. SMOOTHING MOVING AVERAGE 📊
A moving average is applied to the CCI to smooth out fluctuations:
- Types available: SMA, EMA, SMMA (RMA), WMA, VWMA
- Default: SMA with length 14
- Can be disabled (set to "None")
This smoothed line acts as a reference for crossover signals.
3. EMA TREND FILTER 🎯
Two EMAs are calculated on the CCI:
- EMA 50 (fast EMA)
- EMA 200 (slow EMA)
When the EMA filter is enabled:
- LONG signals only occur when EMA50 > EMA200 (uptrend confirmation)
- SHORT signals only occur when EMA50 < EMA200 (downtrend confirmation)
This filter can be enabled/disabled via the "Use EMA Filter" option.
4. ENTRY CONDITIONS 🎲
LONG ENTRY (Buy Signal):
- CCI crosses ABOVE the Smoothing MA (crossover)
- CCI is between Lower Level (-100) and Middle Level (0)
- EMA Filter: EMA50 > EMA200 (if filter enabled)
- No existing positions (or close opposite positions first)
SHORT ENTRY (Sell Signal):
- CCI crosses BELOW the Smoothing MA (crossunder)
- CCI is between Middle Level (0) and Upper Level (+100)
- EMA Filter: EMA50 < EMA200 (if filter enabled)
- No existing positions (or close opposite positions first)
5. POSITION MANAGEMENT 💰
The strategy uses a simple position management approach:
- Only ONE position at a time (no pyramiding)
- If a signal occurs in the opposite direction, closes existing position first
- Then opens new position in the new direction
- This prevents overexposure and simplifies risk management
6. TAKE PROFIT & STOP LOSS SETTINGS 🎯
The strategy uses percentage-based TP/SL:
- Take Profit: 1.0% (default, configurable)
- Stop Loss: 0.5% (default, configurable)
- Risk/Reward Ratio: 2:1 (TP is double the SL)
TP/SL are calculated once when the position opens and remain fixed.
AVAILABLE PARAMETERS ⚙️
-----------------------
CCI SETTINGS:
1. CCI Length (Default: 20)
- Period for CCI calculation
- Lower values = More sensitive to recent price action
- Higher values = More smoothed, less sensitive
2. CCI Source (Default: HLC3)
- Price source for CCI calculation
- Options: close, open, high, low, hlc3, hlcc4, ohlc4
3. CCI Lower Level (Default: -100)
- Lower boundary for LONG entry zone
- Typically -100 for oversold conditions
4. CCI Middle Level (Default: 0)
- Neutral level separating LONG and SHORT zones
5. CCI Upper Level (Default: +100)
- Upper boundary for SHORT entry zone
- Typically +100 for overbought conditions
SMOOTHING MA:
6. Type (Default: SMA)
- Moving average type: None, SMA, EMA, SMMA (RMA), WMA, VWMA
- Set to "None" to disable smoothing
7. Length (Default: 14)
- Period for smoothing MA
- Range: 7-28, step 7
EMA FILTER:
8. EMA 1 Length (Default: 50)
- Fast EMA period applied to CCI
9. EMA 2 Length (Default: 200)
- Slow EMA period applied to CCI
10. Use EMA Filter (Default: true)
- Enable/disable EMA trend filter
- When enabled: LONG only if EMA50 > EMA200, SHORT only if EMA50 < EMA200
RISK MANAGEMENT:
11. Take Profit (%) (Default: 1.0%)
- Profit target as percentage of entry price
- For LONG: Entry × (1 + TP%)
- For SHORT: Entry × (1 - TP%)
12. Stop Loss (%) (Default: 0.5%)
- Stop loss as percentage of entry price
- For LONG: Entry × (1 - SL%)
- For SHORT: Entry × (1 + SL%)
VISUALIZATION 📊
---------------
The strategy displays in a separate panel below the price chart:
1. CCI LINE
- Blue line showing the CCI value
- Oscillates around zero
2. SMOOTHING MA LINE
- Yellow line showing the smoothed CCI
- Reference line for crossover signals
3. CCI LEVEL LINES
- Red dashed line: Upper Level (+100)
- Green dashed line: Lower Level (-100)
- Yellow dashed line: Middle Level (0)
4. ENTRY SIGNALS
- Green cross: LONG entry signal (when CCI crosses above MA)
- Red cross: SHORT entry signal (when CCI crosses below MA)
RECOMMENDED SETTINGS 🎯
-----------------------
To get started, you can use these settings:
CCI SETTINGS:
- CCI Length: 20 (default)
- CCI Source: HLC3 (default)
- CCI Lower Level: -100 (default)
- CCI Middle Level: 0 (default)
- CCI Upper Level: +100 (default)
SMOOTHING MA:
- Type: SMA (default) or EMA for faster response
- Length: 14 (default)
EMA FILTER:
- EMA 1 Length: 50 (default)
- EMA 2 Length: 200 (default)
- Use EMA Filter: true (recommended for better signal quality)
RISK MANAGEMENT:
- Take Profit (%): 1.0% (adjust based on your risk/reward preference)
- Stop Loss (%): 0.5% (adjust based on your risk tolerance)
For more aggressive trading:
- Reduce CCI Length to 14-16
- Reduce Smoothing MA Length to 7
- Disable EMA Filter
For more conservative trading:
- Increase CCI Length to 24-30
- Increase Smoothing MA Length to 21-28
- Keep EMA Filter enabled
RECOMMENDED CURRENCY PAIRS 💱
------------------------------
This strategy is optimized for currency pairs and performs exceptionally well
on the following pairs when properly configured:
TOP PERFORMING PAIRS:
- USDCAD: Can achieve Profit Factor > 2.0 and Win Rate up to 70%
- EURUSD: Excellent performance with consistent signals
- GBPJPY: Strong results with proper EMA filter configuration
These pairs have shown the best historical performance due to:
- Clear trending characteristics
- Good response to CCI overbought/oversold levels
- Strong alignment with EMA 50/200 trend filter
- High liquidity ensuring reliable execution
When trading these pairs, use the default settings or slightly adjusted
parameters based on the pair's volatility. Always backtest on historical
data before using real money to find the optimal configuration for each
specific pair.
PRACTICAL EXAMPLE 📝
--------------------
Scenario: LONG Entry on EUR/USD
1. Market conditions:
- Price: 1.1000
- CCI: -80 (in oversold zone)
- Smoothing MA: -90
- CCI crosses above Smoothing MA (crossover occurs)
- EMA50: -50, EMA200: -70 (EMA50 > EMA200, uptrend confirmed)
2. Strategy checks conditions:
✓ Smoothing MA enabled: Yes
✓ Crossover: Yes (CCI crosses above MA)
✓ CCI in range: Yes (-100 <= -80 <= 0)
✓ EMA Filter: Yes (EMA50 > EMA200)
✓ No existing position: Yes
3. Strategy opens position:
- Direction: LONG (Buy)
- Entry: 1.1000 (current close)
- Take Profit: 1.1110 (1.0% above entry)
- Stop Loss: 1.0945 (0.5% below entry)
- Risk/Reward: 2:1
4. Outcome scenarios:
- If price rises to 1.1110 → Take Profit hit (profit)
- If price falls to 1.0945 → Stop Loss hit (loss limited)
IMPORTANT NOTE ⚠️
-----------------
This strategy is a technical analysis tool based on CCI and EMA indicators.
Like all trading strategies, it does NOT guarantee profits. Trading involves
significant risks and you can lose money, including your entire investment.
Past performance does not guarantee future results.
Always:
- Use appropriate risk management
- Never risk more than you can afford to lose
- Test the strategy on historical data (backtesting) before using real money
- Start with small position sizes or paper trading
- Understand that no strategy works 100% of the time
- Consider market conditions, news events, and other factors
- Keep a trading journal to learn and improve
The author and contributors are NOT responsible for any losses incurred from
using this strategy. Trading decisions are your own responsibility. Profits
are NOT guaranteed, and losses are possible.
LICENSE 📄
----------
This code is open source and available for modification. You are free to use,
modify, and distribute this strategy. If you republish or share a modified
version, please kindly mention the original author.
================================================================================

Delta Volume EMA Strategy
================================================================================
DELTA VOLUME EMA STRATEGY - STRATEGY GUIDE 📊
================================================================================
💡 COLLABORATION & SUPPORT
---------------------------
If you want to collaborate, have an idea for a strategy, or need help writing
or customizing code, send an email to burdytrader@gmail.com or send me a
message. Suggestions, ideas, and comments are always welcome! 🤝
================================================================================
⚠️ IMPORTANT: INSTRUMENT SELECTION 📈
-------------------------------------
This strategy performs BEST with instruments that have a centralized data flow,
such as Futures contracts. Centralized markets provide more accurate and
reliable volume data, which is essential for Volume Delta analysis to work
effectively.
Why Futures? 🎯
- Centralized exchange = Accurate volume data
- All trades flow through a single exchange
- Volume reflects true buying/selling pressure
- Better correlation between volume and price movements
While the strategy can work with other instruments (stocks, forex, etc.),
volume data quality may vary, which can affect the reliability of Volume Delta
signals. For optimal performance, use Futures contracts or other instruments
with centralized, high-quality volume data.
================================================================================
WHAT DOES THIS STRATEGY DO? 🎯
---------------------------
This strategy uses Volume Delta analysis combined with Exponential Moving
Averages (EMA) to identify high-probability trading opportunities. The Volume
Delta measures the difference between buying and selling pressure, helping to
identify when strong institutional or smart money movements occur. The strategy
automatically enters trades when volume delta reaches extreme levels, indicating
potential trend continuation or reversal points.
HOW IT WORKS? ⚙️
---------------
1. VOLUME DELTA CALCULATION 📈
The strategy calculates the Volume Delta using the following formula:
- Volume Ratio (v) = Current Volume / Previous Volume
- EMA of Close (mac) = EMA(Close, MA Length) × Volume Ratio
- EMA of Open (mao) = EMA(Open, MA Length) × Volume Ratio
- Volume Delta (vd) = mac - mao
The Volume Delta shows:
- Positive values (green) = Buying pressure (buyers are more active)
- Negative values (red) = Selling pressure (sellers are more active)
2. VOLUME DELTA MOVING AVERAGE 📊
The strategy calculates an EMA of the Volume Delta (vdma) to smooth out
fluctuations and identify the overall trend of buying/selling pressure:
- vdma = EMA(Volume Delta, EMA Length)
- When vdma is above zero = Overall buying pressure
- When vdma is below zero = Overall selling pressure
3. PERCENTILE-BASED ENTRY CONDITIONS 🎲
Instead of using fixed thresholds, the strategy uses percentile analysis to
identify extreme volume delta movements:
For LONG entries:
- Analyzes seller volumes (negative volume delta) over the lookback period
- Calculates the percentile threshold (default: 80th percentile)
- Enters LONG when volume delta becomes positive AND exceeds the threshold
- This indicates a strong shift from selling to buying pressure
For SHORT entries:
- Analyzes buyer volumes (positive volume delta) over the lookback period
- Calculates the percentile threshold (default: 80th percentile)
- Enters SHORT when volume delta becomes negative AND exceeds the threshold
- This indicates a strong shift from buying to selling pressure
4. POSITION SIZING 💰
The strategy offers two position sizing methods:
a) RISK VALUE (Fixed Risk in Dollars):
- Calculates position size based on a fixed dollar risk amount
- Formula: Position Size = Risk Amount / (Entry Price × Stop Loss %)
- Ensures consistent risk per trade regardless of price level
b) LOTS SIZE:
- Uses a fixed lot size for all trades
- Simple and straightforward approach
- Useful when you want consistent position sizes
5. TAKE PROFIT & STOP LOSS SETTINGS 🎯
The strategy offers flexible TP/SL configuration in three modes:
a) PERCENTAGE (%):
- TP/SL calculated as a percentage of entry price
- Example: 2% TP means entry price × 1.02 (for LONG) or × 0.98 (for SHORT)
- Adapts automatically to different price levels
b) CURRENCY:
- TP/SL set as a fixed currency amount
- Example: $100 TP means entry price + $100 (for LONG) or - $100 (for SHORT)
- Useful for instruments with consistent price movements
c) PIPS:
- TP/SL set as a fixed number of pips
- Automatically converts pips to price using the instrument's minimum tick
- Ideal for forex and other pip-based instruments
6. AUTOMATIC TRADE EXECUTION ⚡
When entry conditions are met:
- Opens a position (LONG or SHORT) at market price
- Automatically sets Take Profit and Stop Loss based on selected mode
- Sends an alert with all trade information
- Only one position at a time (waits for current position to close)
AVAILABLE PARAMETERS ⚙️
----------------------
1. MA LENGTH (Default: 10)
- Length of the Exponential Moving Average used for close and open prices
- Lower values = More sensitive to recent price action
- Higher values = More smoothed, less sensitive
2. EMA LENGTH (Default: 20)
- Length of the EMA applied to Volume Delta
- Controls the smoothing of the volume delta signal
- Lower values = Faster signals, more trades
- Higher values = Slower signals, fewer but potentially more reliable trades
3. POSITION SIZE MODE
- "Risk Value": Calculate position size based on fixed dollar risk
- "Lots Size": Use fixed lot size for all trades
4. FIXED RISK IN $ (Default: 50)
- Only used when Position Size Mode = "Risk Value"
- The dollar amount you're willing to risk per trade
- Strategy calculates position size automatically
5. LOT SIZE (Default: 0.01)
- Only used when Position Size Mode = "Lots Size"
- Fixed lot size for all trades
6. TAKE PROFIT MODE
- "%": Percentage of entry price
- "Currency": Fixed currency amount
- "Pips": Fixed number of pips
7. STOP LOSS MODE
- "%": Percentage of entry price
- "Currency": Fixed currency amount
- "Pips": Fixed number of pips
8. TAKE PROFIT / STOP LOSS VALUES
- Different input fields appear based on selected mode
- Configure TP and SL independently
9. VOLUME LOOKBACK PERIOD (Default: 20)
- Number of bars used to calculate percentile thresholds
- Lower values = More sensitive, adapts faster to recent conditions
- Higher values = More stable, uses longer-term statistics
10. PERCENTILE THRESHOLD (Default: 80%)
- The percentile level used to identify extreme volume delta movements
- 80% means: only enter when volume delta exceeds 80% of recent values
- Higher values = Fewer but potentially stronger signals
- Lower values = More frequent signals
VISUALIZATION 📊
---------------
The strategy displays on the chart:
1. VOLUME DELTA COLUMNS
- Green columns = Positive volume delta (buying pressure)
- Red columns = Negative volume delta (selling pressure)
- Height represents the magnitude of buying/selling pressure
2. VOLUME DELTA MA AREA
- Two overlapping area plots showing the smoothed volume delta
- Black area (base layer) for overall visualization
- Green area (when positive) = Overall buying pressure trend
- Red area (when negative) = Overall selling pressure trend
- Helps identify the dominant market sentiment
3. ZERO LINE
- Horizontal line at zero
- Helps visualize when buying/selling pressure crosses the neutral point
ALERTS 🔔
--------
When enabled, the strategy sends alerts when a trade is opened. The alert
message includes:
- Direction: "Buy" for LONG positions or "Sell" for SHORT positions
- Entry Price: The price at which the position was opened
- TP (Take Profit): The target profit price
- SL (Stop Loss): The stop loss price
Example alert message:
"Buy | Entry: 1.2050 | TP: 1.2250 | SL: 1.1950"
Alerts can be configured in TradingView to send notifications via email,
SMS, webhooks, or other platforms.
RECOMMENDED SETTINGS 🎯
-----------------------
To get started, you can use these settings:
STRATEGY PARAMETERS:
- MA Length: 10 (default)
- EMA Length: 20 (default)
- Volume Lookback Period: 20 (default)
- Percentile Threshold: 80% (default)
POSITION SIZING:
- Position Size Mode: "Risk Value" (for risk management)
- Fixed Risk in $: Adjust based on your account size (e.g., 1-2% of account)
- OR use "Lots Size" with 0.01 lots for small accounts
TAKE PROFIT & STOP LOSS:
- TP Mode: "%" (recommended for most instruments)
- SL Mode: "%" (recommended for most instruments)
- Take Profit (%): 2.0% (adjust based on your risk/reward preference)
- Stop Loss (%): 1.0% (adjust based on your risk tolerance)
For Forex:
- Consider using "Pips" mode for TP/SL
- Typical values: 20-50 pips TP, 10-30 pips SL
For Stocks/Indices:
- Use "%" mode for TP/SL
- Typical values: 2-5% TP, 1-2% SL
PRACTICAL EXAMPLE 📝
-------------------
Scenario: LONG Entry on EUR/USD
1. Market conditions:
- Price: 1.1000
- Volume Delta becomes strongly positive
- Volume Delta exceeds 80th percentile of recent seller volumes
2. Strategy calculates:
- Entry Price: 1.1000 (current close)
- Position Size Mode: "Risk Value"
- Fixed Risk: $50
- Stop Loss Mode: "%"
- Stop Loss: 1.0%
- Position Size = $50 / (1.1000 × 0.01) = 4.55 lots
3. Strategy opens position:
- Direction: LONG (Buy)
- Entry: 1.1000
- Take Profit: 1.1220 (2% above entry)
- Stop Loss: 1.0890 (1% below entry)
- Alert sent: "Buy | Entry: 1.1000 | TP: 1.1220 | SL: 1.0890"
4. Outcome scenarios:
- If price rises to 1.1220 → Take Profit hit (profit)
- If price falls to 1.0890 → Stop Loss hit (loss limited to $50)
IMPORTANT NOTE ⚠️
-----------------
This strategy is a technical analysis tool based on volume delta analysis.
Like all trading strategies, it does NOT guarantee profits. Trading involves
significant risks and you can lose money, including your entire investment.
Past performance does not guarantee future results.
Always:
- Use appropriate risk management
- Never risk more than you can afford to lose
- Test the strategy on historical data (backtesting) before using real money
- Start with small position sizes or paper trading
- Understand that no strategy works 100% of the time
- Consider market conditions, news events, and other factors
- Keep a trading journal to learn and improve
The author and contributors are NOT responsible for any losses incurred from
using this strategy. Trading decisions are your own responsibility. Profits
are NOT guaranteed, and losses are possible.
LICENSE 📄
---------
This code is open source and available for modification. You are free to use,
modify, and distribute this strategy. If you republish or share a modified
version, please kindly mention the original author.
================================================================================

Dubic EMA StrategyThe Dubic EMA Strategy is a trend-following and volatility-aware strategy that combines dual EMA filters with intelligent range and noise detection to provide clean, actionable entries. It's designed to avoid choppy markets, enhance trade precision, and adapt to different market conditions.
✅ Key Features:
Dual EMA Filter: Enters long when price is above both EMA High & EMA Low, and short when below both.
Range Filter: Avoids entries during tight consolidations or sideways markets.
Volatility Filter: Prevents trading in low-ATR conditions.
Dynamic Risk Management:
ATR-based or fixed % Stop Loss and Take Profit.
Optional Parabolic SAR trailing stop.
One Trade per Trend: Prevents re-entry until trend direction changes.
Unbroken Range Visualization: Detects and displays consolidation zones that can lead to breakouts.
Alerts & Labels: Clean BUY/SELL signals with alerts and chart labels.
🧩 Customization Options:
Adjustable EMA length
Toggle between ATR or % based SL/TP
Volatility threshold
Range detection sensitivity
Enable/disable SAR trailing stop
This strategy works best on trending assets and timeframes with volatility (e.g., crypto, forex, indices). Suitable for both manual trading and automation.
🛠️ Built for clarity, control, and precision.
📈 Backtest, optimize, and deploy with confidence.

5 EMA STRATEGY by Power of Stocks(StockYogi)5 EMA STRATEGY by Power of Stocks(StockYogi)
This is a 5 EMA Breakout Strategy inspired by the trading principles taught by Shubhashi Pani, founder of the Power of Stocks (POS) community.
The strategy is designed to:
• Detect breakout setups when price breaks the high/low of a signal candle (based on EMA conditions)
• Enter trades only if the breakout occurs within the next 3 candles
• Allow multiple trades in the same direction without closing the earlier one
• Use independent stop-loss (SL) and take-profit (TP) targets for each trade based on a user-defined risk-reward ratio
• Optionally enter trades only at candle close
• Optionally avoid trades during a custom time window (e.g., 3:00 PM to 3:30 PM IST)
• Optionally close all open positions at a defined time (e.g., 3:30 PM IST)
The goal of this strategy is to provide greater flexibility and realism for intraday or short-term traders following structured breakout systems.
Disclaimer: This script is an implementation of technical ideas for educational purposes only. It is not financial advice. All trading involves risk, and past performance does not guarantee future results.
Strategy Credits:
This strategy is based on publicly known breakout rules taught by Shubhashi Pani (Power of Stocks). This is not an official POS script, and I am not affiliated with the Power of Stocks team. This implementation was developed independently to follow the logic shared for educational use.
Feel free to use, backtest, and modify according to your needs. Constructive feedback is welcome!

kurd fx Dynamic EMA StrategyDynamic EMA Strategy Explanation
This TradingView Pine Script indicator, "Dynamic EMA Strategy," is designed to plot Exponential Moving Averages (EMAs) dynamically based on the selected timeframe. It adjusts the EMA periods depending on whether the trader is scalping, swing trading, or position trading.
Functionality
1. Defining EMA Periods Based on Timeframe
The script determines appropriate EMA values based on the selected chart timeframe:
Scalping (1m, 3m, 5m)
Uses EMA 9, EMA 21, and EMA 50 for fast-moving market conditions.
Swing Trading (15m, 30m, 45m)
Uses EMA 50 and EMA 100, suitable for medium-term trend identification.
EMA 3 is disabled (na) in this mode.
Position Trading (1H and higher)
Uses EMA 100 and EMA 200 to identify long-term trends.
EMA 3 is disabled (na) in this mode.
2. EMA Calculation
The script calculates EMA values dynamically:
emaLine1 = ta.ema(close, ema1): Computes the first EMA.
emaLine2 = ta.ema(close, ema2): Computes the second EMA.
emaLine3 = not na(ema3) ? ta.ema(close, ema3) : na: Computes the third EMA only if applicable.
3. Plotting the EMAs
The script overlays the EMAs on the chart:
Blue Line (EMA 1) → Represents the fastest EMA.
Orange Line (EMA 2) → Represents the medium EMA.
Red Line (EMA 3) → Represents the slowest EMA (if applicable).
Each EMA is plotted using plot() with a specific color, linewidth of 2, and plot.style_line for a clean visualization.
Use Case
Scalpers can identify short-term momentum changes.
Swing traders can detect medium-term trends.
Position traders can spot long-term market trends.
This strategy helps traders adjust their EMA settings dynamically without manually changing them for different timeframes.

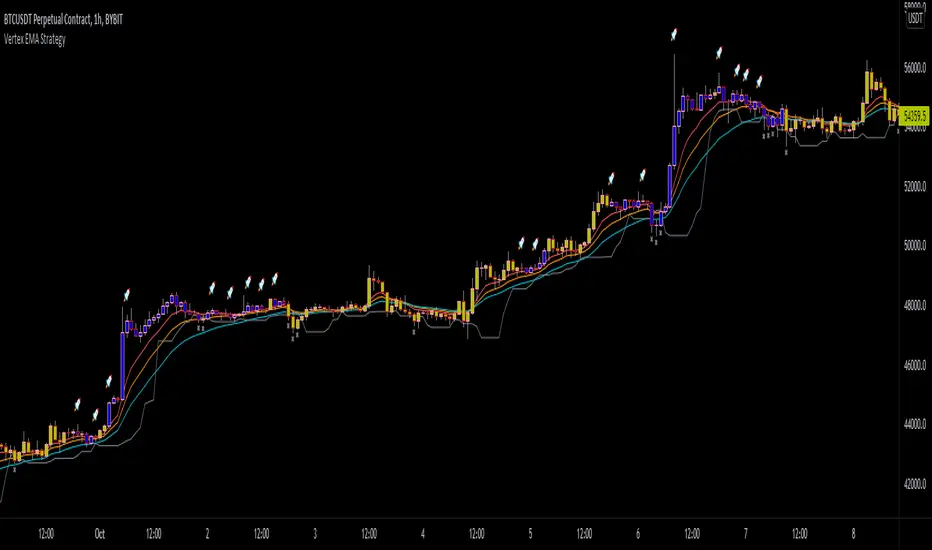
Vertex EMA StrategyRecently found an article sharing an EMA strategy written by Vertex. I copied a majority of the Long conditions into code here with some visual aid.
Essentially, watch for a the 8 EMA to be greater than the 21 EMA, and all the EMA's to be spread apart. Then get your trigger bar from a retracement from the 8 bar EMA. Stop on the lowest low of the past 5 bars, or on EMA 8 crossunder EMA 21.
This is intended to only be used on a 1h chart.
This was made for a friend.
Disclaimer : Please do your own research before making any decisions financially. I am not your financial advisor.
Know Sure Thing and EMA Strategy by JLXThis is a simple strategy based in Know Sure Thing indicator and an Exponential moving average,
Rules are as follow:
- You can go long when the KST cross signal bellow 0 and price closes above the target EMA
- You can go short when the KST cross signal above 0 and price closes bellow the target EMA
I include a trailing stop loss, default its 0.5%
Hope you enjoy it

Triple EMA StrategyThis is my first ever script so any suggestions, recommendations or improvement ideas welcome!
This strategy is an implementation of a standard three exponential moving averages strategy (defaults: EMA1=5, EMA2=20 and EMA3=50 candles). Trades are executed if EMA1 crosses above/below EMA2 and they are both above/below EMA3. In addition, the close of the current candle must be above/below the previous one by at least the number of ticks you specify in the "buffer" parameter (default 150 ticks). This additional check eliminates many bad trades.
There is also a trailing stoploss which comes into play once the price has gone above/below its initial value which it then follows the price with to ensure the trade closes at the highest possible price.
I find this strategy works best on a 15 minute chart but feel free to play around and fine tune the various parameters. If you find a good setup that returns decent profits, I'd be keen to hear it!

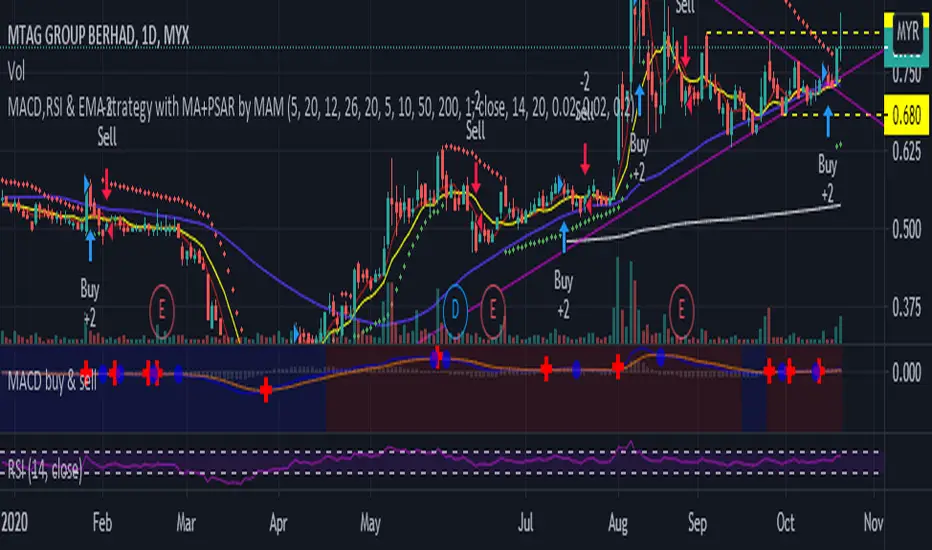
MACD,RSI & EMA strategy with MA+PSAR by MAMMACD,RSI & EMA strategy with MA+PSAR
Buy strategy
- MACD above signal
- RSI above RSI signal
- Close price above EMA
Sell Strategy
- MACD below signal
- RSI below RSI signal
- Close price below EMA

MicuRobert EMA Cross StrategyThis is a repost of a old strategy that cant be updated anymore, it was a request for a user made in Oct, 6, 2015
Here's a possible engaging description for the tradingview script:
**MicuRobert EMA Cross V2: A Powerful Trading Strategy**
Join the ranks of successful traders with this advanced strategy, designed to help you profit from market trends. The MicuRobert EMA Cross V2 combines two essential indicators - Exponential Moving Average (EMA) and Divergence EMA (DEMA) - to generate buy and sell signals.
**Key Features:**
* **Trading Session Filter**: Only trade during your preferred session, ensuring you're in sync with market conditions.
* **Trailing Stop**: Automatically adjust stop-loss levels to lock in profits or limit losses.
* **Customizable Trade Size**: Set the size of each trade based on your risk tolerance and trading goals.
**How it Works:**
The script uses two EMAs (5-period and 34-period) to identify trends. When the shorter EMA crosses above the longer one, a buy signal is generated. Conversely, when the shorter EMA falls below the longer one, a sell signal is triggered. The strategy also incorporates divergence analysis between price action and the EMAs.
**Visual Aids:**
* **EMA Plots**: Visualize the two EMAs on your chart to gauge market momentum.
* **Buy/Sell Signals**: See when buy or sell signals are generated, along with their corresponding entry prices.
* **Trailing Stop Lines**: Monitor stop-loss levels as they adjust based on price action.
**Get Started:**
Download this script and start trading like a pro! With its robust features and customizable settings, the MicuRobert EMA Cross V2 is an excellent addition to any trader's arsenal.
~Llama3

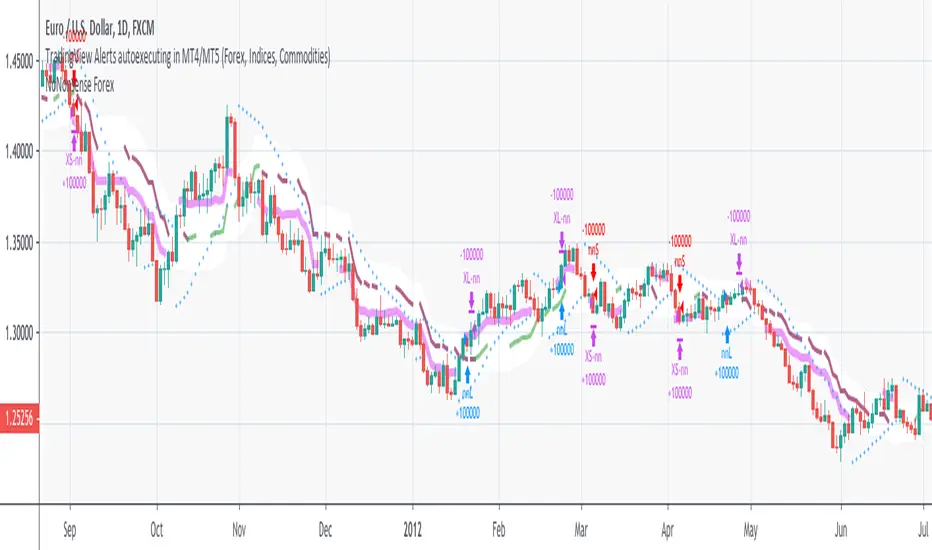
NoNonsense Forex - high timeframe trading absurd NON-REPAINTINGSome time ago I bumped into NoNonsense Forex - pretty good-looking course with well-designed videos, reasonable rules, etc. Nice explanatory videos, not selling anything, building indicators-only strategy. But there was one thing that really annoyed me - it was supposed to work only on Daily timeframe. What is the point in trading such high timeframe, if decisions changing market direction are playing out within 1 minute? What is the point in evaluating trades from 1994 if we are 25 years later?
Anyway, I have developed this strategy, which is:
- non-repainting
- not using trailing-stop
- not using any other known TradingView backtest bugs
And I'm showing it as an example of OVERFITTING. Backtesting results look absurd: 100% profitable. But if you change any of the many parameters in the Settings popup, they will turn into disaster. It means, the rules of this strategy are very fragile. Don't trade this! Remember about backtesting rule #1: past results do not guarantee success in the future.
I'm giving this strategy out with the source code. Feel free to do anything you want with it. But if you find parameters or modifications on, which allow profitable trading on lower timeframes, don't be shy, let me know :)
*********
Forex / Indices / Commodities traders who want to start AUTO-TRADING might want to take a look at "TradingConnector", which allows no-latency trades execution from TradingView to MT4/MT5.
EMA StrategyThis strategy is in testing and development.
**USE AT YOUR OWN RISK. **
This defaults to a 13/48 EMA using the closing price. When the fast EMA crosses above the slow it triggers a buy. When it crosses below the slow EMA it triggers a sell and potentially a short, but that is not implemented. Stops, trailing stops, and pyramiding to be added. The purpose of this strategy is to signal recommended entry and exit point and back test whether the strategy works. It is not intended to be an automated buy/sell script.
* stop loss added. Not yet configurable from the settings panel. Defaults to 8% from the entry price.
TODO:
Add the ability to configure the stop-loss level in the settings panel
Add trailing stop functionality
Add profit taking, likely configurable sell targets (2:1 risk to reward gain for example)
Add another signal or two to help improve odds of making a winning trade.

EMA Strategy v_1 by.JanS.This Strategy use in 1 hour and daily graph.
Long Strategy;
The strategy is if the EMA_5 cross over EMA_10 in 1 hour chart, it is long opportunity. Now check the price on daily chart.
If the EMA_5 cross over EMA_10 in daily chart, long more!!.
Short Strategy;
If the EMA_5 cross under EMA_10 in 1 hour chart, it is a short opportunity. Now check the price on daily chart.
If the EMA_5 cross under EMA_10 in daily chart, short more!!
This is my first pine editor code. I am new at coding.


EMA Strategy For Index FuturesThis is a simple long-term strategy based on EMA crossover basically designed for Index futures


The Flash-Strategy (Momentum-RSI, EMA-crossover, ATR)The Flash-Strategy (Momentum-RSI, EMA-crossover, ATR)
Are you tired of manually analyzing charts and trying to find profitable trading opportunities? Look no further! Our algorithmic trading strategy, "Flash," is here to simplify your trading process and maximize your profits.
Flash is an advanced trading algorithm that combines three powerful indicators to generate highly selective and accurate trading signals. The Momentum-RSI, Super-Trend Analysis and EMA-Strategy indicators are used to identify the strength and direction of the underlying trend.
The Momentum-RSI signals the strength of the trend and only generates trading signals in confirmed upward or downward trends. The Super-Trend Analysis confirms the trend direction and generates signals when the price breaks through the super-trend line. The EMA-Strategy is used as a qualifier for the generation of trading signals, where buy signals are generated when the EMA crosses relevant trend lines.
Flash is highly selective, as it only generates trading signals when all three indicators align. This ensures that only the highest probability trades are taken, resulting in maximum profits.
Our trading strategy also comes with two profit management options. Option 1 uses the so-called supertrend-indicator which uses the dynamic ATR as a key input, while option 2 applies pre-defined, fixed SL and TP levels.
The settings for each indicator can be customized, allowing you to adjust the length, limit value, factor, and source value to suit your preferences. You can also set the time period in which you want to run the backtest and how many dollar trades you want to open in each position for fully automated trading.
Choose your preferred trade direction and stop-loss/take-profit settings, and let Flash do the rest. Say goodbye to manual chart analysis and hello to consistent profits with Flash. Try it now!
General Comments
This Flash Strategy has been developed in cooperation between Baby_whale_to_moon and JS-TechTrading. Cudos to Baby_whale_to_moon for doing a great job in transforming sophisticated trading ideas into pine scripts.
Detailed Description
The “Flash” script considers the following indicators for the generation of trading signals:
1. Momentum-RSI
2. ‘Super-Trend’-Analysis
3. EMA-Strategy
1. Momentum-RSI
• This indicator signals the strength of the underlying upward- or downward-trend.
• The signal range of this indicator is from 0 to 100. Values > 60 indicate a confirmed upward- or downward-trend.
• The strategy will only generate trading signals in case the stock (or any other financial security) is in a confirmed upward- (long entry signals) or downward-trend (short entry signals).
• This indicator provides information with regards to the strength of the underlying trend and it does not give any insight with regard to the direction of the trend. Therefore, this strategy also considers other indicators which provide technical confirmation with regards to the direction of the underlying trend.
Graph 1 shows this concept:
• The Momentum-RSI indicator gives lower readings during consolidation phases and no trading signals are generated during these periods.
Example (graph 2):
2. Super-Trend Analysis
• The red line in the graph below represents the so-called super-trend-line. Trading signals are only generated in case the price action breaks through this super-trend-line indicating a new confirmed upward-trend (or downward-trend, respectively).
• If that happens, the super trend-line changes its color from red to green, giving confirmation that the trend changed from bearish to bullish and long-entries can be considered.
• The vice-versa approach can be considered for short entries.
Graph 3 explains this concept:
3. Exponential Moving Average / EMA-Strategy
The functionality of this EMA-element of the strategy has been programmed as follows:
• The exponential moving average and two other trend lines are being used as qualifiers for the generation of trading-signals.
• Buy-signals for long-entries are only considered in case the EMA (yellow line in the graph below) crosses the red line.
• Sell-signals for short-entries are only considered in case the EMA (yellow line in the graph below) crosses the green line.
An example is shown in graph 4 below:
We use this indicator to determine the new trend direction that may occur by using the data of the price's past movement.
4. Bringing it all together
This section describes in detail, how this strategy combines the Momentum-RSI, the super-trend analysis and the EMA-strategy.
The strategy only generates trading-signals in case all of the following conditions and qualifiers are being met:
1. Momentum-RSI is higher than the set value of this strategy. The standard and recommended value is 60 (graph 5):
2. The super-trend analysis needs to indicate a confirmed upward-trend (for long-entry signals) or a confirmed downward-trend (for short-entry signals), respectively.
3. The EMA-strategy needs to indicate that the stock or financial security is in a confirmed upward-trend (long-entries) or downward-trend (short-entries), respectively.
The strategy will only generate trading signals if all three qualifiers are being met. This makes this strategy highly selective and is the key secret for its success.
Example for Long-Entry (graph 6):
When these conditions are met, our Long position is opened.
Example for Short-Entry (graph 7):
Trade Management Options (graph 8)
Option 1
In this dynamic version, the so-called supertrend-indicator is being used for the trade exit management. This supertrend-indicator is a sophisticated and optimized methodology which uses the dynamic ATR as one of its key input parameters.
The following settings of the supertrend-indicator can be changed and optimized (graph 9):
The dynamic SL/TP-lines of the supertrend-indicator are shown in the charts. The ATR-length and the supertrend-factor result in a multiplier value which can be used to fine-tune and optimize this strategy based on the financial security, timeframe and overall market environment.
Option 2 (graph 10):
Option 2 applies pre-defined, fixed SL and TP levels which will appear as straight horizontal lines in the chart.
Settings options (graph 11):
The following settings can be changed for the three elements of this strategy:
1. (Length Mom-Rsi): Length of our Mom-RSI indicator.
2. Mom-RSI Limit Val: the higher this number, the more momentum of the underlying trend is required before the strategy will start creating trading signals.
3. The length and factor values of the super trend indicator can be adjusted:ATR Length SuperTrend and Factor Super Trend
4. You can set the source value used by the ema trend indicator to determine the ema line: Source Ema Ind
5. You can set the EMA length and the percentage value to follow the price: Length Ema Ind and Percent Ema Ind
6. The backtesting period can be adjusted: Start and End time of BackTest
7. Dollar cost per position: this is relevant for 100% fully automated trading.
8. Trade direction can be adjusted: LONG, SHORT or BOTH
9. As we explained above, we can determine our stop-loss and take-profit levels dynamically or statically. (Version 1 or Version 2 )
Display options on the charts graph 12):
1. Show horizontal lines for the Stop-Loss and Take-profit levels on the charts.
2. Display relevant Trend Lines, including color setting options for the supertrend functionality. In the example below, green lines indicate a confirmed uptrend, red lines indicate a confirmed downtrend.
Other comments
• This indicator has been optimized to be applied for 1 hour-charts. However, the underlying principles of this strategy are supply and demand in the financial markets and the strategy can be applied to all timeframes. Daytraders can use the 1min- or 5min charts, swing-traders can use the daily charts.
• This strategy has been designed to identify the most promising, highest probability entries and trades for each stock or other financial security.
• The combination of the qualifiers results in a highly selective strategy which only considers the most promising swing-trading entries. As a result, you will normally only find a low number of trades for each stock or other financial security per year in case you apply this strategy for the daily charts. Shorter timeframes will result in a higher number of trades / year.
• Consequently, traders need to apply this strategy for a full watchlist rather than just one financial security.
