EMA Candle ColorEMA Candle Color - Visual EMA-Based Candle Coloring System
Overview:
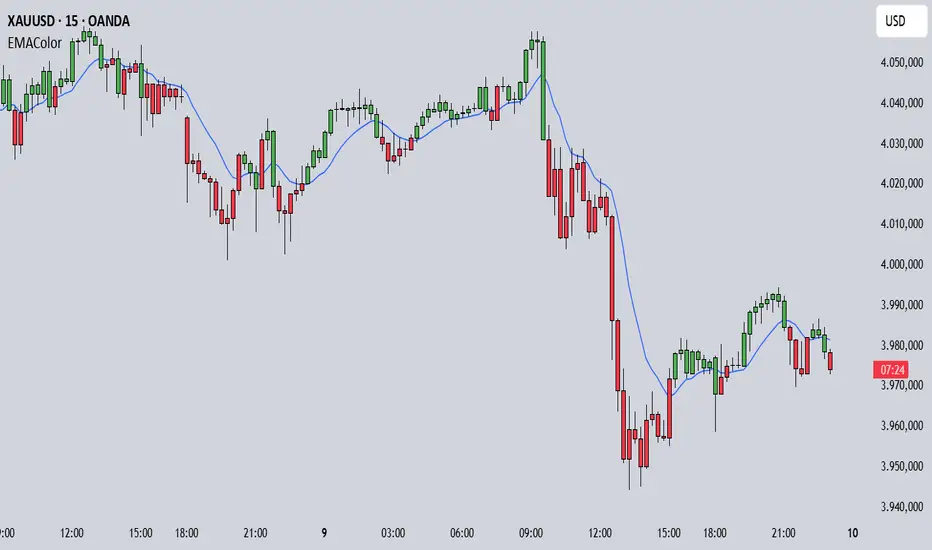
This indicator provides a visual approach to trend identification by coloring candles based on their relationship with an Exponential Moving Average (EMA). The script dynamically colors both the candle bars and plots custom candles to give traders an immediate visual representation of price momentum relative to the EMA.
How It Works:
The indicator calculates an EMA based on your chosen source (default: open price) and length (default: 10 periods). It then applies a simple yet effective rule:
When the source price is ABOVE the EMA → Candles turn GREEN (bullish)
When the source price is BELOW the EMA → Candles turn RED (bearish)
This instant visual feedback helps traders quickly identify:
Current trend direction
Potential support/resistance levels (the EMA line itself)
Momentum shifts when candles change color
Key Features:
Customizable EMA Parameters: Adjust the EMA length (1-500) and source (open, close, high, low, hl2, hlc3, ohlc4)
Custom Color Selection: Choose your preferred bullish and bearish colors to match your chart theme
Dual Visualization: Both bar coloring and custom plotcandle for enhanced visibility
Offset Capability: Shift the EMA line forward or backward for advanced analysis
Clean Design: Minimal overlay that doesn't clutter your chart
How to Use:
1. Add the indicator to your chart
2. Adjust the EMA Length based on your trading timeframe:
- Shorter periods (5-20) for day trading and scalping
- Medium periods (20-50) for swing trading
- Longer periods (50-200) for position trading
3. Watch for candle color changes as potential entry/exit signals
4. Combine with other indicators for confirmation
Trading Applications:
Trend Following: Stay in trades while candles remain the same color
Reversal Signals: Watch for color changes as early reversal warnings
Filter System: Only take long positions during green candles, shorts during red
Visual Clarity: Quickly assess market sentiment at a glance
Settings:
Length: EMA calculation period (default: 10)
Source: Price data used for EMA calculation (default: open)
Offset: Shift EMA line on chart (default: 0)
Bullish Color: Color for candles above EMA (default: green)
Bearish Color: Color for candles below EMA (default: red)
Technical Details:
The script uses Pine Script v6 and employs the standard ta.ema() function for smooth, responsive EMA calculations. The candle coloring is achieved through both barcolor() and plotcandle() functions, ensuring visibility across different chart settings.
Note:
This indicator works on all timeframes and instruments. For best results, combine with proper risk management and additional confirmation indicators. The EMA Candle Color system is designed to simplify trend identification, not as a standalone trading system.
Tips:
Use on higher timeframes for more reliable signals
Combine with volume analysis for confirmation
Consider using multiple EMA periods for confluence
Disable default candles if using the plotcandle feature to avoid overlap
This script is open-source. Feel free to use it as a foundation for your own trading system or modify it to suit your specific trading style.
Cari dalam skrip untuk "ema"
EMA 50/200/100 [NevoxCore]⯁ OVERVIEW
EMA 50/200/100 is a clean EMA trio for trend mapping.
It highlights the classic 50/200 bias, keeps a constant EMA-100 anchor in white, plots cross dots, and can mark the first pullback back to a target EMA within an ATR tolerance.
Solid bias bar coloring (Nevox pink/orange or classic green/red) and compact visuals make it fast and reliable with no repainting.
⯁ HOW IT WORKS
Calculates Fast EMA 50, Slow EMA 200, and an always-on EMA 100 (white).
Bias = Fast vs. Slow: Fast > Slow → long regime; Fast < Slow → short regime.
Cross dots appear at confirmed 50/200 crosses (once per bar close).
First Pullback: after a cross, the script arms a window and marks the first return to the chosen EMA (100 or Fast) within ATR × tolerance.
Bar coloring is solid by regime (pink/orange by default, classic green/red when enabled).
No lookahead; signals confirm on bar close.
⯁ KEY FEATURES
• EMA 50/200 with EMA-100 anchor (always visible, white)
• Cross Up/Down dots (style-configurable)
• First Pullback marker (toggle) with ATR tolerance & window
• Solid bias bar coloring (Nevox or classic)
• Optional bias fill between Fast/Slow
• Minimal 1-cell HUD (OFF by default)
• Ready-made alerts with clean prefixes
⯁ SETTINGS (quick)
Visual: Classic colors toggle; Bias Fill (ON); Fill Transparency (85); Bar Color (solid, ON; auto-disabled when Classic is ON).
Core: Source = Close; EMA Fast = 50; EMA Slow = 200.
Pullback: Show marker (ON); Target EMA = EMA 100; Tolerance × ATR = 0.5; Max Bars After Cross = 40; ATR Length = 14.
HUD: Mini HUD OFF; Position selector.
Status Line: OFF by default (optional EMA values).
⯁ ALERTS (built-in)
• Cross Up (Fast above Slow) — confirmed at bar close
• Cross Down (Fast below Slow) — confirmed at bar close
• First Pullback LONG — first return to target after long cross
• First Pullback SHORT — first return to target after short cross
Prefix: EMA and message includes {{ticker}} {{interval}} @ {{close}}.
Suggested: set TradingView alerts to Once Per Bar Close.
⯁ HOW TO USE
• Read trend quickly: 50 above 200 with a rising 100 = healthy long bias.
• Use the First Pullback to time entries after a cross (default target = EMA 100).
• Tune Tolerance × ATR by symbol/TF; 0.3–0.7 is a good start.
• Keep charts clean: bias fill + barcolor ON; switch to Classic for green/red if preferred.
⯁ WHY IT’S DIFFERENT
It preserves the classic 50/200 logic but adds a consistent EMA-100 anchor, a single, one-shot pullback detector, and clean bias bars — all in a lightweight overlay with no repaint tricks.
⯁ DISCLAIMER
Backtest and paper-trade before using live. Not financial advice. Performance depends on market, timeframe, and parameters.

200 EMA w/ Ticker Memory200 EMA w/ Ticker Memory — Multi-Symbol & Multi-Timeframe EMA Tracker with Alerts
Overview
The 200 EMA w/ Ticker Memory indicator allows you to monitor the 200-period Exponential Moving Average (EMA) across multiple symbols and timeframes. Designed for traders managing multiple tickers, it provides customizable timeframe inputs per symbol and instant alerts on price touches of the 200 EMA.
Key Features
Multi-symbol support: Configure up to 20 different symbols, each with its own timeframe setting.
Flexible timeframe input: Assign specific timeframes per symbol or use a default timeframe fallback.
Accurate 200 EMA calculation: Uses request.security to fetch 200 EMA from the symbol-specific timeframe.
Visual EMA plots: Displays both the EMA on the selected timeframe and the EMA on the current chart timeframe for comparison.
Touch alerts: Configurable alerts when price “touches” the 200 EMA within a user-defined sensitivity percentage.
Ticker memory: Remembers your configured symbols and displays them in an on-chart table.
Compact info table: Displays current symbol status, alert settings, and timeframe in a clean, transparent table overlay.
How to Use
Configure Symbols and Timeframes:
Input your desired symbols (up to 20) and their respective timeframes under the “Symbol Settings” groups in the indicator’s settings pane.
Set Default Timeframe:
Choose a default timeframe to be used when no specific timeframe is assigned for a symbol.
Adjust Alert Settings:
Enable or disable alerts and set the touch sensitivity (% distance from EMA to trigger alerts).
Alerts
Alerts trigger once per bar when the price touches the 200 EMA within the defined sensitivity threshold.
Alert messages include:
Symbol / Current price / EMA value / EMA timeframe used / Chart timeframe / Timestamp
Customization
200 EMA Color: Change the line color for better visibility.
Touch Sensitivity: Fine-tune how close price must be to the EMA to count as a touch (default 0.1%).
Enable Touch Alerts: Turn on/off alert notifications easily.
For:
- Swing traders monitoring multiple stocks or assets.
- Day traders watching key EMA levels on different timeframes.
- Analysts requiring a quick visual and alert system for 200 EMA touches.
- Portfolio managers tracking key technical levels across various securities.
Limitations
Supports up to 20 configured symbols (can be extended manually if needed).
Works best on charts with reasonable bar frequency due to request.security usage.
Alert frequency is limited to once per bar for clarity.
Disclaimer
This indicator is provided “as-is” for educational and informational purposes only. It does not guarantee trading success or financial gain.

Consecutive Candles Above/Below EMADescription:
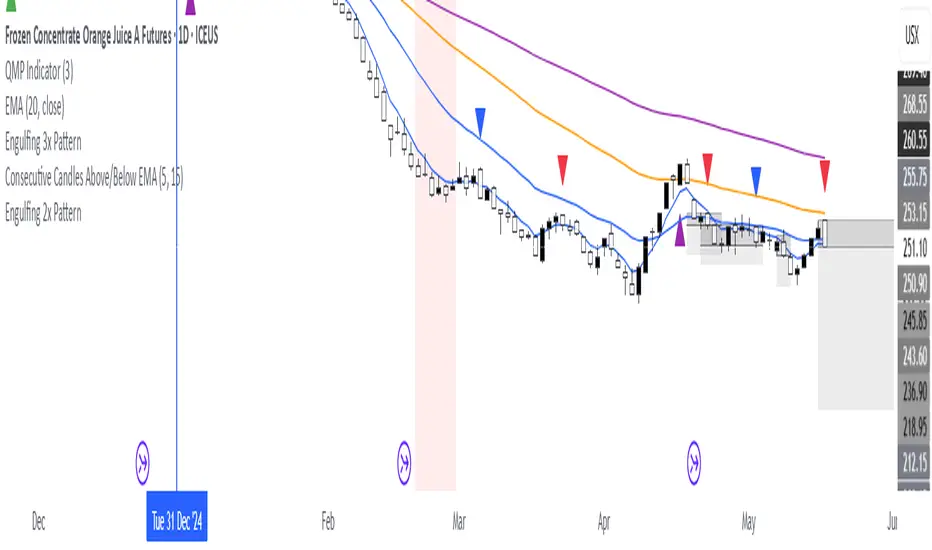
This indicator identifies and highlights periods where the price remains consistently above or below an Exponential Moving Average (EMA) for a user-defined number of consecutive candles. It visually marks these sustained trends with background colors and labels, helping traders spot strong bullish or bearish market conditions. Ideal for trend-following strategies or identifying potential trend exhaustion points, this tool provides clear visual cues for price behavior relative to the EMA.
How It Works:
EMA Calculation: The indicator calculates an EMA based on the user-specified period (default: 100). The EMA is plotted as a blue line on the chart for reference.
Consecutive Candle Tracking: It counts how many consecutive candles close above or below the EMA:
If a candle closes below the EMA, the "below" counter increments; any candle closing above resets it to zero.
If a candle closes above the EMA, the "above" counter increments; any candle closing below resets it to zero.
Highlighting Trends: When the number of consecutive candles above or below the EMA meets or exceeds the user-defined threshold (default: 200 candles):
A translucent red background highlights periods where the price has been below the EMA.
A translucent green background highlights periods where the price has been above the EMA.
Labeling: When the required number of consecutive candles is first reached:
A red downward arrow label with the text "↓ Below" appears for below-EMA streaks.
A green upward arrow label with the text "↑ Above" appears for above-EMA streaks.
Usage:
Trend Confirmation: Use the highlights and labels to confirm strong trends. For example, 200 candles above the EMA may indicate a robust uptrend.
Reversal Signals: Prolonged streaks (e.g., 200+ candles) might suggest overextension, potentially signaling reversals.
Customization: Adjust the EMA period to make it faster or slower, and modify the candle count to make the indicator more or less sensitive to trends.
Settings:
EMA Length: Set the period for the EMA calculation (default: 100).
Candles Count: Define the minimum number of consecutive candles required to trigger highlights and labels (default: 200).
Visuals:
Blue EMA line for tracking the moving average.
Red background for sustained below-EMA periods.
Green background for sustained above-EMA periods.
Labeled arrows to mark when the streak threshold is met.
This indicator is a powerful tool for traders looking to visualize and capitalize on persistent price trends relative to the EMA, with clear, customizable signals for market analysis.
Explain EMA calculation
Other trend indicators
Make description shorter
[SM-042] EMA 5-8-13 with ADX FilterWhat is the strategy?
The strategy combines three exponential moving averages (EMAs) — 5, 8, and 13 periods — with an optional ADX (Average Directional Index) filter. It is designed to enter long or short positions based on EMA crossovers and to exit positions when the price crosses a specific EMA. The ADX filter, if enabled, adds a condition that only allows trades when the ADX value is above a certain threshold, indicating trend strength.
Who is it for?
This strategy is for traders leveraging EMAs and trend strength indicators to make trade decisions. It can be used by anyone looking for a simple trend-following strategy, with the flexibility to adjust for trend strength using the ADX filter.
When is it used?
- **Long trades**: When the 5-period EMA crosses above the 8-period EMA, with an optional ADX condition (if enabled) that requires the ADX value to be above a specified threshold.
- **Short trades**: When the 5-period EMA crosses below the 8-period EMA, with the ADX filter again optional.
- **Exits**: The strategy exits a long position when the price falls below the 13-period EMA and exits a short position when the price rises above the 13-period EMA.
Where is it applied?
This strategy is applied on a chart with any asset on TradingView, with the EMAs and ADX plotted for visual reference. The strategy uses `strategy.entry` to open positions and `strategy.close` to close them based on the set conditions.
Why is it useful?
This strategy helps traders identify trending conditions and filter out potential false signals by using both EMAs (to capture short-term price movements) and the ADX (to confirm the strength of the trend). The ADX filter can be turned off if not desired, making the strategy flexible for both trending and range-bound markets.
How does it work?
- **EMA Crossover**: The strategy enters a long position when the 5-period EMA crosses above the 8-period EMA, and enters a short position when the 5-period EMA crosses below the 8-period EMA.
- **ADX Filter**: If enabled, the strategy checks whether the ADX value is above a set threshold (default is 20) before allowing a trade.
- **Exit Conditions**: Long positions are closed when the price falls below the 13-period EMA, and short positions are closed when the price rises above the 13-period EMA.
- **Plotting**: The strategy plots the three EMAs and the ADX value on the chart for visualization. It also displays a horizontal line at the ADX threshold.
This setup allows for clear decision-making based on the interaction between different time-frame EMAs and trend strength as indicated by ADX.

Adv EMA Cloud v6 (ADX, Alerts)Summary:
This indicator provides a multi-faceted view of market trends using Exponential Moving Averages (EMAs) arranged in visually intuitive clouds, enhanced with an optional ADX-based range filter and configurable alerts for key market conditions. It aims to help traders quickly gauge trend alignment across short, medium, and long timeframes while filtering signals during potentially choppy market conditions.
Key Features:
Multiple EMAs: Displays 10-period (Fast), 20-period (Mid), and 50-period (Slow) EMAs.
Long-Term Trend Filter: Includes a 200-period EMA to provide context for the overall dominant trend direction.
Dual EMA Clouds:
Fast/Mid Cloud (10/20 EMA): Fills the area between the 10 and 20 EMAs. Defaults to Green when 10 > 20 (bullish short-term momentum) and Red when 10 < 20 (bearish short-term momentum).
Mid/Slow Cloud (20/50 EMA): Fills the area between the 20 and 50 EMAs. Defaults to Aqua when 20 > 50 (bullish mid-term trend) and Fuchsia when 20 < 50 (bearish mid-term trend).
Optional ADX Range Filter: Uses the Average Directional Index (ADX) to identify potentially non-trending or choppy markets. When enabled and ADX falls below a user-defined threshold, the EMA clouds will turn grey, visually warning that trend-following signals may be less reliable.
Configurable Alerts: Provides several built-in alert conditions using Pine Script's alertcondition function:
Confluence Condition: Triggers when a 10/20 EMA crossover occurs while both EMA clouds show alignment (both bullish/green/aqua or both bearish/red/fuchsia) and price respects the 200 EMA filter and the ADX filter indicates a trend (if filters are enabled).
MA Filter Cross: Triggers when price crosses above or below the 200 EMA filter line.
Full Alignment Start: Triggers on the first bar where full bullish or bearish alignment occurs (both clouds aligned + MA filter respected + ADX trending, if filters are enabled).
How It Works:
EMA Calculation: Standard Exponential Moving Averages are calculated for the 10, 20, 50, and 200 periods based on the closing price.
Cloud Creation: The fill() function visually shades the area between the 10 & 20 EMAs and the 20 & 50 EMAs.
Cloud Coloring: The color of each cloud is determined by the relationship between the two EMAs that define it (e.g., if EMA 10 is above EMA 20, the first cloud is bullish-colored).
ADX Filter Logic: The script calculates the ADX value. If the "Use ADX Trend Filter?" input is checked and the calculated ADX is below the specified "ADX Trend Threshold", the script considers the market potentially ranging.
ADX Visual Effect: During detected ranging periods (if the ADX filter is active), the plotCloud12Color and plotCloud23Color variables are assigned a neutral grey color instead of their normal bullish/bearish colors before being passed to the fill() function.
Alert Logic: Boolean variables track the specific conditions (crossovers, cloud alignment, filter positions, ADX state). The alertcondition() function creates triggerable alerts based on these pre-defined conditions.
Potential Interpretation (Not Financial Advice):
Trend Alignment: When both clouds share the same directional color (e.g., both bullish - Green & Aqua) and price is on the corresponding side of the 200 EMA filter, it may suggest a stronger, more aligned trend. Conversely, conflicting cloud colors may indicate indecision or transition.
Dynamic Support/Resistance: The EMA lines themselves (especially the 20, 50, and 200) can sometimes act as dynamic levels where price might react.
Range Warning: Greyed-out clouds (when ADX filter is enabled) serve as a visual warning that trend-based strategies might face increased difficulty or whipsaws.
Confluence Alerts: The specific confluence alerts signal moments where multiple conditions align (crossover + cloud agreement + filters), which some traders might view as higher-probability setups.
Customization:
All EMA lengths (10, 20, 50, 200) are adjustable via the Inputs menu.
The ADX length and threshold are configurable.
The MA Trend Filter and ADX Trend Filter can be independently enabled or disabled.
Disclaimer:
This indicator is provided for informational and educational purposes only. Trading financial markets involves significant risk. Past performance is not indicative of future results. Always conduct your own thorough analysis and consider your risk tolerance before making any trading decisions. This indicator should be used in conjunction with other analysis methods and tools. Do not trade based solely on the signals or visuals provided by this indicator.

Supertrend and Fast and Slow EMA StrategyThis strategy combines Exponential Moving Averages (EMAs) and Average True Range (ATR) to create a simple, yet effective, trend-following approach. The strategy filters out fake or sideways signals by incorporating the ATR as a volatility filter, ensuring that trades are only taken during trending conditions. The key idea is to buy when the short-term trend (Fast EMA) aligns with the long-term trend (Slow EMA), and to avoid trades during low volatility periods.
How It Works:
EMA Crossover:
1). Buy Signal: When the Fast EMA (shorter-term, e.g., 20-period) crosses above the Slow EMA (longer-term, e.g., 50-period), this indicates a potential uptrend.
2). Sell Signal: When the Fast EMA crosses below the Slow EMA, this indicates a potential downtrend.
ATR Filter:
1). The ATR (Average True Range) is used to measure market volatility.
2). Trending Market: If the ATR is above a certain threshold, it indicates high volatility and a trending market. Only when ATR is above the threshold will the strategy generate buy/sell signals.
3). Sideways Market: If ATR is low (sideways or choppy market), the strategy will suppress signals to avoid entering during non-trending conditions.
When to Buy:
1). Condition 1: The Fast EMA crosses above the Slow EMA.
2). Condition 2: The ATR is above the defined threshold, indicating that the market is trending (not sideways or choppy).
When to Sell:
1). Condition 1: The Fast EMA crosses below the Slow EMA.
2). Condition 2: The ATR is above the defined threshold, confirming that the market is in a downtrend.
When Not to Enter the Trade:
1). Sideways Market: If the ATR is below the threshold, signaling low volatility and sideways or choppy market conditions, the strategy will not trigger any buy or sell signals.
2). False Crossovers: In low volatility conditions, price action tends to be noisy, which could lead to false signals. Therefore, avoiding trades during these periods reduces the risk of false breakouts.
Additional Factors to Consider Adding:
=> RSI (Relative Strength Index): Adding an RSI filter can help confirm overbought or oversold conditions to avoid buying into overextended moves or selling too low.
1). RSI Buy Filter: Only take buy signals when RSI is below 70 (avoiding overbought conditions).
2). RSI Sell Filter: Only take sell signals when RSI is above 30 (avoiding oversold conditions).
=> MACD (Moving Average Convergence Divergence): Using MACD can help validate the strength of the trend.
1). Buy when the MACD histogram is above the zero line and the Fast EMA crosses above the Slow EMA.
2). Sell when the MACD histogram is below the zero line and the Fast EMA crosses below the Slow EMA.
=> Support/Resistance Levels: Adding support and resistance levels can help you understand market structure and decide whether to enter or exit a trade.
1). Buy when price breaks above a significant resistance level (after a valid buy signal).
2). Sell when price breaks below a major support level (after a valid sell signal).
=> Volume: Consider adding a volume filter to ensure that buy/sell signals are supported by strong market participation. You could only take signals if the volume is above the moving average of volume over a certain period.
=> Trailing Stop Loss: Instead of a fixed stop loss, use a trailing stop based on a percentage or ATR to lock in profits as the trade moves in your favor.
=> Exit Signals: Besides the EMA crossover, consider adding Take Profit or Stop Loss levels, or even using a secondary indicator like RSI to signal an overbought/oversold condition and exit the trade.
Example Usage:
=> Buy Example:
1). Fast EMA (20-period) crosses above the Slow EMA (50-period).
2). The ATR is above the threshold, confirming that the market is trending.
3). Optionally, if RSI is below 70, the buy signal is further confirmed as not being overbought.
=> Sell Example:
1). Fast EMA (20-period) crosses below the Slow EMA (50-period).
2). The ATR is above the threshold, confirming that the market is trending.
3). Optionally, if RSI is above 30, the sell signal is further confirmed as not being oversold.
Conclusion:
This strategy helps to identify trending markets and filters out sideways or choppy market conditions. By using Fast and Slow EMAs combined with the ATR volatility filter, it provides a reliable approach to catching trending moves while avoiding false signals during low-volatility, sideways markets.

EMA Study Script for Price Action Traders, v2JR_EMA Research Tool Documentation
Version 2 Enhancements
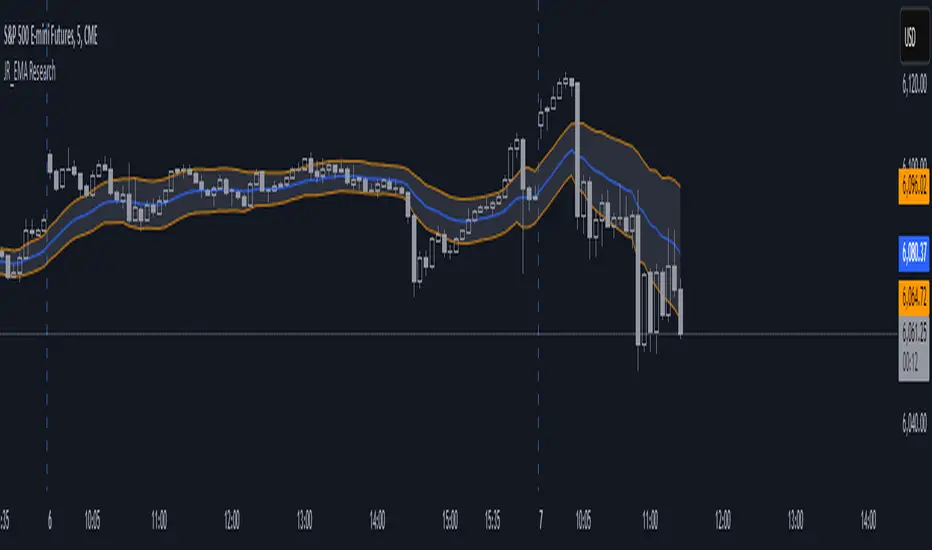
Version 2 of the JR_EMA Research Tool introduces several powerful features that make it particularly valuable for studying price action around Exponential Moving Averages (EMAs). The key improvements focus on tracking and analyzing price-EMA interactions:
1. Cross Detection and Counting
- Implements flags for crossing bars that instantly identify when price crosses above or below the EMA
- Maintains running counts of closes above and below the EMA
- This feature helps students understand the persistence of trends and the frequency of EMA interactions
2. Bar Number Tracking
- Records the specific bar number when EMA crosses occur
- Stores the previous crossing bar number for reference
- Enables precise measurement of time between crosses, helping identify typical trend durations
3. Variable Reset Management
- Implements sophisticated reset logic for all counting variables
- Ensures accuracy when analyzing multiple trading sessions
- Critical for maintaining clean data when studying patterns across different timeframes
4. Cross Direction Tracking
- Monitors the direction of the last EMA cross
- Helps students identify the current trend context
- Essential for understanding trend continuation vs reversal scenarios
Educational Applications
Price-EMA Relationship Studies
The tool provides multiple ways to study how price interacts with EMAs:
1. Visual Analysis
- Customizable EMA bands show typical price deviation ranges
- Color-coded fills help identify "normal" vs "extreme" price movements
- Three different band calculation methods offer varying perspectives on price volatility
2. Quantitative Analysis
- Real-time tracking of closes above/below EMA
- Running totals help identify persistent trends
- Cross counting helps understand typical trend duration
Research Configurations
EMA Configuration
- Adjustable EMA period for studying different trend timeframes
- Customizable EMA color for visual clarity
- Ideal for comparing different EMA periods' effectiveness
Bands Configuration
Three distinct calculation methods:
1. Full Average Bar Range (ABR)
- Uses the entire range of price movement
- Best for studying overall volatility
2. Body Average Bar Range
- Focuses on the body of the candle
- Excellent for studying conviction in price moves
3. Standard Deviation
- Traditional statistical approach
- Useful for comparing to other technical studies
Signal Configuration
- Optional signal plotting for entry/exit studies
- Helps identify potential trading opportunities
- Useful for backtesting strategy ideas
Using the Tool for Study
Basic Analysis Steps
1. Start with the default 20-period EMA
2. Observe how price interacts with the EMA line
3. Monitor the data window for quantitative insights
4. Use band settings to understand normal price behavior
Advanced Analysis
1. Pattern Recognition
- Use the cross counting system to identify typical pattern lengths
- Study the relationship between cross frequency and trend strength
- Compare different timeframes for fractal analysis
2. Volatility Studies
- Compare different band calculation methods
- Identify market regimes through band width changes
- Study the relationship between volatility and trend persistence
3. Trend Analysis
- Use the closing price count system to measure trend strength
- Study the relationship between trend duration and subsequent reversals
- Compare different EMA periods for optimal trend following
Best Practices for Research
1. Systematic Approach
- Start with longer timeframes and work down
- Document observations about price behavior in different market conditions
- Compare results across multiple symbols and timeframes
2. Data Collection
- Use the data window to record significant events
- Track the number of bars between crosses
- Note market conditions when signals appear
3. Optimization Studies
- Test different EMA periods for your market
- Compare band calculation methods for your trading style
- Document which settings work best in different market conditions
Technical Implementation Notes
This tool is particularly valuable for educational purposes because it combines visual and quantitative analysis in a single interface, allowing students to develop both intuitive and analytical understanding of price-EMA relationships.
EMA SHIFT & PARALLEL [n_dot]BINANCE:ETHUSDT.P
This strategy was developed for CRYPTO FUTURES, (the settings for ETHUSDT.P) . I aimed for the strategy to function in a live environment, so I focused on making its operation realistic:
When determining the position, only 80% (adjustable) of the available cash is invested to reduce the risk of position liquidation.
I account for a 0.05% commission, typical on the futures market, for each entry and exit.
Concept:
I modified a simple, well-known method: the crossover of two exponential moving averages (FAST, SLOW) generates the entry and exit signals.
I enhanced the base idea as follows:
For the fast EMA, I incorporated a multiplier (offset) to filter out market noise and focus only on strong signals.
I use different EMAs for long and short entry points; both have their own FAST and SLOW EMAs and their own offset. For longs, the FAST EMA is adjusted downward (<1), while for shorts, it is adjusted upward (>1). Consequently, the signal is generated when the modified FAST EMA crosses the SLOW EMA.
Risk Management:
The position includes the following components:
Separate stop-losses for long and short positions.
Separate trailers for long and short positions.
The strategy operates so that the entry point is determined by the EMA crossover, while the exit is governed only by the Stop Loss or Trailer. Optionally, it can be set to close the position at the EMA recrossing ("Close at Signal").
Trailer Operation:
An entry percentage and offset are defined. The trailer activates when the price surpasses the entry price, calculated automatically by the system.
The trailer closes the position when the price drops by the offset percentage from the highest reached price.
Example for trailer:
Purchase Price = 100
Trailer Enter = 5% → Activation Price = 105 (triggers trailer if market price crosses it).
Trailer Offset = 2%
If the price rises to 110, the exit price becomes 107.8.
If the price goes to 120, the exit price becomes 117.6.
If the price falls below 117.6, the trailer closes the position.
Settings:
Source: Determines the market price reference.
End Close: Closes positions at the end of the simulation to avoid "shadow positions" and provide an objective result.
Lot proportional to free cash (%): Only a portion of free cash is invested to meet margin requirements.
Plot Short, Plot Long: Simplifies displayed information by toggling indicator lines on/off.
Long Position (toggleable):
EMA Fast ws: Window size for FAST EMA.
EMA Slow ws: Window size for SLOW EMA.
EMA Fast down shift: Adjustment factor for FAST EMA.
Stop Loss long (%): Percent drop to close the position.
Trailer enter (%): Percent above the purchase price to activate the trailer.
Trailer offset (%): Percent drop to close the position.
Short Position (toggleable):
EMA Fast ws: Window size for FAST EMA.
EMA Slow ws: Window size for SLOW EMA.
EMA Fast up shift: Adjustment factor for FAST EMA.
Stop Loss short (%): Percent rise to close the position.
Trailer enter (%): Percent below the purchase price to activate the trailer.
Trailer offset (%): Percent rise to close the position.
Operational Framework:
If in a long position and a short EMA crossover occurs, the strategy closes the long and opens a short (flip).
If in a short position and a long EMA crossover occurs, the strategy closes the short and opens a long (flip).
A position can close in three ways:
Stop Loss
Trailer
Signal Recrossing
If none are active, the position remains open until the end of the simulation.
Observations:
Shifts significantly deviating from 1 increase overfitting risk. Recommended ranges: 0.96–0.99 (long) and 1.01–1.05 (short).
The strategy's advantage lies in risk management, crucial in leveraged futures markets. It operates with relatively low DrawDown.
Recommendations:
Bullish Market: Higher entry threshold (e.g., 6%) and larger offset (e.g., 3%).
Volatile/Sideways Market: Tighter parameters (e.g., 3%, 1%).
The method is stable, and minor parameter adjustments do not significantly impact results, helping assess overfitting: if small changes lead to drastic differences, the strategy is over-optimized.
EMA Settings: Adjust FAST and SLOW EMAs based on the asset's volatility and cyclicality.
On the crypto market, especially in the Futures market, short time periods (1–15 minutes) often show significant noise, making patterns/repetitions hard to identify. I recommend setting the interval to at least 1 hour.
I hope this contributes to your success!

IU EMA Channel StrategyIU EMA Channel Strategy
Overview:
The IU EMA Channel Strategy is a simple yet effective trend-following strategy that uses two Exponential Moving Averages (EMAs) based on the high and low prices. It provides clear entry and exit signals by identifying price crossovers relative to the EMAs while incorporating a built-in Risk-to-Reward Ratio (RTR) for effective risk management.
Inputs ( Settings ):
- RTR (Risk-to-Reward Ratio): Define the ratio for risk-to-reward (default = 2).
- EMA Length: Adjust the length of the EMA channels (default = 100).
How the Strategy Works
1. EMA Channels:
- High-based EMA: EMA calculated on the high price.
- Low-based EMA: EMA calculated on the low price.
The area between these two EMAs creates a "channel" that visually highlights potential support and resistance zones.
2. Entry Rules:
- Long Entry: When the price closes above the high-based EMA (crossover).
- Short Entry: When the price closes below the low-based EMA (crossunder).
These entries ensure trades are taken in the direction of momentum.
3. Stop Loss (SL) and Take Profit (TP):
- Stop Loss:
- For long positions, the SL is set at the previous bar's low.
- For short positions, the SL is set at the previous bar's high.
- Take Profit:
- TP is automatically calculated using the Risk-to-Reward Ratio (RTR) you define.
- Example: If RTR = 2, the TP will be 2x the risk distance.
4. Exit Rules:
- Positions are closed at either the stop loss or the take profit level.
- The strategy manages exits automatically to enforce disciplined risk management.
Visual Features
1. EMA Channels:
- The high and low EMAs are dynamically color-coded:
- Green: Price is above the EMA (bullish condition).
- Red: Price is below the EMA (bearish condition).
- The area between the EMAs is shaded for better visual clarity.
2. Stop Loss and Take Profit Zones:
- SL and TP levels are plotted for both long and short positions.
- Zones are filled with:
- Red: Stop Loss area.
- Green: Take Profit area.
Be sure to manage your risk and position size properly.

EMA TrendThe purpose of this script is to identify price trends based on EMAs. The relative position of price to specific EMAs and the position of certain EMAs towards each other are used to determine the trend direction. The script is intended for investors as a tool to define a basis for further evaluation. I do not use the script as a signal generator and would not recommend doing so without the help of additional indicators.
How to work with the script
The major (or long term) trend direction is determined by the 144 EMA much in the same way as the 200 MA is used in other systems. If the price is above the 144 EMA we are in a long term uptrend, below we are in a long term downtrend. This is to be taken with a grain of salt though. The 144 EMA is considerably shorter than the 200 SMA and is more prone to the price fluctuating around it during periods without a strong long term trend. I recommend using this as a confirmation for the short term trend.
The short term trend is derived from the position and slope of the price, the 21 EMA and the 55 EMA. If the price is above the 21 EMA, the 21 above the 55 EMA, both EMAs are sloping upwards and the distance between the two is increasing, we are talking about an uptrend (and vice versa for a downtrend). This is visualized by the color of the fill between the 144 EMA and close price. Green for uptrend, red for downtrend and no color for an undetermined trend.
The EMAs used are: 21 , 34 , 55 , 89 , 144 , 233 . Most of the EMAs are at 50 transparency to appear less dominant. For orientation, the 144 EMA is bright green to indicate its general importance for the trend determination, and the 55 EMAs is not transparent mainly to be able to identify positioning when the EMAs are close together.
Base time frame EMA
The 144 EMA is plotted twice where one is fixed to the daily time frame (can be configured) to be able to have the 144 on different timeframes during analysis. I find this very useful to keep the focus on my main time frame while analyzing trend on lower or higher time frames. This can also be turned off.
Configurability
This script is less configurable than I generally like with my other scripts. The reason is that the title attribute of the plots is not dynamic, and I use the data window often to get exact values from the script to determine buy targets for pullbacks and other things. Hence, I prefer not to have random names (or no names) in there to save mental capacity. If this ever becomes available, I'll gladly add this to this script. Till then, I encourage you to take the script and adjust it to your own needs. It should be simple enough even if you are just starting out in pine.

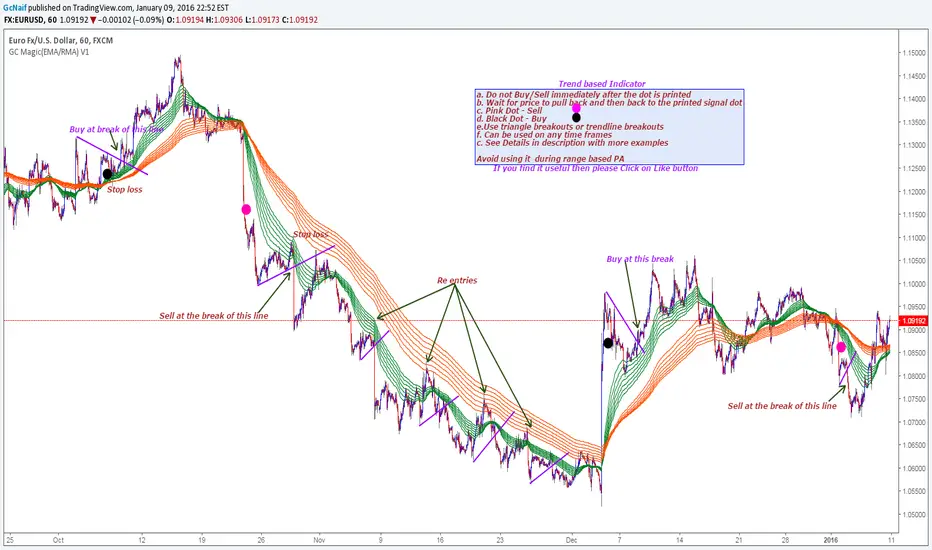
GC Magic(EMA/RMA) V1This is the second script I am posting on TV . This is a Trend based indicator with the option of using it as Exponential Moving Averages or Rsi Moving Averages.The RMA's are giving better signal than the Exponential Moving Averages. The script has the option to select either of them. Works on all time frames. The default options are working good on all time frames.
With the help of Indicator Properties following Options can be changed
a. Type of moving averages for using Guppy method
b. Option to use higher time frame Signal moving average of your choice along with higher time frame
c. Enable or disable to show signal EMA/RMA on chart .
d. Enable or disable to show Guppy EMA/RMA on chart
Indicator Properties:
1. Select to use EMA , Uncheck to use RMA: --> Check to Select EMA based Guppy or Uncheck to use RMA based Guppy
2. Fast EMA/RMA For Cross --> Fast EMA/RMA cross Length
3. Slow EMA/RMA For Cross --> Slow EMA/RMA Length
4. Signal EMA/RMA --> Moving average to use for Signal filters. This moving average will be based on the timeframe u will be selecting below
5. Time interval for Signal EMA/RMA (W, D, ) --> Which time frame moving average you want for the above Signal EMA
6. Do you want to use Signal EMA/RMA for Signals? --> Do you want to use Signal EMA as filter or just the cross of Guppy . Check to use and uncheck for just cross
7. Show Signal EMA on Chart? --> Do you want to display higher timeframe Signal EMA on chart
8. Show Guppy-Slow-Red On Chart? --> Shows/Hides Slow EMA/RMAs
9. Show Guppy-Fast-Green On Chart? --> Shows/Hides Fast EMA/RMAs
Examples:
GbpAud 15m
GbpNzd 1hr
Oil 4hr
AudUSD 1hr
Advanced MTF EMA Analyzer - Real-Time HTF📊 ADVANCED MTF EMA ANALYZER - REAL-TIME HTF
🎯 WHAT IS THIS INDICATOR?
This advanced multi-timeframe EMA indicator displays up to 9 different timeframe EMAs on a single chart with smooth, real-time updating lines. Unlike traditional MTF indicators that show stepped/choppy lines, this analyzer provides fluid, continuously updating EMA lines by calculating them at your current timeframe resolution.
✨ KEY FEATURES
• 9 TIMEFRAME SUPPORT: Track EMAs across 15m, 30m, 1h, 2h, 4h, 6h, 8h, 12h, and 1D
• SMOOTH LINES: No more stepped/choppy higher timeframe lines - every candle updates smoothly
• REAL-TIME CALCULATION: Uses lookahead methodology to provide live HTF data on lower timeframes
• CUSTOMIZABLE EMA PERIOD: Choose any EMA length (default: 200)
• DISTANCE TABLE: Shows exact distance from price to each EMA in percentage terms
• SELECTIVE DISPLAY: Toggle any timeframe on/off individually
• COLOR-CODED: Each timeframe has a unique color for easy identification
🔧 HOW IT WORKS
The indicator fetches close prices from higher timeframes and applies EMA calculation on your current timeframe. For example, when viewing a 5-minute chart:
- 1 hour = 12 candles of 5m data
- 4 hours = 48 candles of 5m data
- Each 5m candle recalculates the EMA, creating smooth, fluid lines
This approach eliminates the traditional "stepped" appearance of higher timeframe indicators while maintaining accurate trend representation.
📋 DASHBOARD INFORMATION
The built-in table displays:
- Current price
- EMA values for each selected timeframe
- Percentage distance from price to each EMA
- Green (above EMA) / Red (below EMA) color coding
🎨 COLOR SCHEME
White: Current Timeframe | Yellow: 15m | Orange: 30m
Blue: 1h | Light Blue: 2h | Purple: 4h
Pink: 6h | Dark Purple: 8h | Dark Orange: 12h
Red: 1 Day
💡 BEST USE CASES
✓ Identifying multi-timeframe trend alignment
✓ Finding dynamic support/resistance levels
✓ Spotting trend strength across different periods
✓ Making better entry/exit decisions based on multiple timeframes
✓ Ideal for 5-minute charts with higher timeframe context
⚠️ DISCLAIMER
This indicator is for educational and informational purposes only. It should not be considered financial advice. Trading involves substantial risk of loss and is not suitable for everyone. Past performance does not guarantee future results. The use of "lookahead" functionality means this indicator may repaint historical values. Always perform your own analysis and consult with a qualified financial advisor before making trading decisions.
═══════════════════════════════════════════════════════════════
👍 DID YOU FIND THIS USEFUL?
If this indicator helps your trading analysis, please consider:
⭐ LIKE this indicator
💬 LEAVE A COMMENT with your feedback
👥 FOLLOW for more quality indicators and updates
📧 CONTACT for suggestions, bug reports, or feature requests
Your support and feedback help improve this tool for the entire community!
═══════════════════════════════════════════════════════════════
📌 VERSION: 1.0
📅 RELEASE: 2026
🔄 UPDATES: Follow for notifications on new features and improvements
Thank you for using Advanced MTF EMA Analyzer!

Daily/Weekly EMAs on Lower TimeframesThis indicator allows traders to view Daily and Weekly EMAs (Exponential Moving Averages) directly on lower timeframes such as 1m, 5m, 15m, or 1h charts — providing a higher timeframe perspective without switching charts.
The script includes individual checkboxes for each EMA length — 5, 8, 9, 21, 50, and 200 — organized into two clear sections:
🟢 Daily EMAs
🔵 Weekly EMAs
You can selectively enable or disable any EMA to match your trading style and reduce chart clutter.
Each EMA is color-coded for clarity and consistency:
5 EMA: Green
8 EMA: Blue
9 EMA: Blue
21 EMA: Orange
50 EMA: Purple
200 EMA: Red
Weekly EMAs appear slightly transparent to distinguish them from daily ones.
This makes it easy to visualize higher timeframe trend direction, confluence zones, and dynamic support/resistance levels while trading intraday.
💡 Key Features
View Daily and Weekly EMAs on smaller timeframes.
Individual checkbox toggles for all 6 EMA lengths.
Separate sections for Daily and Weekly EMAs.
Color-coded lines for easy visual recognition.
Works seamlessly on any symbol or timeframe below Daily.

EMA with time-interval dependant visiblity settingThis scrip exposes 4 Exponential Moving Average (EMA) indicators which their visibility can be set to a daily or weekly time-frame (aka intervals). Based on your current chart time-frame, the matching EMA indicators come on and off.
This helps to have meaningful EMAs relevant to your time internal.
In a traditional 10 EMA indicates a plotted indicator would bear a meaning of a 10 day EMA when in daily and 10 week EMA when in weekly chart which may or may not be useful as some who for example only require a 10 week EMA for thier analysis and wouldn't want to cloud a daily chart with an EMA which won't resemble a valuable output for this particular user.
With EMA+, you can choose to see the 10 week EMA only when your chart is in the weekly time interval, so when switched to a daily interval a 10x EMA is not shown anymore.
If you prefer to see a 10 week EMA and a 21 day EMA on the other hand, you will only have 1 EMA shown when in weekly mode which is a 10 week EMA and one EMA when in daily mode with is 21 day EMA.

MFI + RSI + EMA Dynamic SignalsThe MFI + RSI + EMA Dynamic Signals is a designed to combine with widened criteria to capture more trading opportunities, it balances momentum, trend, and flexibility, making it suitable for trading on timeframes like 15-minute to 4-hour charts.
How It Works
The indicator uses three technical components with relaxed criteria to produce signals:
Money Flow Index (MFI) for Momentum Extremes:
The MFI, calculated over a 14-period length, measures buying and selling pressure using price and volume. A buy signal can trigger when MFI crosses above the oversold level (default: 30, widened from 20), indicating potential buying pressure, while a sell signal can occur when MFI crosses below the overbought level (default: 70, widened from 80), suggesting selling pressure.
Relative Strength Index (RSI) for Momentum Confirmation:
The RSI, calculated over a 14-period length, confirms momentum strength. Bullish momentum is confirmed when RSI is above a buy threshold (default: 45, relaxed from 50), and bearish momentum when below a sell threshold (default: 55, relaxed from 50), allowing more signals near neutral momentum levels.
Exponential Moving Average (EMA) for Trend Sensitivity:
The indicator uses a fast EMA (default: 9 periods) and a slow EMA (default: 21 periods) to detect trend direction and crossovers. Signals can trigger when the fast EMA crosses the slow EMA, or when the fast EMA is within a proximity threshold (default: 0.5%) of the slow EMA, capturing early trend changes and increasing signal frequency.
Signal Generation
Signals are generated using the previous bar’s values to prevent repainting, with widened criteria for more frequent triggers:
Buy Signal: Either the MFI crosses above the oversold level or the fast EMA crosses above the slow EMA, and either RSI confirms bullish momentum (above 45) or the EMAs are near a crossover (within 0.5%). Displayed as a green upward triangle below the bar.
Sell Signal: Either the MFI crosses below the overbought level or the fast EMA crosses below the slow EMA, and either RSI confirms bearish momentum (below 55) or the EMAs are near a crossover (within 0.5%). Displayed as a red downward triangle above the bar.

EMA Pullback Speed Strategy 📌 **Overview**
The **EMA Pullback Speed Strategy** is a trend-following approach that combines **price momentum** and **Exponential Moving Averages (EMA)**.
It aims to identify high-probability entry points during brief pullbacks within ongoing uptrends or downtrends.
The strategy evaluates **speed of price movement**, **relative position to dynamic EMA**, and **candlestick patterns** to determine ideal timing for entries.
One of the key concepts is checking whether the price has **“not pulled back too much”**, helping focus only on situations where the trend is likely to continue.
⚠️ This strategy is designed for educational and research purposes only. It does not guarantee future profits.
🧭 **Purpose**
This strategy addresses the common issue of **"jumping in too late during trends and taking unnecessary losses."**
By waiting for a healthy pullback and confirming signs of **trend resumption**, traders can enter with greater confidence and reduce false entries.
🎯 **Strategy Objectives**
* Enter in the direction of the prevailing trend to increase win rate
* Filter out false signals using pullback depth, speed, and candlestick confirmations
* Predefine Take-Profit (TP) and Stop-Loss (SL) levels for safer, rule-based trading
✨ **Key Features**
* **Dynamic EMA**: Reacts faster when price moves quickly, slower when market is calm – adapting to current momentum
* **Pullback Filter**: Avoids trades when price pulls back too far (e.g., more than 5%), indicating a trend may be weakening
* **Speed Check**: Measures how strongly the price returns to the trend using candlestick body speed (open-to-close range in ticks)
📊 **Trading Rules**
**■ Long Entry Conditions:**
* Current price is above the dynamic EMA (indicating uptrend)
* Price has pulled back toward the EMA (a "buy the dip" situation)
* Pullback depth is within the threshold (not excessive)
* Candlesticks show consecutive bullish closes and break the previous high
* Price speed is strong (positive movement with momentum)
**■ Short Entry Conditions:**
* Current price is below the dynamic EMA (indicating downtrend)
* Price has pulled back up toward the EMA (a "sell the rally" setup)
* Pullback is within range (not too deep)
* Candlesticks show consecutive bearish closes and break the previous low
* Price speed is negative (downward momentum confirmed)
**■ Exit Conditions (TP/SL):**
* **Take-Profit (TP):** Fixed 1.5% target above/below entry price
* **Stop-Loss (SL):** Based on recent price volatility, calculated using ATR × 4
💰 **Risk Management Parameters**
* Symbol & Timeframe: BTCUSD on 1-hour chart (H1)
* Test Capital: \$3000 (simulated account)
* Commission: 0.02%
* Slippage: 2 ticks (minimal execution lag)
* Max risk per trade: 5% of account balance
* Backtest Period: Aug 30, 2023 – May 9, 2025
* Profit Factor (PF): 1.965 (Net profit ÷ Net loss, including spreads & fees)
⚙️ **Trading Parameters & Indicator Settings**
* Maximum EMA Length: 50
* Accelerator Multiplier: 3.0
* Pullback Threshold: 5.0%
* ATR Period: 14
* ATR Multiplier (SL distance): 4.0
* Fixed TP: 1.5%
* Short-term EMA: 21
* Long-term EMA: 50
* Long Speed Threshold: ≥ 1000.0 (ticks)
* Short Speed Threshold: ≤ -1000.0 (ticks)
⚠️Adjustments are based on BTCUSD.
⚠️Forex and other currency pairs require separate adjustments.
🔧 **Strategy Improvements & Uniqueness**
Unlike basic moving average crossovers or RSI triggers, this strategy emphasizes **"momentum-supported pullbacks"**.
By combining dynamic EMA, speed checks, and candlestick signals, it captures trades **as if surfing the wave of a trend.**
Its built-in filters help **avoid overextended pullbacks**, which often signal the trend is ending – making it more robust than traditional trend-following systems.
✅ **Summary**
The **EMA Pullback Speed Strategy** is easy to understand, rule-based, and highly reproducible – ideal for both beginners and intermediate traders.
Because it shows **clear visual entry/exit points** on the chart, it’s also a great tool for practicing discretionary trading decisions.
⚠️ Past performance is not a guarantee of future results.
Always respect your Stop-Loss levels and manage your position size according to your risk tolerance.

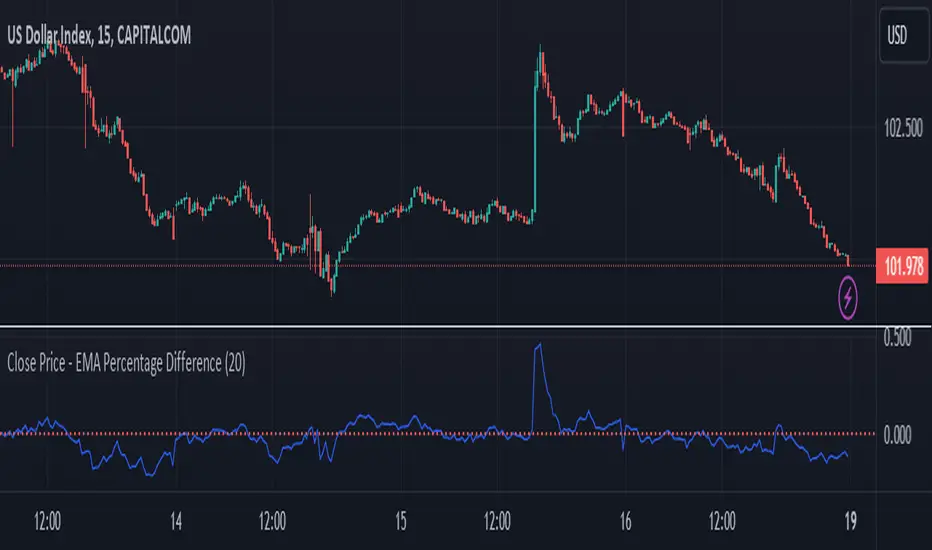
Close Price - EMA Percentage Difference
Title: Close Price - EMA Percentage Difference Indicator
Description:
The Close Price - EMA Percentage Difference Indicator is an essential tool designed to calculate and display the percentage difference between the closing price of a security and its Exponential Moving Average (EMA). This indicator is particularly useful for traders and analysts who want to understand how far the current price is from its EMA, providing insights into potential price trends and reversals.
Key Features:
Customizable EMA Period: Easily adjust the EMA period to match your trading strategy. Whether you're focusing on short-term trends with a 20-period EMA or analyzing long-term trends with a 200-period EMA, this indicator is flexible to suit your needs.
Percentage Difference Calculation: The indicator computes the percentage difference between the closing price and the selected EMA, allowing you to see how much the current price deviates from its moving average in percentage terms. This calculation helps in identifying potential buying or selling opportunities based on price movements relative to the EMA.
Zero Line Reference: A dotted red line at the zero level is included for quick visual reference. This line helps you instantly identify when the closing price is equal to the EMA, and whether the price is above or below the EMA.
Visual Representation: The percentage difference is plotted on a separate panel below the price chart, providing a clear and intuitive visualization that aids in decision-making.
How to Use:
Adjust the EMA period to fit your analysis or trading strategy.
Observe the percentage difference to understand the strength of the current price in relation to the EMA.
Use the zero line as a reference point to determine whether the price is above (positive values) or below (negative values) the EMA, which can help in identifying overbought or oversold conditions.
This indicator is suitable for all types of traders, from day traders to long-term investors, offering valuable insights into the price dynamics relative to the EMA.
Multi-Timeframe EMA Distance & % Change TableDescription of Multi-Timeframe EMA Distance & % Change Table
The Multi-Timeframe EMA Distance & % Change Table indicator is designed to display the distance and percentage change between the current price and the Exponential Moving Averages (EMAs) on multiple timeframes. It creates a table to show these values, with customizable options for decimal precision .
Key Features:
Inputs:
- Timeframes (tf1, tf2, tf3, tf4): User-defined timeframes for EMA calculations (e.g., 1 minute, 15 minutes, daily, etc.).
- EMA Levels (emaLevel, emaLevel2, emaLevel3): User-defined periods for three different EMAs.
EMA Calculations:
- Computes EMAs for the specified levels (50, 100, 200) on each of the user-selected timeframes.
Plotting:
- Plots the EMAs on the chart with distinct colors: Orange, Teal, and Green for different EMAs.
Display Options:
- Checkbox (displayAsPercentage): Allows the user to toggle between displaying distances or percentage changes.
- Decimal Precision:
- decimalPlacesDistance: Specifies the number of decimal places for rounded distance values.
- decimalPlacesPercentage: Specifies the number of decimal places for rounded percentage values.
Table Creation:
- Location: Table is placed in the top-right corner of the chart.
- Headers: Includes columns for each timeframe and EMA distance/percentage.
Distance and Percentage Calculations:
- Distances: Calculated as the difference between the current price and the EMA values for each timeframe.
- Percentages: Calculated as the distance divided by the EMA value, converted to a percentage.
Decimal Rounding:
- Custom Rounding Function: Ensures that distance and percentage values are displayed with the user-specified number of decimal places.
Color Coding:
- Distance Values: Colored green if positive, red if negative.
- Table Entries: Display either the rounded distance or percentage, based on user selection.
Table Update:
- The table is dynamically updated with either distance or percentage values based on the user's choice and rounded to the specified number of decimal places.
This indicator provides a comprehensive overview of EMA distances and percentage changes across multiple timeframes, with detailed control over the precision of the displayed values.

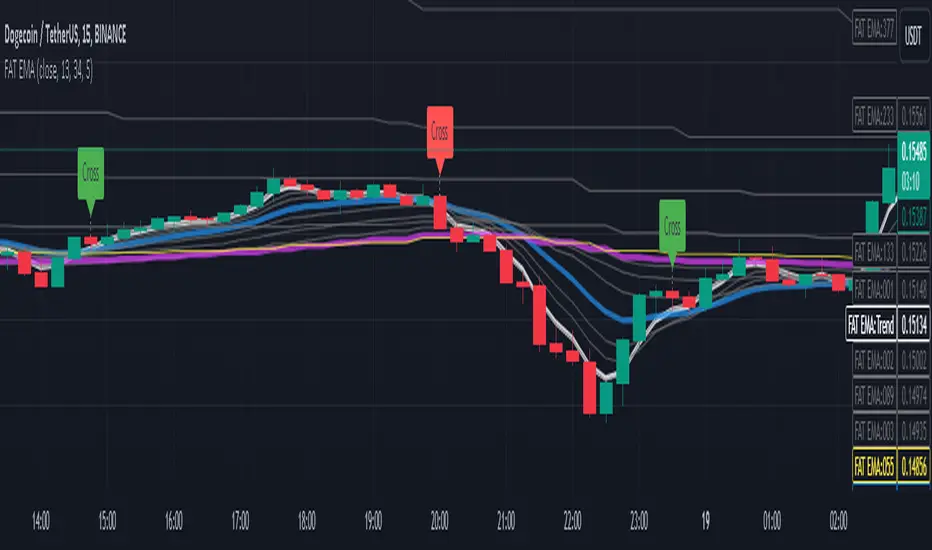
Fibonacci Adaptive Timeframe EMA (FAT EMA)The "Fibonacci Adaptive Timeframe EMA" is a sophisticated trading indicator designed for the TradingView platform, leveraging the power of Exponential Moving Averages (EMAs) determined by Fibonacci sequence lengths to provide traders with dynamic market insights. This indicator overlays directly on the price chart, offering a unique blend of trend analysis, smoothing techniques, and timeframe adaptability, making it an invaluable tool for traders looking to enhance their technical analysis strategy.
Key Features
1. Fibonacci-Based EMA Lengths: Utilizes the Fibonacci sequence to select EMA lengths, incorporating natural mathematical ratios believed to be significant in financial markets. The available lengths range from 1 to 987, allowing for detailed trend analysis over various periods.
2. Multiple Smoothing Methods: Offers the choice between several smoothing techniques, including Simple Moving Average (SMA), Exponential Moving Average (EMA), Smoothed Moving Average (SMMA or RMA), Weighted Moving Average (WMA), and Volume Weighted Moving Average (VWMA). This versatility ensures that users can tailor the indicator to suit their analytical preferences.
3. Timeframe Adaptability: Features the ability to fetch and calculate EMAs from different timeframes, providing a multi-timeframe analysis within a single chart view. This adaptability gives traders a broader perspective on market trends, enabling more informed decision-making.
4. Dynamic Visualization Options: Traders can customize the display to suit their analysis needs, including toggling the visibility of Fibonacci EMA lines, EMA prices, and smoothed EMA lines. Additionally, forecast lines can be projected into the future, offering speculative insights based on current trends.
5. Ema Tail Visualization: An innovative feature allowing for the visualization of the 'tail' or the continuation of EMA lines, which can be particularly useful for identifying trend persistence or reversal points.
6. User-friendly Customization: Through a series of input options, traders can easily adjust the source data, Fibonacci lengths, smoothing method, and visual aspects such as line colors and transparency, ensuring a seamless integration into any trading strategy.
Application and Use Cases
The "Fibonacci Adaptive Timeframe EMA" indicator is designed for traders who appreciate the significance of Fibonacci numbers in market analysis and seek a flexible tool to analyze trends across different timeframes. Whether it's for scalping, day trading, or long-term investing, this indicator can provide valuable insights into price dynamics, trend strengths, and potential reversal points. Its adaptability makes it suitable for various asset classes, including stocks, forex, commodities, and cryptocurrencies.
Fibonacci Timeframe Adaptive EMAThe "Fibonacci Timeframe Adaptive EMA" is a sophisticated trading indicator designed for the TradingView platform, leveraging the power of Exponential Moving Averages (EMAs) determined by Fibonacci sequence lengths to provide traders with dynamic market insights. This indicator overlays directly on the price chart, offering a unique blend of trend analysis, smoothing techniques, and timeframe adaptability, making it an invaluable tool for traders looking to enhance their technical analysis strategy.
Key Features
1. Fibonacci-Based EMA Lengths: Utilizes the Fibonacci sequence to select EMA lengths, incorporating natural mathematical ratios believed to be significant in financial markets. The available lengths range from 1 to 987, allowing for detailed trend analysis over various periods.
2. Multiple Smoothing Methods: Offers the choice between several smoothing techniques, including Simple Moving Average (SMA), Exponential Moving Average (EMA), Smoothed Moving Average (SMMA or RMA), Weighted Moving Average (WMA), and Volume Weighted Moving Average (VWMA). This versatility ensures that users can tailor the indicator to suit their analytical preferences.
3. Timeframe Adaptability: Features the ability to fetch and calculate EMAs from different timeframes, providing a multi-timeframe analysis within a single chart view. This adaptability gives traders a broader perspective on market trends, enabling more informed decision-making.
4. Dynamic Visualization Options: Traders can customize the display to suit their analysis needs, including toggling the visibility of Fibonacci EMA lines, EMA prices, and smoothed EMA lines. Additionally, forecast lines can be projected into the future, offering speculative insights based on current trends.
5. Ema Tail Visualization: An innovative feature allowing for the visualization of the 'tail' or the continuation of EMA lines, which can be particularly useful for identifying trend persistence or reversal points.
6. User-friendly Customization: Through a series of input options, traders can easily adjust the source data, Fibonacci lengths, smoothing method, and visual aspects such as line colors and transparency, ensuring a seamless integration into any trading strategy.
Application and Use Cases
The "Fibonacci Timeframe Adaptive EMA" indicator is designed for traders who appreciate the significance of Fibonacci numbers in market analysis and seek a flexible tool to analyze trends across different timeframes. Whether it's for scalping, day trading, or long-term investing, this indicator can provide valuable insights into price dynamics, trend strengths, and potential reversal points. Its adaptability makes it suitable for various asset classes, including stocks, forex, commodities, and cryptocurrencies.

Long EMA Strategy with Advanced Exit OptionsThis strategy is designed for traders seeking a trend-following system with a focus on precision and adaptability.
**Core Strategy Concept**
The essence of this strategy lies in use of Exponential Moving Averages (EMAs) to identify potential long (buy) positions based on the relative positions of short-term, medium-term, and long-term EMAs. The use of EMAs is a classic yet powerful approach to trend detection, as these indicators smooth out price data over time, emphasizing the direction of recent price movements and potentially signaling the beginning of new trends.
**Customizable Parameters**
- **EMA Periods**: Users can define the periods for three EMAs - long-term, medium-term, and short-term - allowing for a tailored approach to capture trends based on individual trading styles and market conditions.
- **Volatility Filter**: An optional Average True Range (ATR)-based volatility filter can be toggled on or off. When activated, it ensures that trades are only entered when market volatility exceeds a user-defined threshold, aiming to filter out entries during low-volatility periods which are often characterized by indecisive market movements.
- **Trailing Stop Loss**: A trailing stop loss mechanism, expressed as a percentage of the highest price achieved since entry, provides a dynamic way to manage risk by allowing profits to run while cutting losses.
- **EMA Exit Condition**: This advanced exit option enables closing positions when the short-term EMA crosses below the medium-term EMA, serving as a signal that the immediate trend may be reversing.
- **Close Below EMA Exit**: An additional exit condition, which is disabled by default, allows positions to be closed if the price closes below a user-selected EMA. This provides an extra layer of flexibility and risk management, catering to traders who prefer to exit positions based on specific EMA thresholds.
**Operational Mechanics**
Upon activation, the strategy evaluates the current price in relation to the set EMAs. A long position is considered when the current price is above the long-term EMA, and the short-term EMA is above the medium-term EMA. This setup aims to identify moments where the price momentum is strong and likely to continue.
The strategy's versatility is further enhanced by its optional settings:
- The **Volatility Filter** adjusts the sensitivity of the strategy to market movements, potentially improving the quality of the entries during volatile market conditions.
The Average True Range (ATR) is a key component of this filter, providing a measure of market volatility by calculating the average range between the high and low prices over a specified number of periods. Here's how you can adjust the volatility filter settings for various market conditions, focusing on filtering out low-volatility markets:
Setting Examples for Volatility Filter
1. High Volatility Markets (e.g., Cryptocurrencies, Certain Forex Pairs):
ATR Periods: 14 (default)
ATR Multiplier: Setting the multiplier to a lower value, such as 1.0 or 1.2, can be beneficial in high-volatility markets. This sensitivity allows the strategy to react to volatility changes more quickly, ensuring that you're entering trades during periods of significant movement.
2. Medium Volatility Markets (e.g., Major Equity Indices, Medium-Volatility Forex Pairs):
ATR Periods: 14 (default)
ATR Multiplier: A multiplier of 1.5 (default) is often suitable for medium volatility markets. It provides a balanced approach, ensuring that the strategy filters out low-volatility conditions without being overly restrictive.
3. Low Volatility Markets (e.g., Some Commodities, Low-Volatility Forex Pairs):
ATR Periods: Increasing the ATR period to 20 or 25 can smooth out the volatility measure, making it less sensitive to short-term fluctuations. This adjustment helps in focusing on more significant trends in inherently stable markets.
ATR Multiplier: Raising the multiplier to 2.0 or even 2.5 increases the threshold for volatility, effectively filtering out low-volatility conditions. This setting ensures that the strategy only triggers trades during periods of relatively higher volatility, which are more likely to result in significant price movements.
How to Use the Volatility Filter for Low-Volatility Markets
For traders specifically interested in filtering out low-volatility markets, the key is to adjust the ATR Multiplier to a higher level. This adjustment increases the threshold required for the market to be considered sufficiently volatile for trade entries. Here's a step-by-step guide:
Adjust the ATR Multiplier: Increase the ATR Multiplier to create a higher volatility threshold. A multiplier of 2.0 to 2.5 is a good starting point for very low-volatility markets.
Fine-Tune the ATR Periods: Consider lengthening the ATR calculation period if you find that the strategy is still entering trades in undesirable low-volatility conditions. A longer period provides a more averaged-out measure of volatility, which might better suit your needs.
Monitor and Adjust: Volatility is not static, and market conditions can change. Regularly review the performance of your strategy in the context of current market volatility and adjust the settings as necessary.
Backtest in Different Conditions: Before applying the strategy live, backtest it across different market conditions with your adjusted settings. This process helps ensure that your approach to filtering low-volatility conditions aligns with your trading objectives and risk tolerance.
By fine-tuning the volatility filter settings according to the specific characteristics of the market you're trading in, you can enhance the performance of this strategy
- The **Trailing Stop Loss** and **EMA Exit Conditions** provide two layers of exit strategies, focusing on capital preservation and profit maximization.
**Visualizations**
For clarity and ease of use, the strategy plots the three EMAs and, if enabled, the ATR threshold on the chart. These visual cues not only aid in decision-making but also help in understanding the market's current trend and volatility state.
**How to Use**
Traders can customize the EMA periods to fit their trading horizon, be it short, medium, or long-term trading. The volatility filter and exit options allow for further customization, making the strategy adaptable to different market conditions and personal risk tolerance levels.
By offering a blend of trend-following principles with advanced risk management features, this strategy aims to cater to a wide range of trading styles, from cautious to aggressive. Its strength lies in its flexibility, allowing traders to fine-tune settings to their specific needs, making it a potentially valuable tool in the arsenal of any trader looking for a disciplined approach to navigating the markets.

EMA Buy/Sell & Smart Zones(5Min TF only)### **Indicator Title:**
**EMA Buy/Sell & Smart Zones**
---
### **Description:**
**EMA Buy/Sell & Smart Zones** is a specialized intraday trading tool designed to combine trend analysis with precise market structure zones. This script utilizes a custom tracking algorithm to identify the **specific candle** that formed the previous session's high or low, allowing it to plot accurate Supply and Demand zones for the current trading day.
This indicator has been rigorously tested on the **Nifty Index** and is optimized for use on the **5-minute timeframe**.
### **Key Features**
**1. Smart Session Wick Zones ("True Wick" Logic)**
The indicator automatically scans every candle of the previous session to locate the exact price action that formed the day's extremes.
* **Smart High Zone:** Identifies the specific candle that made yesterday's High and plots a zone from that High down to that candle's Open or Close (based on body direction).
* **Smart Low Zone:** Identifies the specific candle that made yesterday's Low and plots a zone from that Low up to that candle's Open or Close.
* **Close Range:** Highlights the High-Low range of the very last candle of the previous session to show the closing sentiment.
*All zones automatically stop extending at the end of the current session, ensuring the chart remains clean and historically accurate.*
**2. EMA Trend System**
The script plots three key Exponential Moving Averages to define market direction:
* **EMA 21:** Captures short-term momentum.
* **EMA 63:** Defines the medium-term trend.
* **EMA 1575:** Establishes the long-term baseline.
**3. Buy/Sell Signals**
Clear signals are generated on the chart based on specific criteria:
* **BUY Signal:** Generated when a green candle closes above the EMA 21 and EMA 63.
* **SELL Signal:** Generated when a red candle closes below the EMA 21 and EMA 63.
* *Note: The logic includes a filter to alternate signals (Buy -> Sell -> Buy), preventing clutter during choppy markets.*
### **How to Use**
* **Recommended Timeframe:** **5 Minutes**.
* **Recommended Markets:** Indices (Nifty, Bank Nifty) and high-volume stocks.
* **Workflow:**
* Use the **Smart Zones** (Red/Green boxes) to identify potential rejection areas or breakout targets.
* Use the **Buy/Sell Labels** as confirmation triggers when price is reacting near these zones or trending strongly above/below the EMAs.
### **Settings & Customization**
* **Visibility Control:** Toggle each box type (High, Low, Close) and text labels on or off individually.
* **Color Customization:** Fully adjustable colors for all EMAs, Zone Backgrounds, Borders, and Text Labels to suit your chart theme.
* **Label Size:** Adjust the text size of the zone labels directly from the settings menu.
---
**Disclaimer:** This tool is for educational purposes and should be used to assist your analysis. Always manage your risk appropriately.
