ADX EMA's DistanceIt is well known to technical analysts that the price of the most volatile and traded assets do not tend to stay in the same place for long. A notable observation is the recurring pattern of moving averages that tend to move closer together prior to a strong move in some direction to initiate the trend, it is precisely that distance that is measured by the blue ADX EMA's Distance lines on the chart, normalized and each line being the distance between 2, 3 or all 4 moving averages, with the zero line being the point where the distance between them is zero, but it is also necessary to know the direction of the movement, and that is where the modified ADX will be useful.
This is the well known Directional Movement Indicator (DMI), where the +DI and -DI lines of the ADX will serve to determine the direction of the trend.
Cari dalam skrip untuk "ema"

POC-Candle-EMA-ATR-LongShadow-50percCandleThis is a script for those who trade based on volume and smart money strategies.
Some of the features of this script:
- Display "Time Price Opportunity Chart". These points help traders to identify price opportunities over time and have a better analysis of the market.
- Mark candles that have traded more volume than previous candles.
- Mark candles whose body is at least and not more than 50% of the total candle size, these candles can be found more easily in smart money strategies.
- Mark spike candles to find FVG faster
- Mark candles that have a shadow of at least more than 380 points and can be good reversal points.
- EMA indicator to check the market trend
- DonchianChannel indicator to check the price trend on the chart
Regards

EMA 08:00// Some traders prefer to start the charts at 8am in the morning.
// This chart setting is not possible as of today, but the following script lets you calculate ema for a defined time range.
// Right now it is set to include bars from 08:00 to 23:59, meaning that early pre market 04:00 to 07:59 is left out.

EMA + Bullish Engulfing Candle Pattern StrategyHello Guys! Nice to meet you all!
This is my first open source script!
### Long Condition
1. Bullish Engulfing Candle
2. No doge Candle
3. Present volume should be bigger than the previous volume (20%)
4. Trend filter (with 2 EMAs)
### Close Condition
1. When trend Changes
2. When Bearish Engulfing Candle appears
###
No stop loss and take profit.

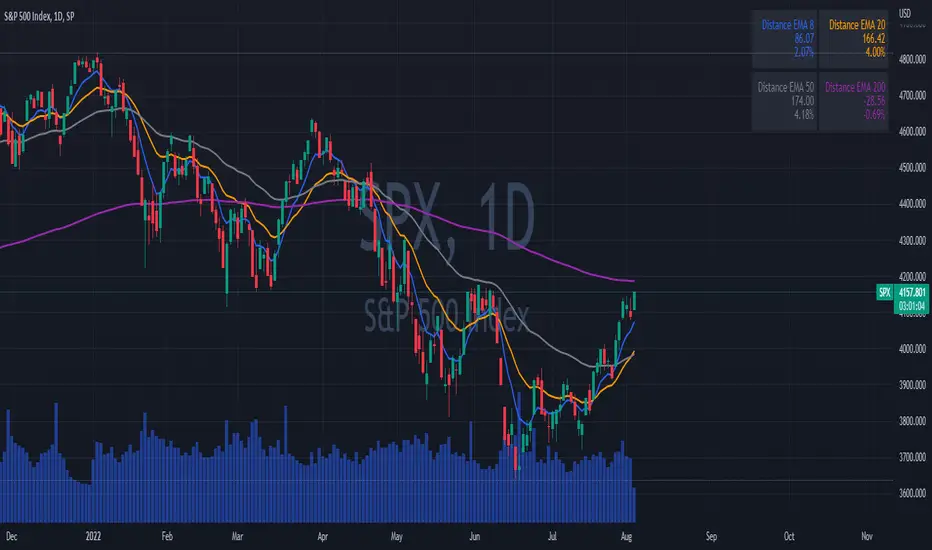
EMAs DistancesThis indicator shows 4 configurable EMAs and the distances (values and percentages) to the last price of the stock, etf or index.
Macro EMA Correlation
This script is useful to see correlation between macroeconomic assets, displayed in different ema line shown in percentage to compare these assets on the same basis. Percentage will depend on the time frame selection. In the higher timeframe you will see higher variation and in small timeframe smaller variation.
You can select the timeframe who suit your trading style. The 1h and 4h fit well for longer trend swing trade and the lower time frame 15m, 5m, 1m are good for scalping or daily trading.
The following asset are available:
Bitcoin
Ethereum
Gold
Crypto total market cap excluding bitcoin (total2)
United state 10-year government bond (US10Y)
Usdt dominance show the concentration of usdt hold. For example, when trader are fearful they sell their crypto position to keep more usdt in their portfolio (USDT.D)
The USD/JPY pair the dollar usd versus the Japanese Yen one of the most forex traded pair.
You can clic on parameter to select the asset you want to analyse.
The main correlation observed are:
bitcoin negatively correlated with the usdt dominance.
bitcoin negatively correlated with the usd/jpy pair
bitcoin is positively correlated to eth, total2 (altcoin)
bitcoin positively correlated with gold
bitcoin is mostly negatively correlated to us10y
The basis of correlation is that positively correlated asset goes in the same direction and that the negatively correlated goes in opposite direction.
So, the idea is to use these information to see trend reversing.
Example 1: when bitcoin and usdt dominance are extended in opposite direction we look for a possible retracement toward 1% wich is the middle base.
Example 2 : when bitcoin make a move we look for ethereum and total 2 to follow

Mix1 : Ema Cross + Trend Channel [Gu5] - BacktestBacktest of the indicator "Mix1: Ema Cross + Trend Channel "
Trend indicator, by the crossing of moving averages
SMA200 with a channel as a filter confirms the trend.
The crossing of two moving averages, give alert only in trend.

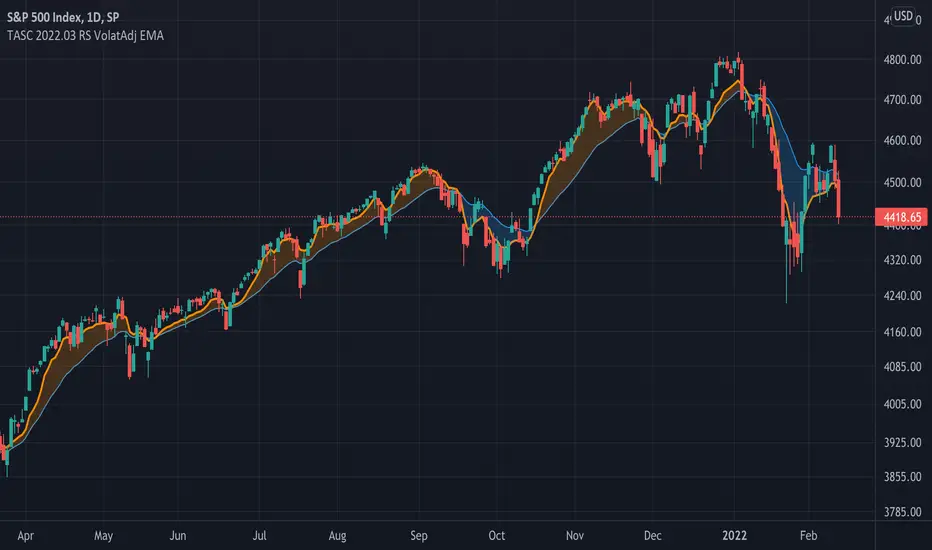
TASC 2022.03 Relative Strength Volatility-Adjusted EMA█ OVERVIEW
TASC's March 2022 edition of Traders' Tips includes the "Relative Strength Moving Averages - Part 3: The Relative Strength Volatility-Adjusted Exponential Moving Average" article authored by Vitali Apirine. This is the code that implements the "RS VolatAdj EMA" from the article.
█ CONCEPTS
In a three-part article series, Vitaly Apirine examines ways to filter price movements and define turning points by applying the Relative Strength concept to exponential moving averages . The resulting indicator is more responsive and is intended to account for the relative strength of volatility .
█ CALCULATIONS
The calculation process uses the following steps:
Select an appropriate volatility index (in our case it is VIX ).
Calculate up day volatility (UV) smoothed by a 10-day EMA.
Calculate down day volatility (DV) smoothed by a 10-day EMA.
Take the absolute value of the difference between UV and DV and divide by the sum of UV and DV. This is the Volatility Strength we need.
Calculate a MLTP constant - the weighting multiplier for an exponential moving average.
Combine Volatility Strength and MLTP to create an exponential moving average on current price data.
Join TradingView!
Distance from EMA LevelsDisplay up to 4 distance from EMA levels, by default it's based on the 5m timeframe.

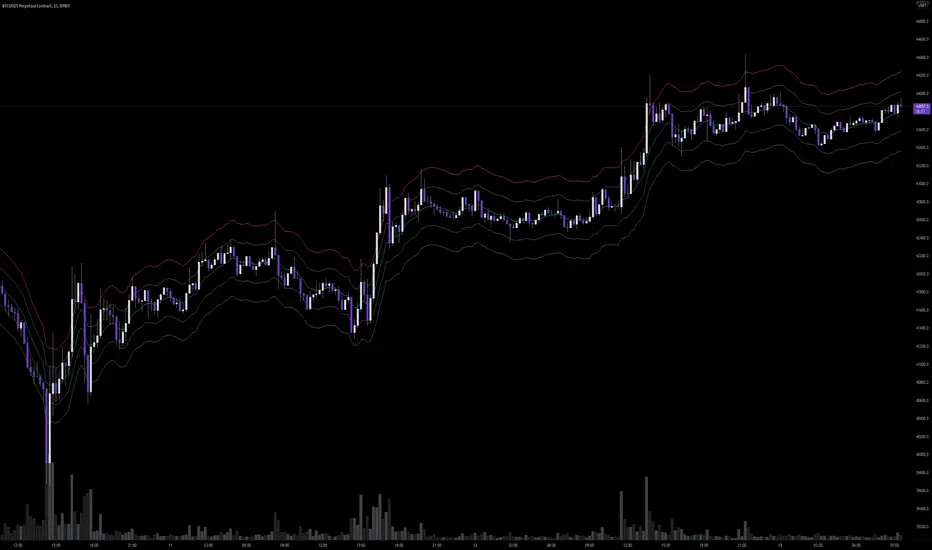
EMA deviationssuper basic, % deviations around an EMA
will update later
published so i dont have to type this up everytime i open a chart
EMA/MA Cross + BB + Alerts Short hand notes - I made this for friend and I. Unsure how to share it with him so made it public.
u/ tmyerskerry for the math on slope and look back period (look back period isn't perfect for slope calculation as 200ma is slow moving so some signals are goign to be strong instead of weak and visa versa. If you know a better way than i'm all ears!
Can set mutliple EMA's and MA's.
Default BB built in. Couldn't figure out how to set default shadow transparency so you will have to turn it down.
Added red and green lines that indicate when price has gone above and below the BB shadow.
Added arrows for when EMA1 crosses EMA2. Right now set for 9 + 32. And depending on MA200 color changes if its with the trend or against.
Alerts in the works. (please don't ask for them as i'm doing this part time and don't know pinescript)

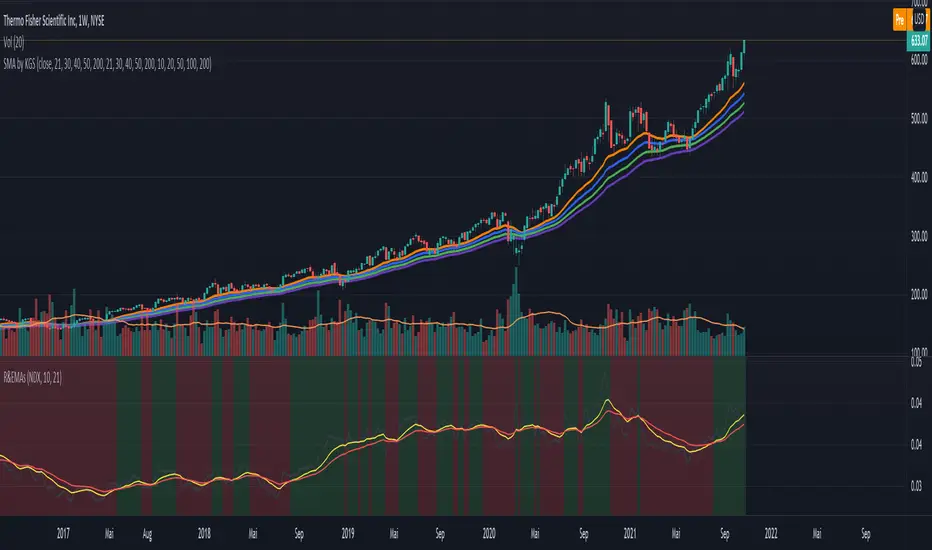
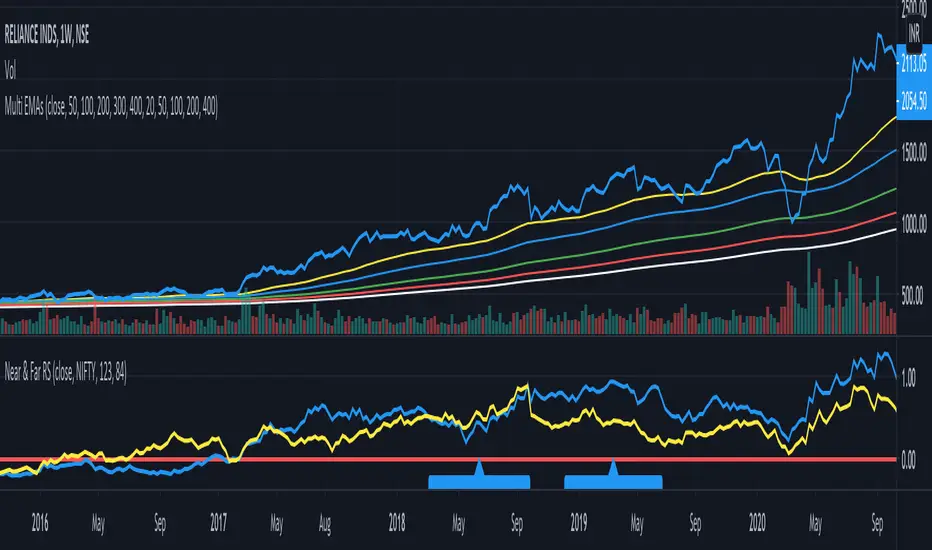
Ratio (Relative Strength) & EMAsRatio (Relative Strength) & EMAs
This indicator is used to compare the actual symbol with another one by calculating the ratio. EMA1 and EMA2 of the ration are shown as well. The idea is to choose an index like the NDX or SPX for comparison and to determine if the actual symbol outperforms the index or not - separate the wheat from the chaff. The rules are as follow:
When the calculation ratio (symbol divided ratio symbol) is above EMA1 and EMA1 is above EMA2) the background turs green. If not the background turn red.
2 EMA Meeting PointThis script will calculate when the next candle needs to close for the moving averages to cross .
If you use EMAs that are far away, the convergence point may be ridiculously far away from the chart. I recommend using ' Scale Price Chart Only ' with this script.
I think you can use this to organize your watchlists if you trade crossovers. If your cross is completely out of the chart, its symbol can be down below, because the cross is unlikely to happen in the next candle.
Good luck!
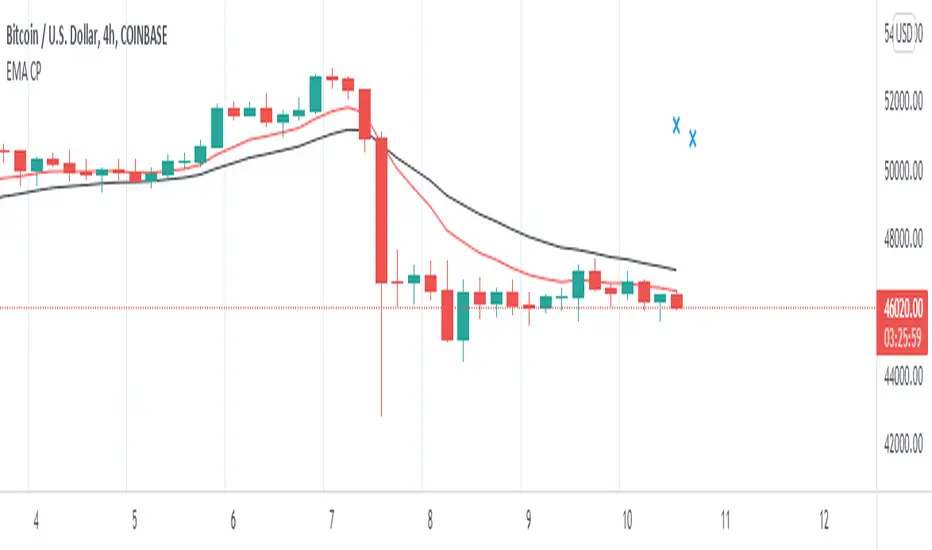
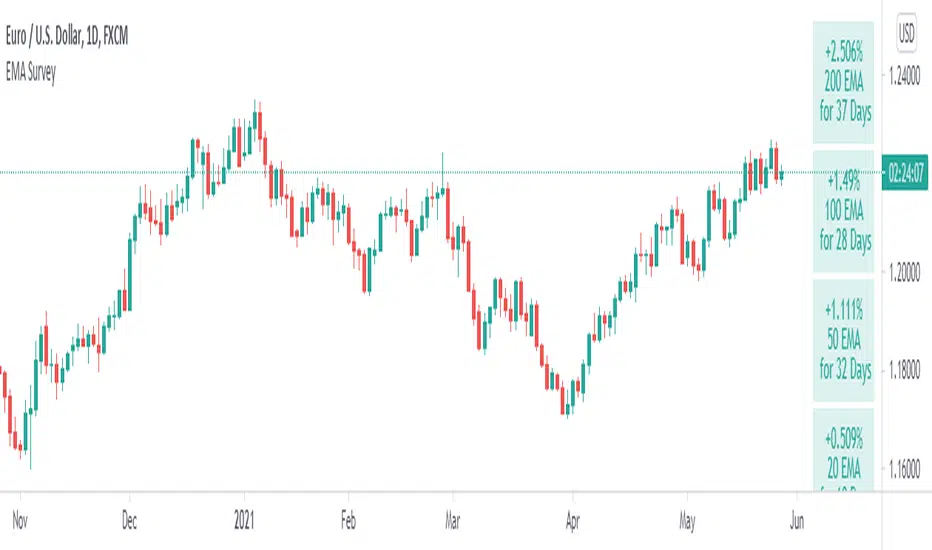
Table: EMA SurveillanceThis script will show information of interest about Moving Averages from the selected timeframe.
The idea is to provide data from higher timeframes (Daily preferably).
The information provided includes:
• selected length and calculation
• a relative position of the close to the average (above, below, and how much)
• how many periods passed since the moving average has been tested - any break counts as a test, it doesn't have to close on the opposite side
Global Settings:
• Timeframe of the moving averages
• Choose to see simple words such as "Above" / "Below" OR the specific percentage OR how much percentage % it moved from the moving average?
• EMA or SMA
Moving Average Settings:
• Up to 6 different lengths
• You can deactivate the averages you don't need
I hope it will be useful. Good luck!
Crypto EMA Bands - Support and ResistanceEMA Bands for crypto markets shows support and resistance lines. Helps identify bull and bear market trends. SMA200 is white and turns yellow to signal pressure. Can also be useful for identifying Elliot waves and breakouts.

EMA (10,20,60) + Bollinger BandsCombination of bollinger bands and exponential moving averages (10, 20, 60)
The coloring is optimized for dark background, and it is editable
This indicator combined 3 exponential moving average lines and bollinger bands . The EMA lines can be add or deleted in pine editor, and its parameters can be changed too. Same to the bollinger bands . Defaulted value for BB is 20SMA with 2 standard deviations.
Useful as a supplmentary indicators

EMA Crossover StrategyMoving average crossover systems measure drift in the market. They are great strategies for time-limited people.
So, why don't more people use them?
I think it's due to poor choice in choosing EMA lengths: Market Wizard Ed Seykota has a guideline for moving average crossovers: the slow line should be at least 3x the fast line. This removes a lot of the whipsaws inherent in moving average systems, which means greater profitability. His other piece of advice: long-only strategies are best in stock markets where there's a lot more upside potential.
Using these simple rules, we can reduce a lot of the whipsaws and low profitability trades! This strategy was made so you can see for yourself before trading.
=== HOW TO USE THIS INDICATOR ===
1) Choose your market and timeframe.
2) Choose the length.
3) Choose the multiplier.
4) Choose if the strategy is long-only or bidirectional.
Don't overthink the above! We don't know the best answers, that's why this strategy exists! We're going to test and find out.
After you find a good combination, set up an alert system with the default Exponential Moving Average indicators provided by TradingView.
=== TIPS ===
Increase the multiplier to reduce whipsaws (back and forth trades).
Increase the length to take fewer trades, decrease the length to take more trades.
Try a Long-Only strategy to see if that performs better.

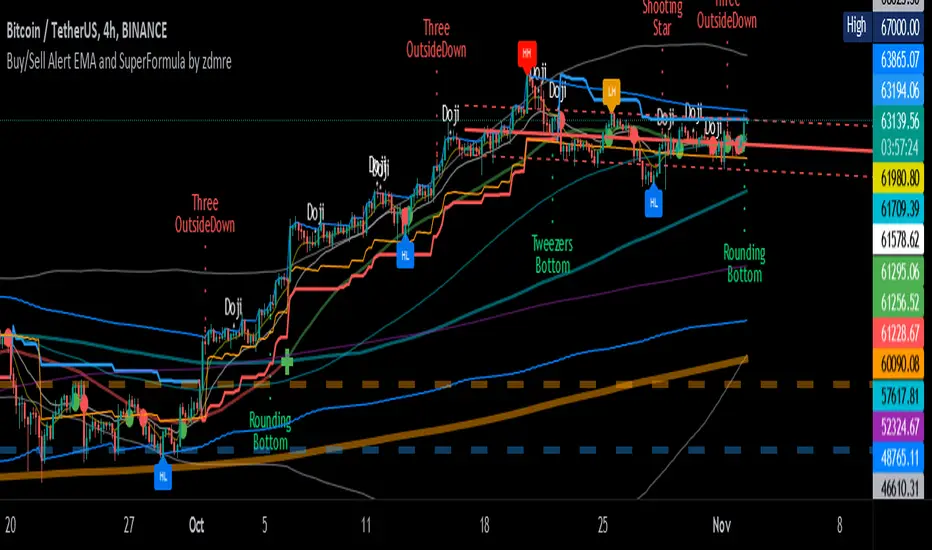
Buy/Sell Alert EMA with SuperFormula by zdmre*** Use it at your own risk
This indicator has 3 indicators and gives a buy/sell signal depending on the EMA.
3 indicators:
- Ichimoku
- Bollinger Band
- EMA
It also shows the value on the candle as a warning in the Buy and Sell signals. This value is calculated with a special formula I have created.
On the other hand Bollinger Band and Ichimoku Cloud are also included to check the accuracy of the signals.
For this indicator, I recommend a minimum of 4 hours chart.
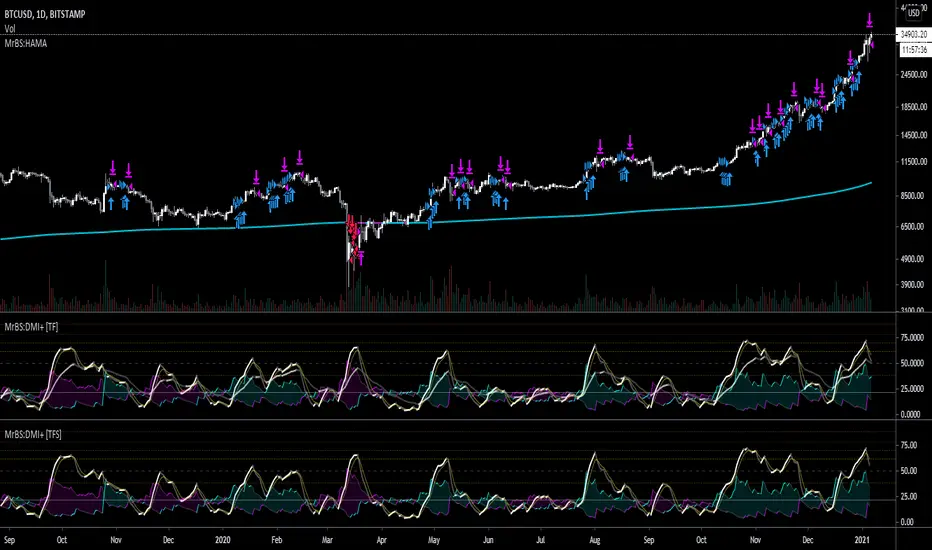
MrBS:EMA/SMA/HMA (Heikin Ashi Calc)This indicator allows you to base the MA calculation from Heikin Ashi values on normal charts and/or the real OHLC values while looking at Heikin Ashi.
There are 3 MA types you can select - EMA / SMA / HMA
The colour is based on the slope.
I made this to help me visualize my DMI+ strategy, when I was looking at taking signals from Heikin Ashi but looking at candlesticks. Turns out, I was going down the wrong road. Now I'm looking into using the real OHLC values for generating signals but watching the Heikin Ashi chart as I find it easier to see trends on it.
Hopefully its useful to some people, and if you have any suggestions for improvements I'd love to know.
Multiple EMAs - Variable lengthsA simple cluster of EMAs that will switch the lengths based on intraday or not.
The fast, medium and slow periods will switch to set values as per input.

[Strategy] - EMA 10,20 59 with Profit DisplayedThis EA is still under construction !!
So for this EA is only based on the trend of the 3 EMA's
Buytrend = (ema1 and ema2 > ema3) and (ema1 and ema2 > ema3 )
We also change the Background depending on the trend.
bgcolor(Buytrend ? color.green : color.red,transp=70)
At this point I was wondering how much "profit" we would have made if this strategy was only based on the trend so I added the Labels to start/end close of that trend and then see how much profit in pip's we would have made.
Later I was wondering if I could get the total information on the trades and thats what the Label over the current candle is telling us. If that label is red we didn't made any profit and if its green we made som profit.
I also added a BuyProfit and a count buy/sells and a total Profit to see how that information clearly without opening the strategy tester.
NOTE this shows the profit in pip's
Next step is to implement a Buy/Sell Signal togheter with a Buy/SellSignalOUT signal.
Thats currently under development and you'll see some code being there already but as of now the orders are made from the trend signal not the Buy/Sell Signal.
