Synthetic EMA Momentum w/ DSL [Loxx]Synthetic EMA Momentum w/ DSL is a momentum indicator that is calculated with 5 different EMAs of increasing period to derive a final momentum value. This helps reduce noise and improve signal quality. Discontinued signal lines are uses to calculate signal values.
What are DSL Discontinued Signal Line?
A lot of indicators are using signal lines in order to determine the trend (or some desired state of the indicator) easier. The idea of the signal line is easy : comparing the value to it's smoothed (slightly lagging) state, the idea of current momentum/state is made.
Discontinued signal line is inheriting that simple signal line idea and it is extending it : instead of having one signal line, more lines depending on the current value of the indicator.
"Signal" line is calculated the following way :
When a certain level is crossed into the desired direction, the EMA of that value is calculated for the desired signal line
When that level is crossed into the opposite direction, the previous "signal" line value is simply "inherited" and it becomes a kind of a level
This way it becomes a combination of signal lines and levels that are trying to combine both the good from both methods.
In simple terms, DSL uses the concept of a signal line and betters it by inheriting the previous signal line's value & makes it a level.
Included:
Loxx's Expanded Source Types
Alerts
Signals
Bar coloring
Related indicators
Smoother Momentum MACD w/ DSL
T3 Velocity
Cari dalam skrip untuk "ema"

Scalping EMA ADX RSI with Buy/Sell AlertsThis is a study indicator that shows the entries in the strategy seen in one of the youtube channel so it does not belong to me. I can't tell who it is because it's against the House Rules to advertise but you can find out if you look for it on youtube. Default values of oscilators and ema adjusted as suggested. He says he got the best results in 5 min timeframe but i tried to make things as modifiable as possible so you can mess around with the settings and create your own strategy for different timeframes if you'd like. Suggested to use with normal candlestick charts. The blue line below indicates the ADX is above the selected threshold set in the settings named "Trend Ready Limit". You can set alerts for Buy, Sell or Buy/Sell signal together.
The entry strategy itself is pretty straight forward.
The rules for entry are as follows, the script will check all of this on auto and will give you buy or sell signal :
Recommended time frame: 5 min
For Long Entry:
- Check if price above the set EMA (Can disable this rule if you'd like in the settings)
- RSI is in Oversold
- ADX is above set "Trend Ready" threshold (Meaning there is a trend going on)
- Price must approve the trend of previous candles. This is bullish for buy entries and bearish for sell entries.
- Enter with stop loss below last swing low with 1:1 or 1.5:1 take profit ratio.
For Short Entry:
- Check if price below the set EMA (Can disable this rule if you'd like in the settings)
- RSI is in Overbought
- ADX is above set "Trend Ready" threshold (Meaning there is a trend going on)
- Price must approve the trend of previous candles. This is bullish for buy entries and bearish for sell entries.
- Enter with stop loss above last swing high with 1:1 or 1.5:1 take profit ratio.
This is my first indicator. Let me know if you want any updates. I am not sure if i can add everything but i'll try nonetheless.
Changed: Signals will check up to 2 candles before if the RSI is below or above the set value to show signal. This is because sometimes the entry signal is right but the response might be a bit late.

Forex Fractal EMA ScalperThis is a forex scalper designed for very short timeframes 1-5 min max.
At the same time due to the short timeframe, is recommend to re optimize it weekly .
Its components are
Fractals
Triple EMA with different lengths
Rules for entry:
For long : we have an up fractal and all 3 ema are in ascending order
For short: we have a down fractal and all 3 ema are in descending order.
Rules for exit
We exit when we either get a reverse order or when we hit the take profit or stop loss calculated in fixed pips.

Crypto Scalper Divergence Macd Psar Ema 200This is a very efficient crypto scalper adapted to very short timeframes, however it can be optimized for other timeframes and assests as well.
Its components are
MACD
P SAR
EMA 200
Risk management
Rules for entry:
For short : we have an uptrend on PSAR , histogram is positive (divergence MACD) and close of a candle is below EMA 200
For long : we dont have an uptrend on PSAR, histogram is negative(divergence MACD) and close of a candle is above EMA 200
Rules for exit:
We exit when we either find a reverse condition than the entry one, or based on stop loss/take profit that are calculated on % movements of the price.
If you have any questions, let me know !

MACD, EMA, Know sure thing, Chopy Market - high adaptabilityHey there :)
This is the free version of the script. The following indicators / settings are missing:
- Support and resistance zones
- dynamic textboxes for alarms when using bots (3 Commas, Alertatron, etc.)
- a table showing the current position, indicators and other important information
With this script there is the possibility to completely customize the MACD . Starting with the MACD and signal line, the histogram and the color of the histogram.
Since the Pinecoders team has previously deleted the script, I will mention the fee settings in a bit more detail:
In this script a fee of 0.01% and a slipage of 15 was used. With each trade the total capital (100%) is used with a risk reward of 1 to 1.5.
The total capital, i.e. the risk, can be changed at any time under the "Settings" tab at "Equity".
I also added an EMA , the Know sure thing indicator and the Chopy Market indicator (by TradingRush) to the script to filter out bad trades.
The EMA:
Since the EMA is very reliable and shows whether there is an upward or downward trend, it should be used with the indicators in any case. It prevents long trades in downward movements and vice versa.
The KST Indicator:
The KST indicator has a similar movement as the MACD, but is by and large a bit more time delayed. It filters out false swings of the MACD and thus prevents bad trades.
The Chopy Market Indicator by Tradingrush:
The Chopy Market indicator, which was introduced by TradingRush in one of its videos, has the ability to detect sideways markets and block zones below this line for trades by means of a fixed value (the line).
To exit the trades, I added the following options:
ATR Exits. Exits based on past candles (lowest low, highest high).
Static exits based on set percentages.
In the next days I will create a tutorial for the script, just have a look on my profile.
If you have any questions about the script, let me know.
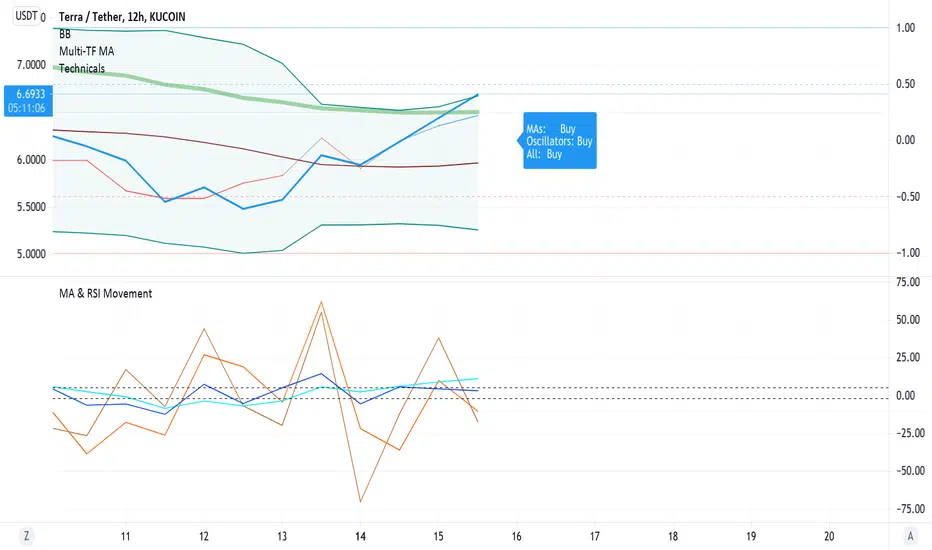
Barholle eMA and RSI Movement TestThis is a test that offers insight into whether and asset is heading into bullish or bearish territory.
This indicator/test offers insight into the Exponential Moving Average's velocity and acceleration as well as the Stochastic RSI's velocity, acceleration and jerk. Included is a 'Stochastic Difference' and 'Stochastic Growth' indicators (commented out) that measure the difference between K and D in the Stoch RSI as well as the rate of it's change. This test is all about crossovers - the best leading indicator is a downward cross of the eMA velocity over the eMA acceleration, indicating a drop in price in the current or next bar.
The lines or importance have been set to -2 and 5, but these should be adjusted to suit your preferences. These numbers were chosen in order to try and create some kind of threshold after which action might be suggested. Backtesting is highly recommended so you can see how the test does and does not work. It is super powerful, but it is not omniscient - its an RSI and eMA derivative, past success does not necessarily dictate future success.
Please look at the code for several more plots you can use of derivatives and other ideas explore but commented out for greater legibility of the graph. Commenting and commenting (or uncommenting all and just disabling some in the settings) and comparing the graphs and crossovers is a useful exercise. To that end, one last concept - the MARSI - a combined moving averages and RSI measurement - was abandoned because it didn't appear to indicate anything of use, however you may find crossovers or patterns with it comparing it to other graphs, so it was left in but commented.
Please take a look at the comments and all the math and indicators 'left on the cutting room floor' in the script. Maybe you'll find a gem in the redux version of this script.
Outreach regarding the script, patterns noticed and full-on stealing of the script are all permitted. Many elements of this script were nabbed from other scripts - thank you to a community of coders who put it all out there.
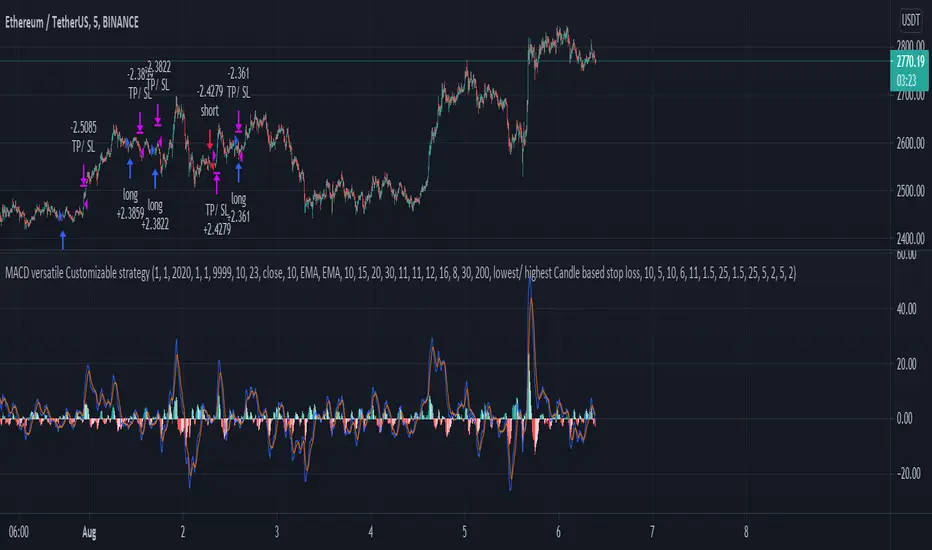
Crypto EMA Trend Reversal StrategyThis is an EMA crossover strategy which involves 5 EMAs to trigger trades. The strategy has two take profit settings and uses a stop loss.
TP1 and SL are based on ATR and TP2 is an EMA crossover.
The strategy goes both long and short and the default settings work particularly well as a scalping strategy for ETHUSDT on the 5M time frame.
I have also created another version with tweaked settings for scalping LINKUSDT on the 5M with very similar results.
There is an option to add a volume condition parameter within the script on lines 26-28 which can be added to the end of lines 34-35 in the following format: and vol_cond
I personally don't currently use the volume condition parameter.

Ichimoku EMA RSI - Crypto only long StrategyHey there!
Here I show you an Ichimoku Cloud Strategy.
I discovered the strategy on a YouTube channel and tried to transfer it as a strategy into a script.
He said in his video that you would make more profit with this strategy than holding the coin.
Tested with the crypto pair ETH/USDT in the four hour chart.
Period: beginning of 2017 until today.
The strategy should also work with foreign exchange. But then the settings have to be adjusted.
There is the possibility to activate two EMA's and a Stochastic RSI .
-----------------------------------------------------------------------------------
How does the strategy work?
ENTRY
The green Ichimoku lead line must above the red Ichimoku lead line - only the two lead lines are activated.
A green candle must closed above the green lead line.
EXIT
A red candle must close below the green Ichimoku lead line.
OPTIONAL ENTRY
EMA
Once you activate the EMA , long positions will only be taken once the EMA1 is above the EMA2.
Thereby I could observe a significant increase of the profit as well as a decrease of the maximum drawdown.
RSI
As soon as you activate the Stochastic RSI , long positions are only taken when the K line is above the D line.
In the future, I may add an oversold - undersold parameter.
The results of the strategy are without commissions and levers.
If you have any questions or feedback, please let me know in the comments.
If you need more information about the strategy and want to know exactly how to apply it, check out my profile.
I wish you good luck with the strategy!

Tripple super Trend + EMA + RSI StrategyGreetings!
Here I show you the Tripple Super Trend Strategy.
I discovered the strategy on a YouTube channel and tried to transfer it as a strategy into a script.
Tested with the currency pair EUR/USD in the one hour chart.
Period: beginning of 2020 until today.
The strategy should also work with cryptocurrencies. But then the settings have to be adjusted.
There is the possibility to activate only long or only short position.
The EMA can be used in a time different from the chart.
-----------------------------------------------------------------------------------
How does the strategy work?
For long positions, the candle must be above the EMA .
The candle must be closed above at least two of the supertrend lines.
The stochastic RSI must show oversold and the k line must cross over the D line.
For short positions, the candle must be below the EMA .
The candle must be closed below at least two of the supertrend lines.
The stochastic RSI must indicate overbought and the K line must cross below the D line.
The stop loss is determined with the "lowest low/highest high lookback".
The profit factor is multiplied by the value of the lowest low/highest high lookback.
The results of the strategy are without commissions and levers.
If you have any questions or feedback, please let me know in the comments.
In the future I will add other types of stop loss / take profits. (ATR; %; eg.)
If you need more information about the strategy and want to know exactly how to apply it, check out my profile.
I wish you good luck with the strategy!

Ichimoku EMA WaveThis script combines a customizable Ichimoku Cloud/ EMA combination to provide a quick trend visualisation.
For example, long entries can be found when the green EMA wave rises above the Ichimoku cloud.
Combine it with some oscillators (like MACD) for good results.
Also, experimenting with a different "wavelength" (default 50) and/or EMA length (default10) for different securities is a good idea.
Script is free to use and to modify at ones liking.
MACD oscillator with EMA strategy 4H This is a simple, yet efficient strategy, which is made from a combination of an oscillator and a moving average.
Its setup for 4h candles with the current settings, however it can be adapted to other different timeframes.
It works nicely ,beating the buy and hold for both BTC and ETH over the last 3 years.
As well with some optimizations and modifications it can be adapted to futures market, indexes(NASDAQ,NIFTY etc), forex(GBPUSD), stocks and so on.
Components:
MACD
EMA
Time condition
Long/short option
For long/exit short we enter when we are above the ema, histogram is positive and current candle is higher than previous.
For short /exit long , when close below ema, histo negative and current candles smaller than previous
If you have any questions please let me know !

Background Color Based on EMAHello Traders,
this is a very simple script. It paints the background color based on the close price in reference to an exponential moving average.
If the close is above the EMA the background color will be green.
If the close is under the EMA the background color will be red.
You can adjust colors and the EMA period by yourself.
This little indicator script is just to get a better overview, for example in combination with other indicators.
Hope you guys like this script. Wish you a great trading week.

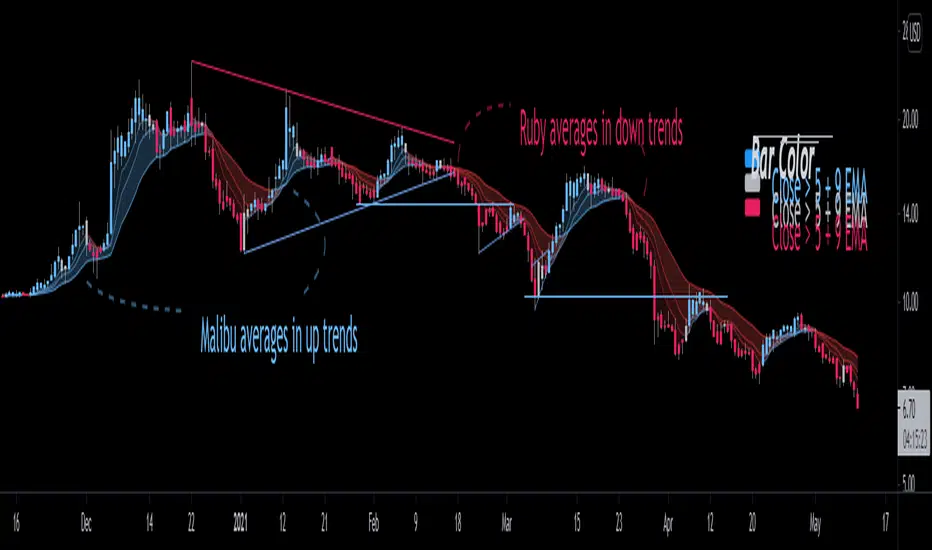
Bjorgum EMAThis is an answer back to repeated requests for a simple version of Bjorgum Triple EMA Strat, which is not recommended for use with Heiken Ashi candles as it results in "double smoothing" of the averages and can give late signals as a result.
The inputs are raw and super basic. At its core its really just 3 EMAs that you can customize the source and length. The averages and shadowing change color based on if they are either rising or falling.
default values are 5, 9, and 21 EMA on open as source.
Bar color is dictated by the bar close over or under the 5 and 9 EMA.
This is suitable for use on HA candle.
Trend following 3 EMA & Bullish Engulfing indicator for ForexHello world,
I now took the time and puzzled through my own indicator.
The idea:
Main "strategy" uses 3 EMAs (8, 13 and 21) to attain trend-relevant information.
Then we look for bullish & bearing engulfing candles which indicate and pullback into trend direction and a gain in momentum.
Trading purpose:
One could now enter with next open. SL at low/high of engulfing candle. TP at e.g. 1.25 of that candles size.
Security:
There are two security functions build in.
We check for higher timeframe confirmation.
This is done by checking if current trend is in accordance with the EMA of the next higher timframe.
Standard-deviation is 3 on default. Can be changed in the inputs.
Alerts:
Until now there is just one alertcondition programmed.
It alerts for every engulfing candle (bullish and bearish).
More will follow in further versions.
Inputs:
I build in multiple inputs.
- switch on/off the security EMA's
- define security trend backcheck
- define the higher timeframe (15min/1h, 1h/240, 4h/D, D/W)
Happy to take feedback or contr.
All the best,
c4ss10p314

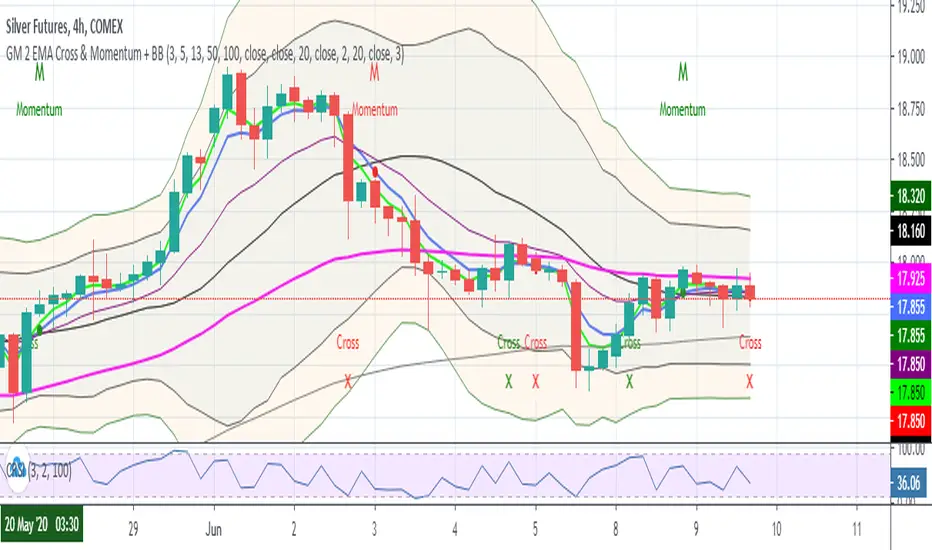
GM 2 EMA Cross + BBScript for seeing the below EMAs
3
5
13
50
100
This also plots a red cross when -ve crossover of 3 by 5 EMA & green cross when +ve crossover of 3 by 5 EMA
Bollinger Bands
2
3
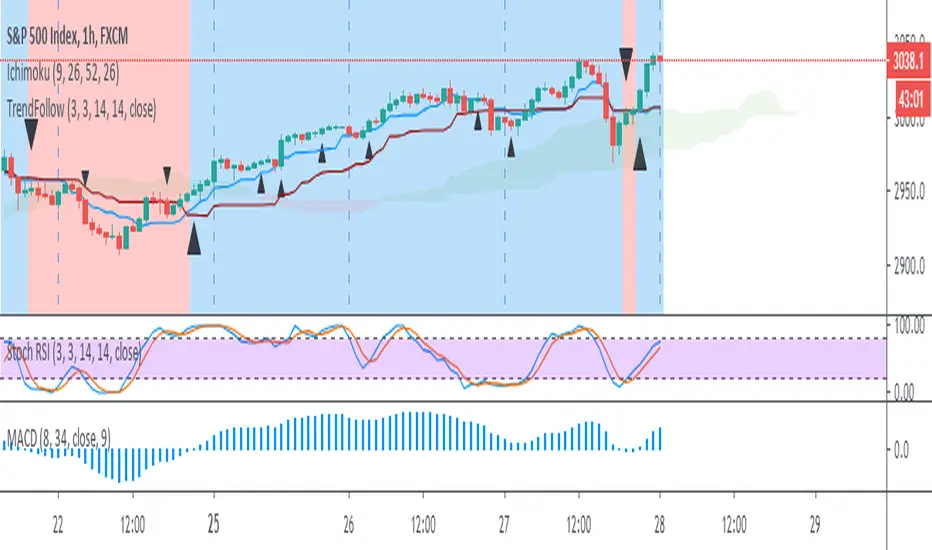
Trend Follow with 8/34 EMA and Stoch RSI for 1 Hour SPX
The script determines and plots entry points for 1 hour S&P index using 8/34 emas and stochastic RSI. When 8 ema above/below 34 ema up/down crosses of stochastic RSI are considered as long/short entries. Entry prices should be above/below high/low of the signal bars accordingly. Ichimoku cloud can be used as extra filtering.
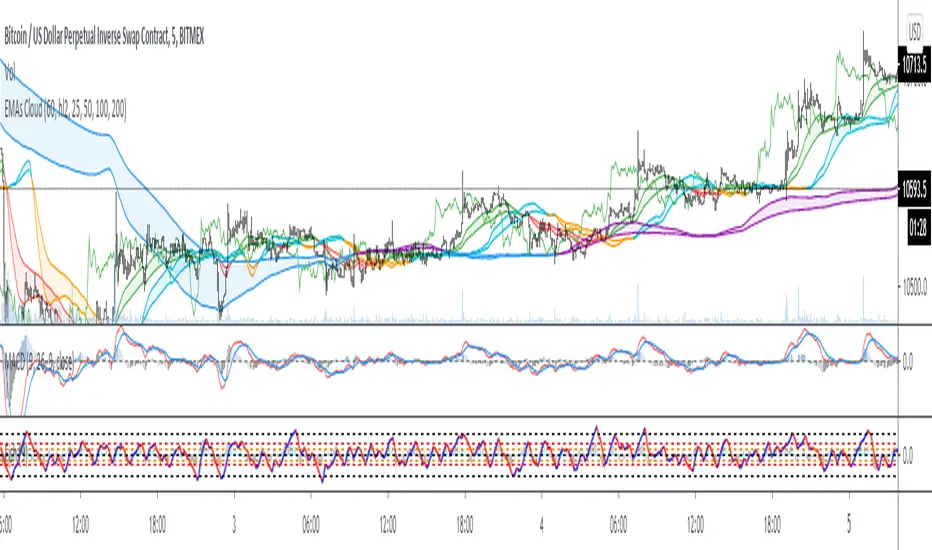
EMAs CloudEmas clouds is based on exponential moving averages 25 , 50, 100, 200
Ema 25/50 when crossed give you entry to the trend based on dipacmend forward ema 25/50 for 25 candles and ema 100/200
I add it also momentum based on close of the price moved back 25 candles.
DW-RSI EMA with EMA of RSIThis is an RSI Oscillator with an EMA of the RSI for a signal line. The RSI line is Green when above the signal line and Red when below the signal line.
This does not use the traditional 30% / 70% over sold / over bought analysis. Therefore the levels are not shown.
The analysis is this:
When the RSI is above the signal line then price has a bullish bias.
When the RSI is below the signal line then price has a bearish bias.
I wrote use this for Forex Spot Currencies where I feel overbought and oversold may be less valid than it may be in other markets such as stocks.
As with all indicators, do not use as your sole reason to enter the market, but use with other indicators or price action signals to get a confluence of signals to confirm your entry.
I use it with an 8, 21 and 50 EMA to confirm entry and exit. I give it more weight for exits than I do for entries.

Multiple lines EMA/SMA [AKUBI] Ver.2 - 5本の指数平滑・移動平均線単純移動平均線と指数平滑移動平均線(SMA/EMA)を最大5本引けるインジケーターです。
これまでのものとの違いは
・線の太さ
・名前の変更←これ重要
です。いままでのものをそのまま使用いただいても、問題はありません。
通常、トレーディングビューでは、
移動平均線を5本同時に表示させるには「5つのインジケーターを必要とします」。
しかし、 このインジケーターは1つ使えば最大5本まで同時に表示させることができます 。
また、余計なオプションは一切ありませんので、 どなたにでも、すぐにご使用いただけます 。
1)まず、この画面の右下にある「お気に入りに追加」をクリックしてください。
そうすると、インジケーターの「お気に入り」からいつでも呼び出せます。
もしくはインジケーターの検索欄から「AKUBI」と検索しても見つけられます。
使い方は簡単。
2)EMA(指数平滑移動平均線)か SMA(単純移動平均線)のいずれかを選択。
3)その後、お好きな期間を入力してください。
単純移動平均線(SMA)というのは、「5」と入力すれば、5本分のローソク足の終値の平均が表示され、それを結んだ線です。
指数平滑移動平均線(EMA)というのは、少し計算を複雑にして、より素早い動作を実現したものです。
デフォルトでは期間として(7,28,84,100,500)の5種類があらかじめ入力されています。
このまま使っても問題ありませんが、ネットで「移動平均線 設定」と検索すれば、いろいろな設定が紹介されていますので、参考にしてみてください。
不要な線があれば、チェックを外すだけです。
とっても簡単、便利です。
It is all in one. You can use 5 moving average lines with this one indicator only.
It is so easy. Just add this indicator. Next step, please add your favorite periods.
If you think this is an unnecessary line, you just remove in the check box.
Thank you!

Fibonacci Moving Average (EMA/SMA) Bundle //@v1.2 Fibonacci Moving Average (EMA/SMA) Bundle
//By Tantamount
//Save your TV indicator use counts by using the Fibonacci SMA/EMA all in one indicator! Toggle between Exponetial or Simple moving averages functionality, using Fibonacci the sequence.
//Fib moving averages are very good at locating support and resistance zones on multiple time frames.
//Customize and or input your very own moving average nomenclature by simply changing the input options from default: SMA (21, 55, 89, 144, 233) or EMA (21, 55, 89, 144, 233) Example: (8,13,21,55,89)
Support and Resistance Lines

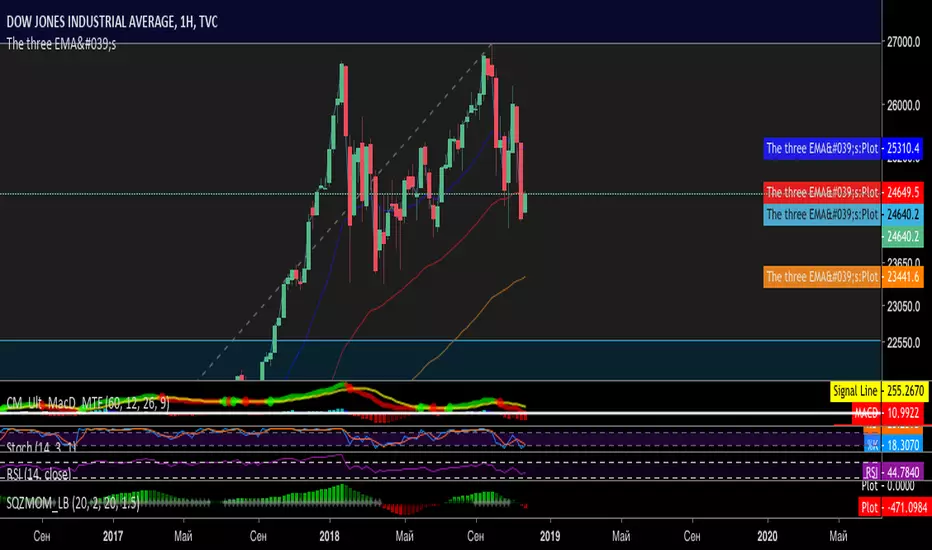
The Three EMA'sThe script is three EMA's that are fit into one indicator. Can be well used in EMA trading system for short and long term.
Moving Average Shaded Fill Area Crossover EMA Color - EditableMoving Average Shaded Fill Area Crossover EMA Color with option to change EMA value

Multi SMA EMA WMA HMA BB (5+5 MAs + Bollinger Bands) by RRB
Multi SMA EMA WMA HMA BB (5+5 Moving Averages of Any Type with Bollinger Bands) by RagingRocketBull 2018
Version 1.0
This indicator shows multiple MAs of any type (SMA EMA WMA HMA etc) with BB on a chart at the same time with/without MTF support depending on the version.
There are several versions (published later): Simple, MTF, Pro MTF and Ultimate MTF. This is the Simple version. The Differences are listed below. All versions have BB
- Simple: you have 2 groups of MAs that can be assigned any type (5+5)
- MTF: +assign 1 custom Timeframe to any group combo (5+5 Custom TF)
- Pro MTF: +multiple Timeframes for multiple MA groups (4*3 MTF), horizontal levels and show max bars back options
- Ultimate MTF: +individual settings for each MA, multiple Timeframes
You can use different types of MAs as dynamic S/R levels to trade of off and MA crosses as signals for possible trend change (golden/death bull/bear crosses).
Most common MA types are: SMA, EMA, WMA, HMA.
Most common MA lengths are: 12, 20, 26, 30, 50, 100, 200, 400 etc.
Features:
- 2 groups of custom 5+5 MAs of any type including Hull Moving Average (HMA)
- BB
1. based on 3EmaBB, uses plot, fill, stdev and custom hma functions
2. swma has a fixed length = 4, alma and linreg have additional offset and smoothing params
Feel free to use. Good Luck!
