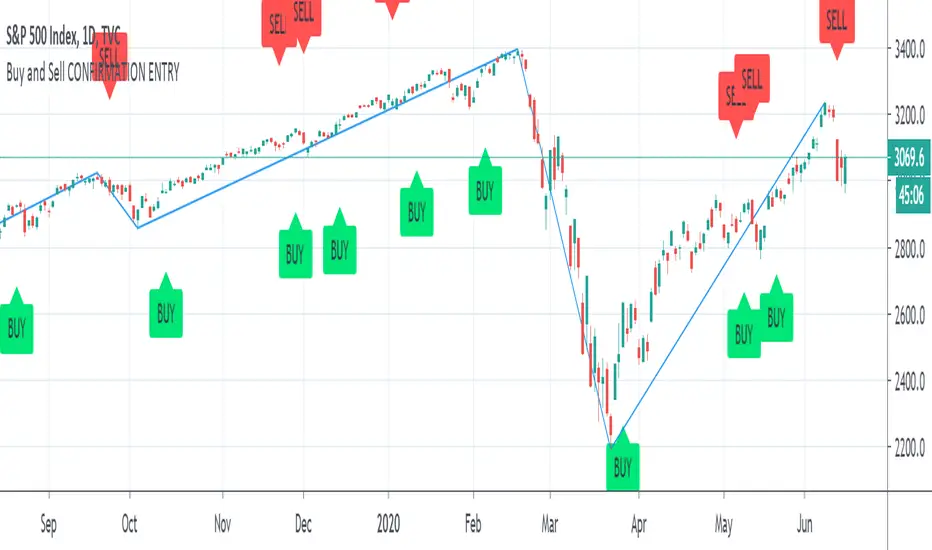
Buy and Sell CONFIRMATION ENTRY"Buy and Sell CONFIRMATION ENTRY" Product Description:
The indicator identifies market trends with visual buy/sell alerts on the chart.
Useful on higher timeframes available on Tradingview (ex: 4 hours, 1 Day).
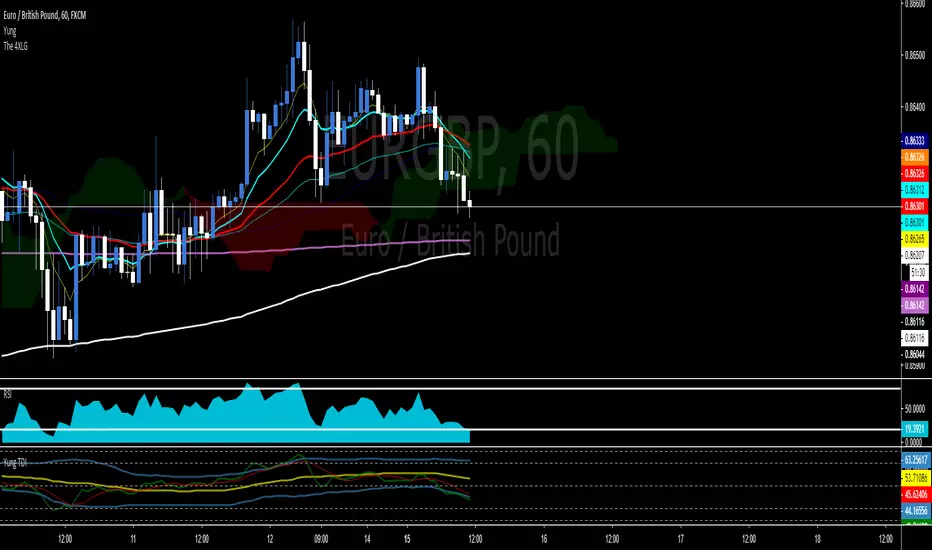
The "Buy and Sell Confirmation" Indicator combines Moving Average Convergence Divergence and Relative Strength Index, which triggers technical signals when it crosses above (to buy) or below (to sell) its signal line. The crossovers transformed in buy and sell indicators is also taken as a signal of a market is overbought or oversold. The swing lines help you draw Elliott Waves to understand better where the market is heading.
The indicator can be used for every type of market: indices, stocks, cryptocurrencies, currencies and others.
This study is not a guarantee profit. You should backtest or trade virtual money before using this study on your real portfolio, as it is intended to be a tool and not a fortune teller.
Disclaimer: Trading and investing in the stock market and cryptocurrencies involves substantial risk of loss and is not suitable for every investor. The content covered in this videos is NOT to be considered as investment advice. I’m NOT a financial adviser. All trading strategies are used at your own risk.
Please send me a private message on TradingView to gain access to the script.
Cari dalam skrip untuk "entry"
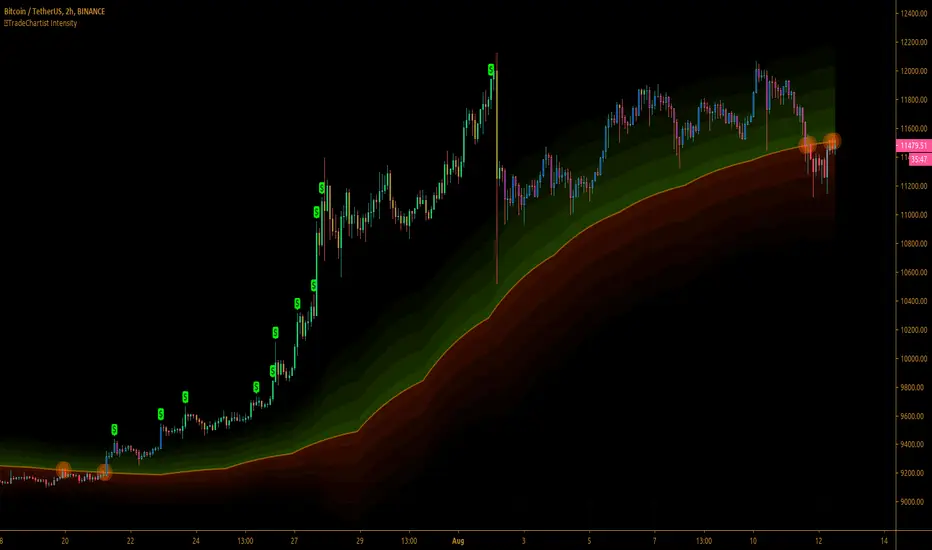
TradeChartist MTF RSI Spotter™TradeChartist MTF RSI Spotter is an elegant Multi Timeframe RSI tool that helps spot price trends using visually engaging and appealing RSI plots and backgrounds compared to the basic RSI plot. Also the Bull and the Bear background fills + HTF RSI based background fills are highly useful for traders who like to visually understand areas of entry and exit based on RSI .
What does ™TradeChartist MTF RSI Spotter do?
Plots RSI with visually spottable colors for Bull and Bear zones (Green and Red) with optional background fill.
Plots RMA based on User specified length.
Plots user preferred HTF RSI on same chart as chart TF - HTF resolution from indicator settings drop-down must be used.
Fills Bull and Bear zone colors based on HTF based RSI movement.
Spots Regular RSI Bullish and Bearish Divergences.
Plots RSI color candles on main chart based on Upper and Lower RSI band.
Plots RSI based on RSI smoothing (1 for Regular RSI without smoothing) and Heikin Ashi RSI if opted from indicator settings.
This indicator works like a dream when used with other indicators for confirmation of Trends.
Note 1: Divergences don't work to trader's expectations all the time. It is a great indicator but has to be used with caution and entries must be confirmed using another indicator like Volume , Trend, fundamentals, market sentiment etc. They can't be used on their own to decide entry and exit.
Note 2: Bull and Bear RMA with chart TF RSI should be used for confirmation and not as a standalone indicator for entry and exit.
Example charts
Premium Scripts - Trial access and Information
Trial access offered on all Premium scripts.
PM me directly to request trial access to the scripts or for more information.

™TʀᴀᴅᴇCʜᴀʀᴛɪsᴛ Tʀᴇɴᴅsᴇᴛᴛᴇʀ™TradeChartist Trendsetter is an elegantly designed functional indicator that helps spot price trends based on user input and volatility to generate high probability BUY and SELL signals.
1. What does ™TradeChartist Trendsetter do?
Plots high probability BUY/SELL signals based on user input and price volatility.
Plots recommended Stop Loss and SOS signals.
Plots regular RSI divergences based on user input.
Plots Linear Regression trend lines based on user input.
Displays Trendsetter Dashboard with useful trade information.
Displays real time gains tracker.
Tracks another symbol on Dashboard based on user input.
Alerts when BUY and SELL signals are generated.
2. What markets can this indicator be used on?
Forex
Stocks - Signal prices calculated taking gaps into account.
Commodities
Cryptocurrencies
and almost any asset on Trading View.
Works really well when there is good volume, volatility or both in the asset traded/observed.
3. Do the indicator signals repaint?
No. Once the BUY and SELL signals are generated with entry price (open price of signal candle), there is no repainting.
This can be verified using Trading View Bar Replay to check if the signals stay in the same candle in real-time as the Bar Replay.
4. Does the indicator send alerts when a signal is generated?
Yes. Traders can get alerts by setting up Trading View alerts for BUY/SELL signals. For confirmed BUY/SELL alerts, 'Once Per Bar' must be used as there is no need to wait for the candle close.
Example Charts
GBP-USD 1hr chart with indicator plots description
GOLD 4hr chart using Daily HTF resolution from indicator settings.
SPX 15m chart using Daily HTF resolution with RSI divergences.
Note: Default settings work really well for most assets and time frames. Change HTF resolution (default 4hr) from indicator settings and make sure it is higher time frame than the chart resolution.

Areas of Support/Resistance & BreakoutA pretty little indicator showing pivotal breakouts - that is, locating critical pivot points within price action, connecting the dots and trading the breakouts from this area!
-----------
Useful for finding good entry levels, exit levels, areas of strong support/resistance and most importantly - the Breakout!
Includes "Bars to the Left" variable so you can shorten or lengthen the indicator as required.
Good Luck and Happy Trading!

™TradeChartist Intensity™TradeChartist Intensity is a visual indicator that comes with Intensity color candles and Auto-fibs feature that helps any trader with Entry/Exit and levels confirmation based on where the price is, in relation to the Orange Price Equilibrium line and the 5 zones of Bull/Bear limits that fade into the top or bottom outer space.
™TradeChartist Intensity itself doesn't plot BUY or SELL signals, but when used with ™TradeChartist Rubicon gives a better picture for trade confirmations. It can also be used as a standalone indicator and works equally effective with other traditional and non-traditional indicators.
The indicator comes with simple settings with useful features outlined below.
Intensity Color Candles
Intensity Color Candles when activated from settings paints the candles/bars with colors specific to the Bull/Bear limits or the outer space and is easy to identify the signal strength over time.
Uptrend - The bars/candles move away from the Orange Price Equilibrium line towards the upper Bull limits with bar color fading slowly leading to outer space where the bar color turns neon green.
Downtrend - The bars/candles move away from the Orange Price Equilibrium line towards the lower Bear limits with bar color fading slowly leading to outer space where the bar color turns neon red.
When the price candle wick or body touches the Orange Price Equilibrium line, distinct torchlight circle appears to signal the trader of a potential change in price direction which can be used as a signal confirmation in conjunction with another indicator before taking a trade position.
Show Auto Fib Levels
Auto Fib Levels plot automatic Fib levels based on significant Highs and Lows based on Intensity strategy which mostly are reference prices of recent highest high above Orange Equilibrium price line and recent lowest low below the Orange Equilibrium price line.
15m XBT chart with 'Show Auto Fib Levels' checked and 'Show Fibs from current High/Low' unchecked under indicator settings
These Auto Fib Levels change when the price movement/trend changes direction and will be based on trending price direction.
Show Fibs from current High/Low
When this option is chosen from indicator settings, the auto fib levels are drawn from the highest high of the trending price direction to lowest low of last trend for uptrend or vice-versa for downtrend.
15m XBT chart as above with 'Show Fibs from current High/Low' unchecked under indicator settings
Show Profit Candles
Activating this option from indicator settings will automatically plot $ labels above candle highs that hit important resistance levels during uptrend and candle lows that hit important support levels during downtrend. This will help traders take out profits during trades based on their personal profit goals and realistic trade targets based on momentum/RSI/volatility etc.
Example chart of XAUUSD 1hr Gold chart showing both Long and Short trade Profit candles
Give a thumbs up or leave a comment if you like the script.
Flexta PVA Entry & Stop Loss V2This indicator used together with the result generated from FLEXTA PVA Alerts.
Upgrade to Version 2 with more user-friendly features.
It is a guideline to decide entry or exit position based on FLEXTA PVA trading rules.
User will easily understand each stock trend based on PVA phases, and it will help to improve the decision making before entry or exit.
Detail Indicator Description :
1. Green Circle with number 1 (Above Candle)
- PVA Stage 2 Priority 1
2. Orange Circle with number 2 (Above Candle)
- PVA Stage 2 Priority 2
3. Red Circle with number 3 (Above Candle)
- PVA Stage 3
4. Blue Candle Color (Candle Body)
- TPVA Top Stock
5. Red Circle with number 4 + Red Inverted Triangle (Below Candle)
- PVA Stage 4
6. Grey Background Pillar (Background)
- Momentum Detected
7. Red Circle (Below Candle)
- Redefined Stop Loss Suggestion
8. Red Line (Below Candle)
- Stop Loss Line reference
9. Cyan circle with star (Below Candle)
- PVA + RSI Oversold
10. Navy Blue Triangle (Below Candle)
- Swing Signal ( Follow the early signal )
11. Risk and Reward Panel (Above Candle)
- Cyan Color Panel - Low Risk
- Yellow Color Panel - Medium Risk
- Red Color Panel - High Risk
12. T Play Panel (Below Candle)
- T1 up to T9 Marking
13. S1 Top Stock Panel (Above Candle)
- Grey Color Panel with Remark

[fikira] Harmonic Patterns (Gartley)When using "Harmonic Patterns", always look at the bigger picture, please do not depend solely on the "Pattern".
Use other indicators,... to confirm what you think is going on!
That said, it is quite useful!
Here we have "The Gartley", bullish and bearish.
The "Pattern" is created by checking 5 consecutive (pivot) points, starting with X, A, B, C, and ending with point D.
At point D all 5 points are compared, calculated and verified.
When confirmed, a "Label" will be plotted at point D, together with the "Entry", "Take Profit" and "Stop Loss" price.
The "Entry", "Take Profit" and "Stop Loss" lines will be plotted as well at point D.
Lastly, a "Drawing" automatically will be displayed which makes the "Pattern" visible.
Please do mind, the "Drawing" is calculated differently, the "Drawing" sometimes can be displayed incorrectly
when prices are too close to each other (for example low Satoshi price changes).
THE "ENTRY" , "TAKE PROFIT", "STOP LOSS" PRICES AND LINES ARE NOT AFFECTED AT ALL BY THIS, THEY WILL SHOW CORRECTLY!
- 1 "TP point" can be changed ("TP Level 0.618")
- "Labels", "Lines", "Drawings" can be disabled/enabled
- "Labels" can be made smaller or bigger ("Size Label")
- "Labels" can be placed further or closer to the bar ("Distance TP Label" > higher = closer, lower = further)
- "Lines" can be made thicker or thinner ("TP Linewidth")
- "Drawings" can be made thicker or thinner ("Drawings Linewidth")
- "Drawings" are created by comparing with 100 bars back in history (default), should it be (very rarely) a triangle is displayed flat on the left side,
possibly the first point(s) is/are further than 100 bars ago, in this case increase "Period Drawings" above 100.
- When a lot (really a lot!) of "Patterns" appear on the chart, the first ones will not be displayed anymore, first the "Drawings", then the "Lines"
The last (present) ones will always be displayed in total without a problem!
- If you want to see "Patterns" with less correct measurement, change "Error Marge" 0.9 - 1" and "Error Marge" 1 - 1.1"), this gives max. about 10% extra margin
Thank you very much!

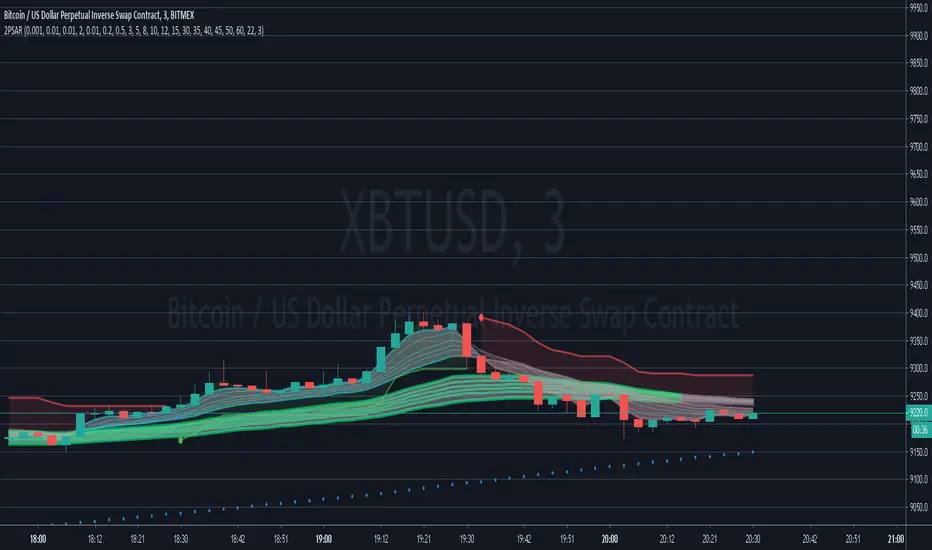
IMPULSE_2PSAR_ST_CMGEmasCurrently under Development.
Designed to easily get the trend using both SuperTrend and CM Guppy Emas, and using 2 PSARs for entry and trend change alert.
intended to trade scalping and options
CryptoJJ - SSL indicatorThe SSL indicator with colour change. Tool for spotting trends and finding good entry points. I recommend using it for higher timeframes, from 4h to 1D.
Play with the settings, you can change the moving avarage type, its length, if you prefer having the default
bar colours in your chart, disable the colouring function in the script.
Good luck crypto traders!
CryptoJJ

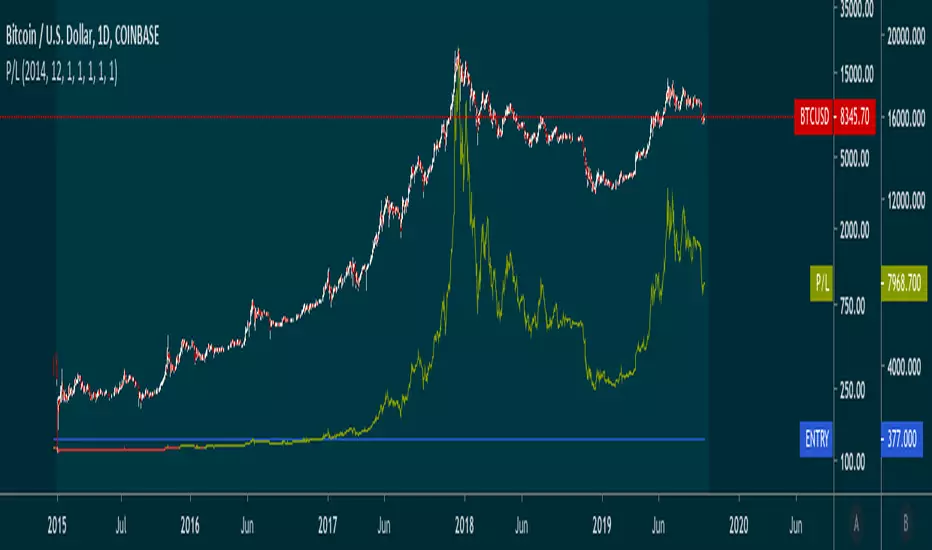
SOLARIZED PRICE ENTRY P/LYou can enter in a date, time and quantity of entry and track a P/L on the trade.
SWING POINTS HOUNDTry's to find possible swing points and reversal points using mutli time frame moving averages and Fibonacci retracement with multiple lengths. Can be used to gauge trends and find potential entry points for trend following strategies. Can also be used to find potential price reversal points and areas of heavy resistance/support.

Use On Renko Chart - Cheap Entry Signals HI BIG PLAYERS,
in according of an enquiry from an user of tradingview I coded this script for free.
This script allows to identify a trend on the basis of higher high & higher low and lower high & lower low. And only after this fulfill conditions the entry signal comes out. The enquiry relates to Renko-charts, this is why it was build more usable on Renko-Charts.
In addition, it is possible to choise yourself the view of highest/lowest peaks and signals in the options.
Please give me a like to this indicator and of course: you are invited to follow me or visit my other scripts in relation to Wolfe Wave and Elliott Wave.
King regards
NXT2017

ATR and RSI Buy / Sell Signal Beta 1.0This has been a long time coming for me.
I need to clean it up and add inputs for others to customize it that's why its protected.
This is configured for US securities.
Goal: Signal when to enter a trade on either side
Method: ATR and 2 RSI signals using:
3 Minute Chart Resolution
MUST have an active (can be hidden) BUILT-IN ATR ; length = 4 and set to RMA smoothing
MUST add the script; THEN go to the scripts settings and change the source to ATR. TV does not allow this to be set to default (that I know of)
I have default settings how I use them but you can modify:
ATR period (Length) =4
ATR multiplier = 0.9 (can edit by 0.1 increments.
The 1st Length/offset/resolution is defaulted to the 1 minute RSI.
The 2nd Length/offset/resolution is defaulted to the 3 minute RSI.
1)
OVERBOUGHT or OVERSOLD
*Please understand I use a length of 4 for this script, that is why the RSI OB/OS limits are so high/low.
Overbought conditions will light yellow if the 1m RSI > 90 and the 3min RSI > 85 and the time is between 09:42am and 16:00
Oversold conditions will light yellow if the 1m RSI < 10 and the 3min RSI < 10 and the time is between 09:42am and 16:00
The script ensures that if it is OB/OS under these conditions than it will not signal a buy or sell.
2)ATR
The script identifies reversals via the close breaking past the previous ATR on the preceding candle. ATR will not move UP on a short and will not move down on a long. It trails the last candle it was not broken.
The script plots labels up and down to identify the start of a reversal. Each start will have an accompanying line to display the continuation of the trend in one direction.
The script displays the value of the STOP as it trails price action. One could continue to mirror this value if you chose to. I use the fib tool for my targets and manage it as P/A demands.
3) RSI SIGNALLING
The script identifies a trend by analyzing BOTH RSI (1m and 3m) measures and requires that the current bar's readouts for BOTH measures are either greater or lower than the preceding candle.
The script also requires that both measures are above or below 50 to signal a trend.
The script will plot the trend as arrows up or down, it will display a (-) when the these conditions are not met.
Requirements to signal a BUY (LIME GREEN) or SELL (BRIGHT RED):
**Ensure your chart candle colors are faded so you can see the signal.**
**Precision is set to 0; remember TV rounds up or down for the visual measure but uses the exact measure for the script**
During the first 12 minutes:
----------------------------------
There are no OB/OS conditions as informed in section 1.
ATR stop line must be present OR the current bar close is higher than the ATR stop of the preceding candle whether it is a long or short stop signal. Quick whips are accounted for.
The current bar close MUST be higher or lower than the preceding candle's HIGH or LOW.
The script MUST identify the RSI signalling as detailed above in section 3.
The candle will light LIME or BRIGHT RED when these conditions are met and will not deceive the statements I have made.
It is important to understand that the signal may become null if the conditions do not persist through the final close of the candle. This means that a snapshot of the indicator does not accurately represent
what it will display at different times during each countdown of EACH 3 minute candle. Sometimes it signals to go long and once RSI gets too high it no longer signals. This is a good thing. Limits FOMO entries.
@ 09:42 until 16:00
-----------------------------------
OB/OS yellow candles will now occur as detailed in section 1.
Candles MUST clear the HIGH or LOW of the TWO preceding candles.
Candles MUST be trending as defined in section 3.
Candles MUST conform the conditions of the ATR stop.
I want to thank;
@pinescripters
@freedom_trader_
and I will even thank the manual lol
I have manually back tested this because I am working on the proper coding to have TV do it for me.
My strategy requires me to cover 25% of my position at 0.5 of the TV ATR 4 length RMA indicator.
Once the first target is hit than the STOP is moved to break-even.
If the target is not hit than my maximum loss is also 0.5 of the TV ATR 4 length RMA indicator.
I tested 3 full days, always on the 3min chart.
I tested 96 trades. All occurring immediately upon signal.
85 were wins and 9 were losses, 88.5% profitable.
Please understand that my intend is to cover enough quickly to cover commission costs and limit losses.
The remaining 75% of my position are sold off in the following pattern unless P/A demands that I override the FIB tool. Let them run when you can.
Position ENTRY
25% cover @ 0.5 x ATR
25% of remaining position cover @ 1.75 x ATR
25% of remaining position cover @ 2.5 x ATR
25% of remaining position cover @ 3.5 x ATR (APX 40% of the initial position)
I will further back test in the near future with an expanded risk.

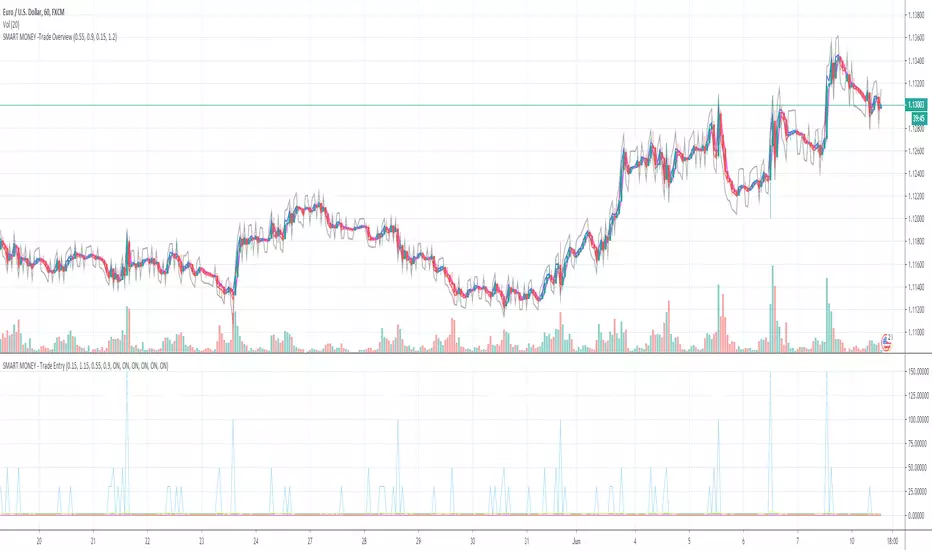
SMART MONEY - Trade EntryThe fundamental idea behind the strategy that this indicator is used to trade, is that when a move in the market is larger than other recent moves, a move in the opposite direction to a degree of teh first move will often follow.
Use this indicator with the "Smart Money - Trade Overview" to show on the chart where Take Profit 1 (White), Take Profit 2 (Pink), Stop Loss (Grey) and Long & Short Entries (Blue and Red) are located.
Adjusting the Entry and Take Profit settings allows for either an agressive, or reserved entry and take profit strategy. The stop loos can also be adjusted. All adjustments are in terms of a factor of the range of the bar in which they are placed.
If using with "Smart Money - Trade Overview, the settings should be adjusted together.
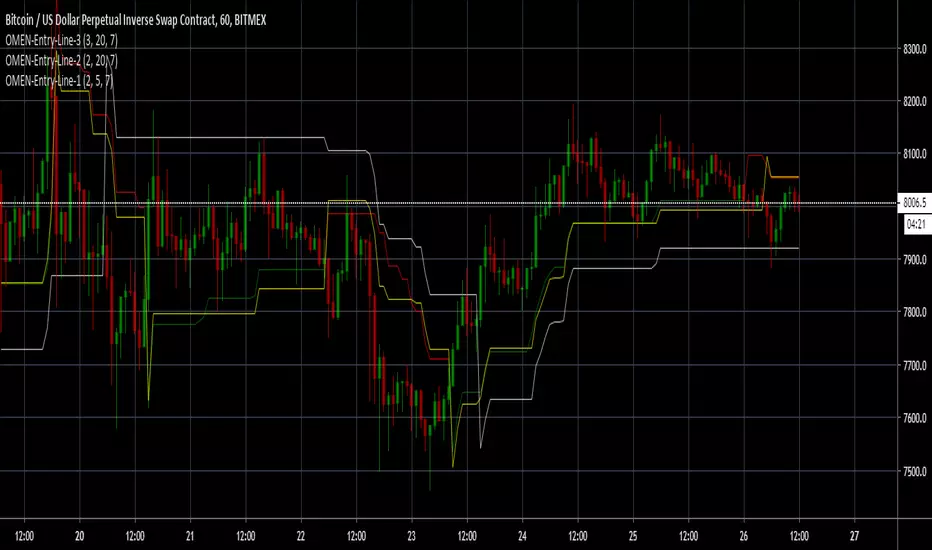
OMEN-Entry-Line-1Entries for longs and short (FASTEST)
USE ALL THE Entry-line indicators for best results.


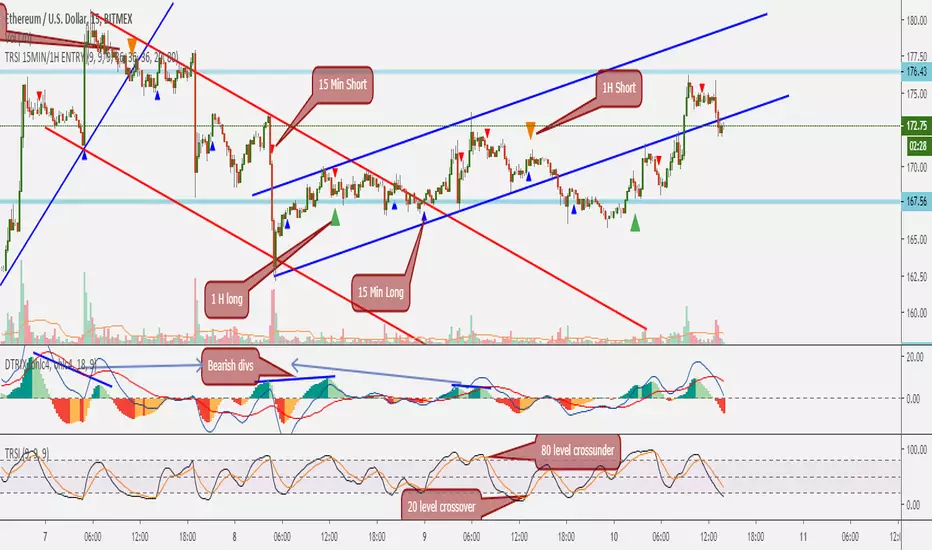
TRSI 15 Min and 1 Hour Entry PointsThis script is based on TRSI and it shows on the graph entry points of TRSI's 20/80 levels crosses
on 15 min and 1 hour timeframes at the same time.
Why do we need it?
if you you trade on 15 min timeframe, you should know what is going on bigger timeframes.
And better enter into position in short tf in direction of bigger tf. Or use tight stop loss or take profit if you are trading
against bigger tf signal.
What else?
Use support and resistence levels and use signal accordingly.
Use this script with TRSI and in combination with other indicators.
Configs:
For 5 min and 15 min:
9-9-9
27-27-27
For 15 min and 1 hour
9-9-9
36-36-36
For 1 hour and 4 hour
9-9-9
36-36-36

Momentum and Trend Strength Entry Exit Pivot StudyUpdated version of previous Momentum Strength Entry Exit Pivot Study:
//************************
// @TheGeeBee - Credit where used
//
//Notes:
//
// Use 1,2,3,5 minute timeframes
// EMA Cross line and offset allows user to alter the sell characteristics where the candle low is above the EMA line and indicates a possible pre-pivot reversal
// Adjust Min and Max pivots based on risk profile
// Single Candle drawdown value represents the maximum size of a single red candle before an Exit Pivot is generated
// ADX Threshold inhibits Pivots when trending signal is below the threshold value
// Percentage Max drawdown since Entry Pivot allows the system to generate an Exit Pivot if the security has dropped X percent from the most recent Entry Pivot point
// Use Bars, Candles (preferred) or Heikin-Ashi
// Multiple Green Bars = BTFD
// Multiple Red bars = If you didn't already get out, do it now!
//
//************************
Allows for Alerts to be set for Entry and Exit Pivots.
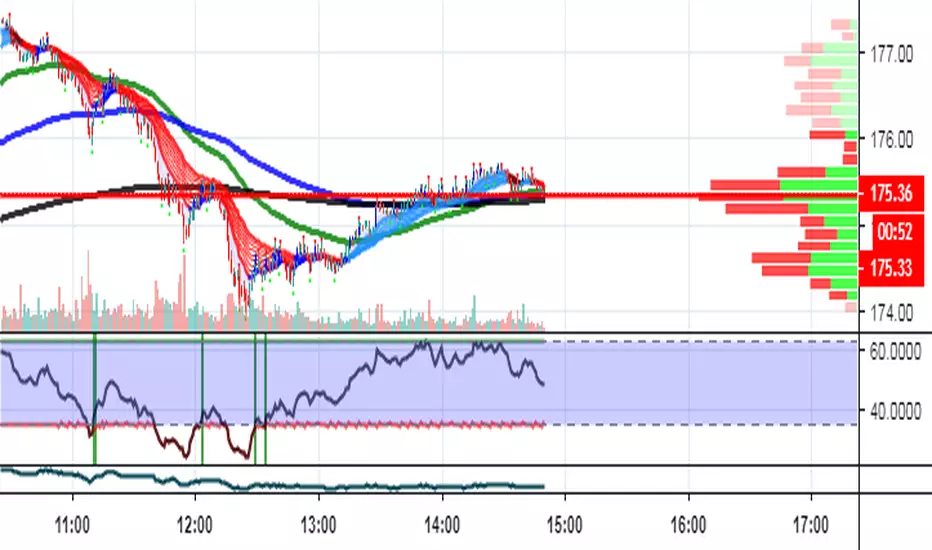
Contrarian Scalping Entry Support// @version=3
// Copyright @ ALEX SHORT
// Indicator Name : Contralian Scalping Entry Support
// alpha tester : Norakichi senpai (PRO TRADER)
// alpha tester : SHINNchan (Prop TRADER)
// Special Thanks WBZ Trading Group
// This indicator support "Contralian Scalping Entry" and "Find ideal Take-Profit point that just like Buying or Selling CLIMAX".
// Attension!!! I strongly reccomend to Verify effectiveness before "REAL TRADE".
// Note1. Downtrend often continue compared to uptrend. So, you might have to change DFMA setting for it. Or you should change reasons/grounds for Scalping Long Entry in long DownTrend.
// Note2. Before applying this indicator or switching resolution, please confirm DFMA resolution Setting. It can't chenge automatically.
// Function1. Difference from Moving Average Arrow from Multi_SMA
// This indicator will plot chart Arrow above or below candle stick when DFMA marked over range.
//
// Function2. When candle touch Quad_Bollinger band, background color will change.
// Function3.
// New Version is "v2.7.1"
1. You can switch Scalping / Swing Mode using by the checkbox. Each DFMA_#1 and #2 can apply different Alert Level.
2. QBB_Circle Alert displaying moved bottom in the main chart.

Contrarian Scalping Entry Support v2.3Update - You can Switch DFMA_Arrow (Different type Resolution and SMA Length)
// @version=2
// Copyright @ ALEX SHORT
// Indicator Name : Contralian Scalping Entry Support
// alpha tester : Norakichi senpai (Santa Prop Norakichi senpai)
// Special Thanks WBZ Trading Group
// This indicator support "Contralian Scalping Entry" and "Find ideal Take-Profit point that just like Buying or Selling CLIMAX".
// Attension!!! I strongly reccomend to Verify effectiveness before "REAL TRADE".
// Note1. Downtrend often continue compared to uptrend. So, you might have to change DFMA setting for it. Or you should change reasons/grounds for Scalping Long Entry in long DownTrend.
// Note2. Before applying this indicator or switching resolution, please confirm DFMA resolution Setting. It can't chenge automatically.
// Function1. Difference from Moving Average Arrow from Multi_SMA
// This indicator will plot chart Arrow above or below candle stick when DFMA marked over range.
//
// Function2. When candle touch Quad_Bollinger band, background color will chengeing.
// Function3.
