Adaptive Risk Management [sgbpulse]1. Introduction:
Adaptive Risk Management is an advanced indicator designed to provide traders with a comprehensive risk management tool directly on the chart. Instead of relying on complex manual calculations, the indicator automates all critical steps of trade planning. It dynamically calculates the estimated Entry Price , the Stop Loss location, the required Position Size (Quantity) based on your capital and risk limits, and the three Take Profit targets based on your defined Reward/Risk ratios. The indicator displays all these essential data points clearly and visually on the chart, ensuring you always know the potential risk-reward profile of every trade.
ARM : The A daptive R isk M anagement every trader needs to ARM themselves with.
2. The Critical Importance of Risk Management
Proper risk management is the cornerstone of successful trading. Consistent profitability in the market is impossible without rigorously defining risk limits.
Risk Control: This starts by setting the maximum risk amount you are willing to lose in a single trade (Risk per Trade), and limiting the total capital allocated to the position (Max Capital per Trade).
Defining Boundaries (Stop Loss & Take Profit): It is mandatory to define a technical Stop Loss and a Take Profit target. A fundamental rule of risk management is that the Reward/Risk Ratio (R/R) must be a minimum of 1:1.
3. Core Features, Adaptivity, and Customization
The Adaptive Risk Management indicator is engineered for use across all major trading styles, including Swing Trading, Intraday Trading, and Scalping, providing consistent risk control regardless of the chosen timeframe.
Real-Time Dynamic Adaptivity: The indicator calculates all risk management parameters (Entry, Stop Loss, Quantity) dynamically with every new bar, thus adapting instantly to changing market conditions.
Trend Direction Adjustment: Define the analysis direction (Long/Uptrend or Short/Downtrend).
Intraday Session Data Control: Full control over whether lookback calculations will include data from Extended Trading Hours (ETH), or if the daily calculations will start actively only from the first bar of Regular Trading Hours (RTH).
Status Validation: The indicator performs critical status checks and displays clear Warning Messages if risk conditions are not met.
4. Intuitive Visualization and Real-Time Data
Dynamic Tracking Lines: The Entry Price and Stop Loss lines are updated with every new bar. Crucially, the length of these lines dynamically reflects the calculation's lookback range (e.g., the extent of Lookback Bars or the location of the confirmed Pivot Point), providing a visual anchor for the calculated price.
Risk and Reward Zones: The indicator creates a graphical background fill between Entry and Stop Loss (marked with the risk color) and between Entry and the Reward Targets (marked with the reward color).
Essential Information Labels: Labels are placed at the end of each line, providing critical data: Estimated Entry Price, Stock/Contract Quantity (Quantity), Total Entry Amount, Estimated Stop Loss, Risk per Share, Total Financial Risk (Risk Amount), Exit Amount, Estimated Take Profit 1/2/3, Reward/Risk Ratio 1/2/3, Total Reward 1/2/3, TP Exit Amount 1/2/3.
4.1. Data Window Metrics (16 Full Series)
The indicator displays 16 full data series in the TradingView Data Window, allowing precise tracking of every calculation parameter:
Entry Data: Estimated Entry, Quantity, Entry Amount.
Risk Data (Stop Loss): Estimated Stop Loss, Risk per Share, Risk Amount, Exit Amount.
Reward Data (Take Profit): Estimated Take Profit 1/2/3, Reward/Risk Ratio 1/2/3, Total Reward 1/2/3, TP Exit Amount 1/2/3.
4.2. Instant Tracking in the Status Line
The indicator displays 6 critical parameters continuously in the indicator's Status Line: Estimated Entry, Quantity, Estimated Stop Loss, Estimated Take Profit 1/2/3.
5. Detailed Indicator Inputs
5.1 General
Focused Trend: Defines the analysis direction (Uptrend / Downtrend).
Max Capital per Trade: The maximum amount allocated to purchasing stocks/contracts (in account currency).
Risk per Trade: The maximum amount the user is willing to risk in this single trade (in account currency).
ATR Length: The lookback period for the Average True Range (ATR) calculation.
5.2 Intraday Session Data Control
Regular Hours Limitation : If enabled, all daily lookback calculations (for Entry/Stop Loss anchor points) will begin strictly from the first Regular Trading Hours (RTH) bar. This limits the lookback range to the current RTH session, excluding preceding Extended Trading Hours (ETH) data. Only relevant for Intraday charts. Default: False (Off)
5.3 Entry Inputs
Entry Method: Selects the entry price calculation method:
Current Price: Uses the closing price of the current bar as the estimated entry point (Market Entry).
ATR Real Bodies Margin :
- Uptrend: Calculates the Maximum Real Body over the lookback period + the calculated safety margin.
- Downtrend: Calculates the Minimum Real Body over the lookback period - the calculated safety margin.
ATR Bars Margin :
- Uptrend: Calculates the Maximum High price over the lookback period + the calculated safety margin.
- Downtrend: Calculates the Minimum Low price over the lookback period - the calculated safety margin.
Lookback Bars: The number of bars used to calculate the extremes in the ATR-based entry methods (Relevant only for ATR Real Bodies Margin and ATR Bars Margin methods).
ATR Multiplier (Entry): The multiplier applied to the ATR value. The result of the multiplication is the calculated safety margin used to determine the estimated Entry Price.
5.4 Risk Inputs (Stop Loss)
Risk Method: Selects the Stop Loss price calculation method.
ATR Current Price Margin :
- Uptrend: Entry Price - the calculated safety margin.
- Downtrend: Entry Price + the calculated safety margin.
ATR Current Bar Margin :
- Uptrend: Current Bar's Low price - the calculated safety margin.
- Downtrend: Current Bar's High price + the calculated safety margin.
ATR Bars Margin :
- Uptrend: Lowest Low over lookback period - the calculated safety margin.
- Downtrend: Highest High over lookback period + the calculated safety margin.
ATR Pivot Margin :
- Uptrend: The first confirmed Pivot Low point - the calculated safety margin.
- Downtrend: The first confirmed Pivot High point + the calculated safety margin.
Lookback Bars: The lookback period for finding the extreme price used in the 'ATR Bars Margin' calculation.
ATR Multiplier (Risk): The multiplier applied to the ATR value. The result of the multiplication is the calculated safety margin used to place the estimated Stop Loss. Note: If set to 0, the Stop Loss will be placed exactly at the technical anchor point, provided the Minimum Margin Value is also 0.
Minimum Margin Value: The minimum price value (e.g., $0.01) the Stop Loss margin buffer must be.
Pivot (Left / Right): The number of bars required on either side of the pivot bar for confirmation (relevant only for the ATR Pivot Margin method).
5.5 Reward Inputs (Take Profit)
Show Take Profit 1/2/3: ON/OFF switch to control the visibility of each Take Profit target.
Reward/Risk Ratio 1/ 2/ 3: Defines the R/R ratio for the profit target. Must be ≥1.0.
6. Indicator Status/Warning Messages
In situations where the Stop Loss location cannot be calculated logically and validly, often caused by a mismatch between the configured Focused Trend (Uptrend/Downtrend) and the actual price action, the indicator will display a warning message, explaining the reason and suggesting corrective action.
Status Message 1: Pivot reference unavailable
Condition: The Stop Loss is set to the "ATR Pivot Margin" method, but the anchor point (Pivot) is missing or inaccessible.
Message Displayed: "Pivot reference unavailable. Wait for valid price action, or adjust the Regular Hours Limitation setting or Pivot Left/Right inputs."
Status Message 2: Calculated Stop Loss is unsafe
Condition: The calculated Stop Loss is placed illogically or unsafely relative to the trend direction and the Entry price.
Message Displayed: "Calculated Stop Loss is unsafe for current trend. Wait for valid price action or adjust SL Lookback/Multiplier."
7. Summary
The Adaptive Risk Management (ARM) indicator provides a seamless and systematic approach to trade execution and risk control. By dynamically automating all critical trade parameters—from Entry Price and Stop Loss placement to Position Sizing and Take Profit targets—ARM removes emotional bias and ensures every trade adheres strictly to your predefined risk profile.
Key Benefits:
Systematic Risk Control: Strict enforcement of maximum capital allocation and risk per trade limits.
Adaptivity: Dynamic calculation of prices and quantities based on real-time market data (ATR and Lookback).
Clarity and Trust: Clear on-chart visualization, precise data metrics (16 series), and unambiguous Status/Warning Messages ensure transparency and reliability.
ARM allows traders to focus on strategy and analysis, confident that their execution complies with the core principles of professional risk management.
Important Note: Trading Risk
This indicator is intended for educational and informational purposes only and does not constitute investment advice or a recommendation for trading in any form whatsoever.
Trading in financial markets involves significant risk of capital loss. It is important to remember that past performance is not indicative of future results. All trading decisions are your sole responsibility. Never trade with money you cannot afford to lose.
Cari dalam skrip untuk "entry"

Alt buy signal 1H Entry + 4H Confirm (MACD + Stoch RSI + HMA)This indicator is a multi-timeframe (MTF) analysis tool designed for the ALT trading , capturing entry signals on the 1-hour (1H) timeframe and confirming trends on the 4-hour (4H) timeframe. It combines MACD, Stoch RSI, and Hull Moving Average (HMA) to identify precise buy opportunities, particularly at reversal points after a downtrend or during trend shifts. It visually marks both past and current BUY signals for easy reference.
Key Features:
1H Entry Signal (Early Ping): Triggers on a MACD golden cross (below 0) combined with a Stoch RSI oversold cross (below 20), offering an initial buy opportunity.
4H Trend Confirmation (Entry Ready): Validates the trend with a 4H MACD histogram rising (in negative territory) or a golden cross, plus a Stoch RSI turn-up (above 30).
Past BUY Display: Labels past data points where these conditions were met as "1H BUY" or "FULL BUY," facilitating backtesting.
HMA Filter: Optional HMA(16) to confirm price breakouts, enhancing trend validation.
Purpose: Ideal for short-term scalping and swing trading. Supports a two-step strategy: initial partial entry on 1H signals, followed by additional entry on 4H confirmation.
Usage Instructions
Installation: Add the indicator to an IMX/USDT 1H chart on TradingView.
Signal Interpretation:
lime "1H BUY": 1H conditions met, consider initial entry (stop-loss: 3-5% below recent low).
green "FULL BUY": 1H+4H conditions met, confirm trend for additional entry (take-profit: 10% below recent swing high).
Customization: Adjust TF (1H/4H), MACD/Stoch RSI parameters, and HMA usage via the input settings.
Alert Setup: Enable alerts for "ENTRY READY" (1H+4H) or "EARLY PING" (1H only) conditions.
Advantages
Accuracy: Reduces false signals by combining MACD golden cross below 0 with Stoch RSI oversold conditions.
Dual Confirmation: 1H for quick timing and 4H for trend validation, improving risk management.
Visualization: Past BUY points enable easy backtesting and pattern recognition.
Flexibility: 4H confirmation mode adjustable (histogram rise or golden cross).
Limitations
Timeframe Dependency: Optimized for 1H charts; may not work on other timeframes.
Market Conditions: Potential whipsaws in sideways markets; additional filters (e.g., RSI > 50) recommended.
Manual Management: Stop-loss and take-profit require user discretion.

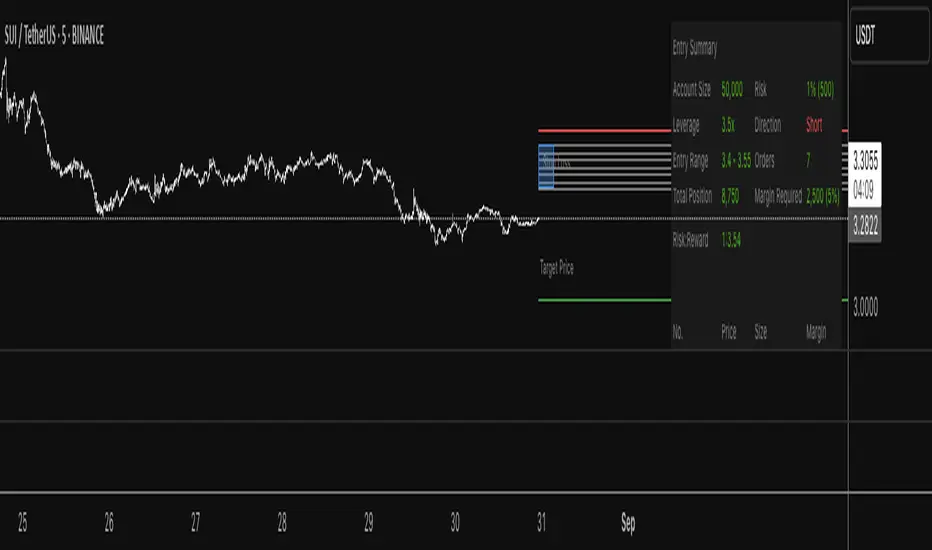
Progressive Entry Position Sizer v3Progressive Entry Position Sizer (PEPS) - DEVELOPMENT VERSION
⚠️ IMPORTANT DISCLAIMER: This indicator is currently in development and should NOT be relied upon for trading accuracy. Use at your own risk and always verify calculations independently before making any trading decisions.
Overview:
The Progressive Entry Position Sizer (PEPS) is a risk management tool designed to help traders plan multiple entry positions with progressive scaling. This indicator calculates position sizes and margin requirements across multiple entry levels while maintaining consistent risk exposure.
Key Features:
Progressive Risk Scaling: Uses a token-based system (1, 2, 3, 4, 5...) to progressively increase position sizes at each entry level
Leverage Support: Accommodates leverage up to 50x with proper margin calculations
Dollar-Based Position Sizing: Displays position values in dollar amounts rather than share quantities
Visual Entry Planning: Shows entry zones, target, and stop loss levels with extended lines
Comprehensive Risk Table: Detailed breakdown of each entry with position values and margin requirements
How It Works:
Set your account balance, risk percentage, and leverage
Define primary entry, final entry, target, and stop loss prices
Choose number of limit orders (2-8)
The indicator calculates evenly distributed entry prices with progressive position sizing
Each subsequent entry receives more "risk tokens" resulting in larger position sizes
Use Cases:
Planning DCA (Dollar Cost Averaging) strategies
Risk management for leveraged positions
Visualizing multi-entry trading setups
Educational purposes for understanding progressive scaling
⚠️ Development Status:
This script is actively being developed and may contain bugs or calculation errors. Always:
Verify all calculations manually
Test thoroughly on paper trades first
Consult with financial professionals
Never risk more than you can afford to lose
Feedback Welcome:
As this is a development version, user feedback and suggestions for improvements are greatly appreciated.
This indicator is for educational and planning purposes only. Not financial advice.
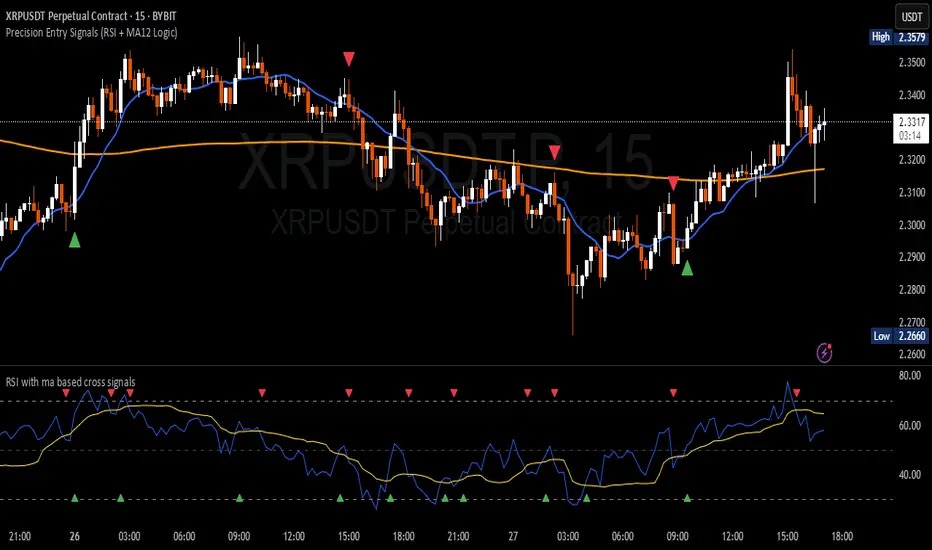
Precision Entry Signals (RSI + MA12 Logic)Description:
This script provides precise entry signals based on a clean confluence of MA12 breakouts and RSI momentum, filtered by a VWMA (Volume-Weighted Moving Average) of the RSI.
-----------------------------------------------------------------------------------------------------------------
🔹 Long entry conditions:
- Candle opens below the 12-period MA and closes above it
- RSI crosses above its VWMA
- Previous candle is bearish (additional confirmation)
🔹 Short entry conditions:
- Candle opens above the 12-period MA and closes below it
- RSI crosses below its VWMA
- Previous candle is bullish
----------------------------------------------------------------------------------------------------------------
Once a signal is confirmed, the script automatically draws:
Entry line (at close price)
Stop Loss line (just below recent lows for long, or above highs for short)
Take Profit 1 (1R)
Take Profit 2 (2R)
Labels are attached to the lines for clarity: ENTRY, SL, TP1, and TP2.
⚠️ Note: This tool only provides entry signals and visual risk/reward guidance. It does not manage exits dynamically. Manual trade management is recommended.
This script is intended for active intraday traders, especially on lower timeframes like 3-minute, 5-minute or 15-minute charts.
---------------------------------------------------------------------------------------------------------------
🔧 Recommended companion indicator:
For better confirmation and visual tracking of the RSI/VWMA cross logic, it is strongly recommended to also use the companion script:
🔹 Relative Strength Index (with MA based cross signals)
→ Shows RSI and its moving average visually, with triangle plots on every valid cross.
→ Matches exactly the RSI/VWMA behavior used in this entry signal script.
📌 Important:
After adding the RSI script to your chart, make sure to set:
RSI Length = 14
MA Type = VWMA
MA Length = 20
This ensures it visually matches the logic used by the entry signal script.
Both indicators are fully open source and meant to be used together — especially when trading manually.
Average Entry Price Calculator# Average Entry Price Calculator
This powerful indicator helps you track your average entry price across multiple positions, displaying it clearly on your chart with customizable lines and labels.
## Features:
• Calculate average entry price for up to 5 different positions
• Display current price and profit/loss calculations
• Show percentage and absolute change from your average entry
• Customizable line styles, colors, and label positions
• Track your entry prices with clear visual references
## How It Works:
Enter your position details (entry price and amount in USDT), and the indicator will calculate your average entry price, displaying it as a horizontal line on your chart. The indicator also shows your individual entry prices as separate lines, making it easy to visualize your overall position.
## Perfect For:
• DCA (Dollar-Cost Averaging) strategies
• Position tracking across multiple entries
• Risk management and profit taking
• Visualizing entry zones on your chart
## Instructions:
1. Add the indicator to your chart
2. Enter your position details (price and amount)
3. Customize the visual appearance as needed
4. Use the displayed average entry line for decision making
All calculations are done locally in your browser - no sensitive data is transmitted or stored.
Enjoy more informed trading decisions with this essential position tracking tool!

Austin MTF EMA Entry PointsAustin MTF EMA Entry Points
Overview
The Austin MTF EMA Entry Points is a custom TradingView indicator designed to assist traders in identifying high-probability entry points by combining multiple time frame (MTF) analysis. It leverages exponential moving averages (EMAs) from the daily, 1-hour, and 15-minute charts to generate buy and sell signals that align with the overall trend.
This indicator is ideal for traders who:
Want to trade in the direction of the broader daily trend.
Seek precise entry points on lower time frames (1H and 15M).
Prefer using EMAs as their main trend-following tool.
How It Works
Daily Trend Filter:
The indicator calculates the 50 EMA on the daily chart.
The daily EMA acts as the primary trend filter:
If the current price is above the daily 50 EMA, the trend is bullish.
If the current price is below the daily 50 EMA, the trend is bearish.
Lower Time Frame Entry Points:
The indicator calculates the 20 EMA on both the 1-hour (1H) and 15-minute (15M) time frames.
Buy and sell signals are generated when the price aligns with the trend on all three time frames:
Buy Signal: Price is above the daily 50 EMA and also above the 20 EMA on both the 1H and 15M charts.
Sell Signal: Price is below the daily 50 EMA and also below the 20 EMA on both the 1H and 15M charts.
Visual and Alert Features:
Plot Lines:
The daily 50 EMA is plotted in yellow for easy identification of the main trend.
The 20 EMA from the 1H chart is plotted in blue, and the 15M chart's EMA is in purple for comparison.
Buy/Sell Markers:
Green "Up" arrows appear for buy signals.
Red "Down" arrows appear for sell signals.
Alerts:
Alerts notify users when a buy or sell signal is triggered, making it easier to act on trading opportunities in real-time.
How to Use the Indicator
Identify the Main Trend:
Check the relationship between the price and the daily 50 EMA (yellow line):
Only look for buy signals if the price is above the daily 50 EMA.
Only look for sell signals if the price is below the daily 50 EMA.
Wait for Lower Time Frame Alignment:
For a valid signal, ensure that the price is also above or below the 20 EMA (blue and purple lines) on both the 1H and 15M time frames:
This alignment confirms short-term momentum in the same direction as the daily trend.
Act on Signals:
Use the arrows as visual cues for entry points:
Enter long trades on green "Up" arrows.
Enter short trades on red "Down" arrows.
The alerts will notify you of these signals, so you don’t have to monitor the chart constantly.
Exit Strategy:
Use your preferred stop-loss, take-profit, or trailing stop strategy.
You can also exit trades if the price crosses back below/above the daily 50 EMA, signaling a potential reversal.
Use Cases
Swing Traders: Use the daily trend filter to trade in the direction of the dominant trend, while using 1H and 15M signals to fine-tune entries.
Day Traders: Leverage the 1H and 15M time frames to capitalize on short-term momentum while respecting the broader daily trend.
Position Traders: Monitor the indicator to determine potential reversals or significant alignment across time frames.
Customizable Inputs
The indicator includes the following inputs:
Daily EMA Length: Default is 50. Adjust this to change the length of the trend filter EMA.
Lower Time Frame EMA Length: Default is 20. Adjust this to change the short-term EMA for the 1H and 15M charts.
Time Frames: Hardcoded to "D", "60", and "15", but you can modify the script for different time frames if needed.
Example Scenarios
Buy Signal:
Price is above the daily 50 EMA.
Price crosses above the 20 EMA on both the 1H and 15M time frames.
A green "Up" arrow is displayed, and an alert is triggered.
Sell Signal:
Price is below the daily 50 EMA.
Price crosses below the 20 EMA on both the 1H and 15M time frames.
A red "Down" arrow is displayed, and an alert is triggered.
Strengths and Limitations
Strengths:
Aligns trades with the higher time frame trend for increased probability.
Uses multiple time frame analysis to identify precise entry points.
Visual signals and alerts make it easy to use in real-time.
Limitations:
May produce fewer signals in choppy or ranging markets.
Requires discipline to avoid overtrading when conditions are unclear.
Lag in EMAs could result in late entries in fast-moving markets.
Final Notes
The Austin MTF EMA Entry Points indicator is a powerful tool for traders who value multiple time frame alignment and trend-following strategies. While it simplifies decision-making, it is always recommended to backtest and practice proper risk management before using it in live markets.
Try it out and make smarter, trend-aligned trades today! 🚀

Adjustable Entry Price Levels by Sobhi v6Adjustable Entry Price Levels", is designed to display customizable price levels on a chart, allowing traders to visualize key price zones relative to a chosen entry price. Here's a detailed breakdown of its functionality:
Purpose
The indicator helps traders create and manage equidistant price levels (both above and below a selected entry price). These levels can assist in planning trades, setting stop-loss and take-profit levels, or identifying key market zones for decision-making.
Features
Entry Price Input:
Users can specify a starting price (Entry Price) to base the levels on.
Adjustable Distance Between Levels:
Levels are spaced at a user-defined interval (Distance), creating equidistant horizontal lines.
Number of Levels:
Users can select how many levels to display above and below the entry price (Number of Levels).
Line Customization:
Style: Choose between Solid, Dotted, or Dashed lines.
Color: Customize the color for upward and downward levels (Line Color Up and Line Color Down).
Thickness: Adjust line thickness (Line Width).
Label Customization:
Visibility: Option to show or hide labels on each level (Show Labels).
Font Size: Set the size of the text for level labels (Label Font Size).
Colors: Separate customization for labels above (Label Color Up) and below (Label Color Down) the entry price.
Extended Line Display:
The lines extend backward (Extend Bars Back) and forward (Extend Bars Forward) to ensure visibility over a larger section of the chart.
Visualization
Upward Levels:
Represented by blue (default) horizontal lines above the entry price.
Labels display the price value of each level in the same color.
Downward Levels:
Represented by red (default) horizontal lines below the entry price.
Labels display the price value of each level in the same color.
Example Use Case
Scenario 1: Support and Resistance Planning
A trader can define a key level (Entry Price) and observe nearby support and resistance zones using the calculated price levels.
Scenario 2: Risk Management
The indicator helps in visualizing stop-loss and take-profit areas equidistant from the entry price.
Scenario 3: Breakout Targets
Traders can use the levels to anticipate potential breakout or breakdown targets.
Customization Options
This indicator is highly customizable, making it versatile for different trading strategies. Traders can tweak:
The visual appearance of the levels (style, color, width).
The number of levels and their spacing.
Whether labels are displayed and their style.

Granville Entry GuideThis indicator is designed to identify trade entry points using patterns 2 and 3 of the Granville's Law. It is compatible with version 6.
Determining Entry Points
・ Long Entry : When the medium-term moving average is rising, if the stock price falls close to or below the moving average and then begins to rise, with that bar being a bullish candle, it is determined as an entry point. At this time, a red circle will be displayed above the bar.
・ Short Entry : When the medium-term moving average is falling, if the stock price rises close to or above the moving average and then begins to fall, with that bar being a bearish candle, it is determined as an entry point. At this time, a blue circle will be displayed below the bar.
Trend Filter
Entry points will only be displayed if the following trend conditions are met:
・In an uptrend, the order of moving averages should be: short-term moving average, medium-term moving average, and long-term moving average from top to bottom. In a downtrend, the order should be: long-term moving average, medium-term moving average, and short-term moving average from top to bottom. The order of the short-term moving average is flexible.
・The medium-term and long-term moving averages should be inclined in the direction of the trend. The inclination of the short-term moving average is flexible.
Adjusting Parameters
・ Stock Selection : You can choose whether to use the stock price from candlesticks or the short-term moving average for determining entry points. Selecting candlesticks allows for quicker determination but increases noise, while selecting the short-term moving average slows down determination but reduces noise. The default value is the short-term moving average.
・ Determining Pullbacks or Retracements : This is determined by the number of bars on either side of the lowest point of the pullback. Increasing the number of bars reduces noise but may result in missed opportunities. The default values are 3 bars on the left and 1 bar on the right.
・ Use of Trend Filter : You can choose whether to use the trend filter. The default setting is to use it.
・ Conditions for Moving Average Inclination : You can choose whether to include the trend direction inclination in the trend filter conditions. The default setting is to include it.
・ Bar Background Color : The trend filter is displayed with the bar's background color, but it can also be set to not display.
このインジケーターは、グランビルの法則のパターン2とパターン3を利用して、トレードのエントリーポイントを見つけるためのものです。version6に対応しています。
エントリーポイントの判定方法
ロングエントリー :中期移動平均線が上昇しているとき、株価が移動平均線の近くまで落ちるか、割り込んだ後に上昇を始め、そのバーが陽線である場合にエントリーポイントと判定します。このとき、赤い丸がバーの上に表示されます。
ショートエントリー :中期移動平均線が下落しているとき、株価が移動平均線の近くまで上昇するか、上抜けた後に下落を始め、そのバーが陰線である場合にエントリーポイントと判定します。このとき、青い丸がバーの下に表示されます。
トレンドフィルター
エントリーポイントは、次のトレンド条件を満たす場合のみ表示されます。
・上昇トレンドの場合、移動平均線が上から中期移動平均線、長期移動平均線の順になっている。下降トレンドの場合、移動平均線が上から長期移動平均線、中期移動平均線の順になっている。なお短期移動平均線の順番は任意です。
・中期移動平均線と長期移動平均線がトレンド方向に傾いている。なお短期移動平均線の傾きは任意です。
パラメーターの調整方法
・ 株価の選択 : エントリーポイントの判定に使用する株価を、ローソク足か短期移動平均線から選べます。ローソク足を選ぶと判定が早くなりますがノイズが増え、短期移動平均線を選ぶと判定が遅くなりますがノイズが減ります。初期値は短期移動平均線です。
・ 押しや戻りの判定 : 押しの最下点の左右のバーの数で判定します。バーの数を増やすとノイズが減りますが、機会を逃すこともあります。初期値は左が3、右が1です。
・ トレンドフィルターの使用 : トレンドフィルターを使うかどうかを選べます。初期値は使用する設定です。
・ 移動平均線の傾きの条件 : トレンドフィルターのうち、トレンド方向の傾きを条件に入れるかどうかを選べます。初期値は条件に入れる設定です。
バーの背景色: トレンドフィルターはバーの背景色で表示されますが、非表示に設定することもできます。

EMA Cross Fibonacci Entry with RetracementThe EMA Cross Fibonacci Entry with Retracement is a trading strategy that combines two popular technical analysis tools: Exponential Moving Averages (EMAs) and Fibonacci retracement levels. Here's a brief overview of how this strategy typically works:
### Exponential Moving Averages (EMAs)
1. **EMAs Calculation**: EMAs give more weight to recent price data, making them more responsive to price changes. Commonly used periods for EMAs in this strategy are the 50-period and 200-period EMAs.
2. **EMA Cross**: The strategy looks for a "golden cross" (short-term EMA crosses above the long-term EMA) as a potential buy signal, and a "death cross" (short-term EMA crosses below the long-term EMA) as a potential sell signal.
### Fibonacci Retracement Levels
1. **Fibonacci Retracement**: This tool is used to identify potential support and resistance levels based on the Fibonacci sequence. The key retracement levels are 23.6%, 38.2%, 50%, 61.8%, and 78.6%.
2. **Drawing Retracement Levels**: Traders draw Fibonacci retracement levels from a significant peak to a significant trough (or vice versa) to identify potential retracement levels where the price might reverse.
### Combining EMA Cross with Fibonacci Retracement
1. **Identify EMA Cross**: First, traders look for an EMA cross. For example, a golden cross where a shorter EMA (e.g., 50 EMA) crosses above a longer EMA (e.g., 200 EMA) suggests a bullish trend.
2. **Wait for Retracement**: After identifying a cross, traders wait for the price to retrace to a Fibonacci level. The key levels to watch are 38.2%, 50%, and 61.8%.
3. **Entry Point**: The entry point is when the price retraces to a Fibonacci level and shows signs of reversal (e.g., bullish candlestick patterns, support at Fibonacci levels). This is typically when traders enter a long position.
4. **Confirmation with EMA**: Ensure that the EMAs support the trend. For a buy entry, the short-term EMA should remain above the long-term EMA.
### Example of a Bullish Entry
1. **Golden Cross**: 50 EMA crosses above 200 EMA.
2. **Retracement**: Price retraces to the 38.2% Fibonacci level.
3. **Entry Signal**: At the 38.2% level, a bullish candlestick pattern (e.g., hammer) forms, indicating potential support.
4. **Entry Point**: Enter a long position at the close of the bullish candlestick.
### Risk Management
1. **Stop Loss**: Place a stop loss below the next Fibonacci retracement level or below the recent swing low to limit potential losses.
2. **Take Profit**: Set a take profit target based on a risk-reward ratio, previous resistance levels, or further Fibonacci extensions.
### Conclusion
The EMA Cross Fibonacci Entry with Retracement strategy is a systematic approach to identifying entry points in a trending market. By combining the responsiveness of EMAs with the predictive power of Fibonacci retracement levels, traders aim to enter trades at optimal points, increasing their chances of success while managing risk effectively.

Fibonacci Entry SignalsЭтот индикатор "Fibonacci Entry Signals" помогает определить точки входа в покупку и продажу на основе уровней Фибоначчи и скользящей средней.
Ключевые особенности:
Уровни Фибоначчи: Индикатор рисует на графике несколько уровней Фибоначчи, таких как 38.2%, 50% и 61.8%. Эти уровни определяются на основе крайних точек цены за последние 100 баров. Уровень 0% соответствует самой низкой точке, а уровень 100% - самой высокой.
Точки входа: При наступлении условий входа в покупку или продажу, индикатор отмечает на графике точки входа в виде треугольников вверх или вниз соответственно. Условия входа в покупку определяются, когда цена пересекает уровень Фибоначчи 38.2% вверх и находится выше скользящей средней за последние 50 баров. Условия входа в продажу аналогичны, но цена пересекает уровень Фибоначчи 61.8% вниз.
Этот индикатор может быть полезен для трейдеров, которые используют уровни Фибоначчи в своей торговой стратегии и ищут точки входа в рынок. Однако, перед использованием на реальном счете, рекомендуется провести тщательное тестирование и адаптацию к своим индивидуальным потребностям и стратегии торговли.
Давайте рассмотрим, как пользоваться индикатором "Fibonacci Entry Signals":
Установка на график: Для начала необходимо добавить индикатор на график вашего торгового актива. Вы можете сделать это, выбрав его из списка индикаторов в торговой платформе.
Интерпретация уровней Фибоначчи: Индикатор отображает на графике несколько уровней Фибоначчи, таких как 38.2%, 50% и 61.8%. Понимание этих уровней поможет вам определить возможные точки входа в рынок. Обычно, уровень 38.2% используется как уровень поддержки, а уровень 61.8% - как уровень сопротивления.
Точки входа в покупку и продажу: Индикатор помогает определить моменты, когда можно войти в покупку или продажу. При наступлении условий входа в покупку, индикатор отмечает на графике точку входа в виде зеленого треугольника вверх. При наступлении условий входа в продажу, индикатор отмечает точку входа на графике в виде красного треугольника вниз.
Управление позициями: После получения сигнала от индикатора, решение о входе в позицию остается за вами. Важно помнить, что индикатор является только инструментом, который помогает в принятии решений, и его сигналы всегда следует подтверждать другими аспектами вашей торговой стратегии, такими как подтверждение другими индикаторами или анализ фундаментальных данных.
Тестирование и адаптация: Прежде чем использовать индикатор на реальном счете, рекомендуется провести тщательное тестирование на исторических данных и адаптировать его к своим индивидуальным торговым потребностям и стратегии.
Индикатор "Fibonacci Entry Signals" может быть полезным инструментом для трейдеров, которые используют уровни Фибоначчи в своей торговой стратегии и ищут точки входа в рынок.
his "Fibonacci Entry Signals" indicator helps identify entry points for buying and selling based on Fibonacci levels and moving averages.
Key features:
Fibonacci Levels: The indicator draws several Fibonacci levels on the chart, such as 38.2%, 50%, and 61.8%. These levels are determined based on the extreme price points over the last 100 bars. The 0% level corresponds to the lowest point, and the 100% level corresponds to the highest point.
Entry Points: When conditions for buying or selling occur, the indicator marks entry points on the chart as upward or downward triangles, respectively. Entry conditions for buying are determined when the price crosses above the 38.2% Fibonacci level and remains above the 50-bar moving average. Entry conditions for selling are similar, but the price crosses below the 61.8% Fibonacci level.
This indicator can be useful for traders who use Fibonacci levels in their trading strategy and look for entry points in the market. However, before using it on a real account, it is recommended to conduct thorough testing and adaptation to your individual trading needs and strategy.
Let's look at how to use the "Fibonacci Entry Signals" indicator:
Installation on the Chart: First, you need to add the indicator to the chart of your trading asset. You can do this by selecting it from the list of indicators in the trading platform.
Interpreting Fibonacci Levels: The indicator displays several Fibonacci levels on the chart, such as 38.2%, 50%, and 61.8%. Understanding these levels will help you identify potential entry points in the market. Usually, the 38.2% level is used as support, and the 61.8% level is used as resistance.
Entry Points for Buying and Selling: The indicator helps identify moments when you can enter buying or selling positions. When conditions for buying occur, the indicator marks the entry point on the chart as a green upward triangle. When conditions for selling occur, the indicator marks the entry point on the chart as a red downward triangle.
Position Management: After receiving a signal from the indicator, the decision to enter a position is up to you. It's important to remember that the indicator is just a tool to help you make decisions, and its signals should always be confirmed by other aspects of your trading strategy, such as confirmation from other indicators or fundamental analysis.
Testing and Adaptation: Before using the indicator on a real account, it's recommended to conduct thorough testing on historical data and adapt it to your individual trading needs and strategy.
The "Fibonacci Entry Signals" indicator can be a useful tool for traders who use Fibonacci levels in their trading strategy and look for entry points in the market.

[blackcat] L1 Ichimoku Cloud with Entry SignalsThe Ichimoku Cloud is a technical analysis indicator used to identify potential trend reversals, support and resistance levels, and generate entry and exit signals in financial markets. It was developed by a Japanese journalist named Goichi Hosoda, who went by the pen name Ichimoku Sanjin.
The Ichimoku Cloud consists of several components, including the Tenkan-sen (Conversion Line), Kijun-sen (Base Line), Senkou Span A (Leading Span A), Senkou Span B (Leading Span B), and the Cloud. The Tenkan-sen and Kijun-sen lines are calculated based on the average of the highest high and lowest low over a specific period of time. The Senkou Span A is the average of the Tenkan-sen and Kijun-sen, plotted ahead of the current price. The Senkou Span B is calculated based on the average of the highest high and lowest low over a longer period of time, also plotted ahead of the current price. The Cloud is the area between Senkou Span A and Senkou Span B and is often used to identify potential support and resistance levels.
The Ichimoku Cloud with Entry Signals script provided above is a TradingView Pine script that plots the Ichimoku Cloud on a chart, along with entry signals. The entry signals are generated based on the crossover and crossunder of the Tenkan-sen and Kijun-sen lines, as well as the relationship of the closing price with Senkou Span A and Senkou Span B. When the conditions for a long entry signal are met, a green triangle-up shape is plotted below the price bars. Conversely, when the conditions for a short entry signal are met, a red triangle-down shape is plotted above the price bars.
It's important to note that the Ichimoku Cloud is a versatile indicator that can be used in various ways, including identifying trends, determining support and resistance levels, and generating entry and exit signals. Traders and investors often use it in conjunction with other technical analysis tools and indicators to make informed trading decisions.
This piece of code is a TradingView indicator script used to plot Ichimoku Cloud and display entry signals. It is written in Pine Script language.
First, the `indicator` function is used to set the title and short title of the indicator and overlay it on the main chart.
Next, two parameters `tenkanPeriod` and `kijunPeriod` are defined to represent the calculation period of Tenkan-sen (Conversion Line) and Kijun-sen (Base Line) respectively. Then, the `ta.sma` function is used to calculate the values of Tenkan-sen and Kijun-sen, and they are plotted on the chart using the `plot` function.
After that, the value of Senkou Span A (Leading Span A) is calculated using the `math.avg` function, and it is plotted on the chart using the `plot` function. Similarly, the value of Senkou Span B (Leading Span B) is calculated and plotted.
Then, the `fill` function is used to fill the area between Senkou Span A and Senkou Span B with color, forming the cloud.
Finally, entry signals are determined based on certain conditions. If the conditions are met, the `plotshape` function is called to plot arrow shapes at the corresponding positions to represent entry points.

L1 Moving Average Fingerprint for Long EntryLevel: 1
Background
This script combines moving average processing with highest high and lowest low to disclose the "fingerprint" of a specific trading pair to describe its unique behavior.
Function
Moving Average Fingerprint for Long Entry is a Level 1 pine script. It utilize several moving average of inherent highest high and lowest low and combine them with customized fingerprint coefficients to depict the unique behavior of a specific trading pair across multiple markets for long entry point identification.
Key Signal
FingerPrint1~6 are basic-level fingerprints with moving average of highest high and lowest low.
FingerPrint7~8 are composite fingerprint definitions with coefficients/weights,where coefficients/weights need to be tuned to discover the inherent "fingerprint" of a specific trading pair.
FingerPrint10~12 are composite fingerprint calculation for long entry alerts
ReadytoLong is a long entry filter where long entry point may happen within it. By using crossover() function to a customized threshold value, you can define accurate long entries.
Pros and Cons
Pros:
1. Combine moving average and extreme points to disclose a trading pair behavior.
2. Smart to tune specific set of parameters to obtain unique fingerprints of trading pairs.
3. Smart position sizing scheme by adjusting the threshold values.
Cons:
1. Require tune input parameters for each trading pair in a specific period and time frame.
2. Only long entry was studied, no short entry and re-entry are available yet to form as a trading system.
3. "ReadytoLong" is an inaccurate range where multiple long entries may happen at improper points in chop market.
4. Complex input parameters to obtain a unique fingerprint set.
Remarks
Although I wrote pine script for more than two years, this is the first script published in the community. I will publish more with my works in this platform.
Hope the community can improve this concept and make it as a trading system.
Readme
In real life, I am a prolific inventor. I have successfully applied for more than 60 international and regional patents in the past 12 years. But in the past two years or so, I have tried to transfer my creativity to the development of trading strategies. Tradingview is the ideal platform for me. I am selecting and contributing some of the hundreds of scripts to publish in Tradingview community. Welcome everyone to interact with me to discuss these interesting pine scripts.
The scripts posted are categorized into 5 levels according to my efforts or manhours put into these works.
Level 1 : interesting script snippets or distinctive improvement from classic indicators or strategy. Level 1 scripts can usually appear in more complex indicators as a function module or element.
Level 2 : composite indicator/strategy. By selecting or combining several independent or dependent functions or sub indicators in proper way, the composite script exhibits a resonance phenomenon which can filter out noise or fake trading signal to enhance trading confidence level.
Level 3 : comprehensive indicator/strategy. They are simple trading systems based on my strategies. They are commonly containing several or all of entry signal, close signal, stop loss, take profit, re-entry, risk management, and position sizing techniques. Even some interesting fundamental and mass psychological aspects are incorporated.
Level 4 : script snippets or functions that do not disclose source code. Interesting element that can reveal market laws and work as raw material for indicators and strategies. If you find Level 1~2 scripts are helpful, Level 4 is a private version that took me far more efforts to develop.
Level 5 : indicator/strategy that do not disclose source code. private version of Level 3 script with my accumulated script processing skills or a large number of custom functions. I had a private function library built in past two years. Level 5 scripts use many of them to achieve private trading strategy.

SMART MONEY SMT+BOS+ENTRYThis advanced trading indicator combines Smart Money Theory (SMT) and Break of Structure (BOS) analysis with synchronized multi-asset monitoring. The core concept identifies institutional activity by detecting discrepancies between correlated assets, revealing potential accumulation zones and reversal points before they become apparent to retail traders.
Key Features
Smart Money Detection:
Real-time divergence analysis between two selected assets (e.g., BTC/ETH, Gold/Silver, Currency pairs)
Identification of institutional accumulation/distribution patterns
Trend confirmation through structural sweeps and momentum shifts
Structural Analysis:
Break of Structure (BOS) detection with multi-factor confirmation
ATR-based candle size filtering to eliminate false breakouts
Clear structural shift identification with visual confirmation
Risk-Managed Execution:
Dual entry modes: Immediate (on BOS close) or Retest (on pullback to level)
Automated stop-loss placement at last structural extreme
Dynamic take-profit calculation based on user-defined risk/reward ratio
Support for long-only, short-only, or bidirectional trading strategies
Visual Interface
Colored arrows signaling buy/sell opportunities at optimal entry points
Real-time stop-loss and take-profit level visualization
SMT divergence markers above/below price action
Structural level indicators for clear market context
Configuration Options
Asset Pair Selection - Primary and secondary symbols for comparative analysis
Trading Direction - Long, Short, or Both directions
Swing Sensitivity - Adjustable pivot point detection period
Risk/Reward Ratio - Customizable profit targets relative to risk
BOS Confirmation Filter - Minimum candle body size requirement via ATR percentage
Optimal Application
Best performance on correlated assets (crypto pairs, commodities, indices)
Effective across multiple timeframes (M15 for entries, H4/D1 for context)
Combines well with volume profile and order flow analysis
Suitable for both discretionary and systematic trading approaches
Technical Advantages
Dual-asset synchronization for early signal detection
Multi-layer filtering system reducing false positives
Integrated risk management with visual guidance
Customizable sensitivity for different market conditions
Русская версия
Индикатор Smart Money Theory (SMT) + Break of Structure (BOS)
Обзор
Этот продвинутый торговый индикатор объединяет анализ Smart Money Theory (SMT) и Break of Structure (BOS) с синхронизированным мониторингом нескольких активов. Основная концепция выявляет активность институциональных игроков путем обнаружения расхождений между коррелирующими активами, показывая зоны накопления и точки разворота до того, как они становятся очевидными для розничных трейдеров.
Ключевые возможности
Детекция "умных денег":
Анализ дивергенций в реальном времени между двумя выбранными активами
Выявление паттернов накопления/распределения институциональными участниками
Подтверждение тренда через структурные сдвиги и изменения импульса
Структурный анализ:
Обнаружение Break of Structure (BOS) с многофакторным подтверждением
Фильтрация по размеру свечи на основе ATR для устранения ложных пробоев
Четкая идентификация структурных сдвигов с визуальным подтверждением
Управление рисками:
Два режима входа: Немедленный (при закрытии BOS) или Ретест (при откате к уровню)
Автоматическое размещение стоп-лосса на последнем структурном экстремуме
Динамический расчет тейк-профита на основе заданного риск-риворда
Поддержка лонг-стратегий, шорт-стратегий или обоих направлений
Визуальный интерфейс
Цветные стрелки, сигнализирующие о точках входа на покупку/продажу
Визуализация уровней стоп-лосса и тейк-профита в реальном времени
Маркеры SMT-дивергенций над/под ценовым действием
Индикаторы структурных уровней для четкого контекста рынка
Настройки
Выбор пары активов - Основной и вторичный символы для сравнительного анализа
Направление торговли - Лонг, Шорт или Оба направления
Чувствительность свингов - Настраиваемый период детекции точек разворота
Коэффициент риск/вознаграждение - Настраиваемые цели по прибыли относительно риска
Фильтр подтверждения BOS - Минимальный размер тела свечи в процентах от ATR
Оптимальное применение
Наилучшие результаты на коррелирующих активах (криптопары, товары, индексы)
Эффективен на различных таймфреймах (M15 для входов, H4/D1 для контекста)
Хорошо сочетается с анализом Volume Profile и ордерного потока
Подходит как для дискреционного, так и для системного трейдинга
Технические преимущества
Синхронизация двух активов для раннего обнаружения сигналов
Многоуровневая система фильтрации, снижающая ложные срабатывания
Интегрированное управление рисками с визуальным сопровождением
Настраиваемая чувствительность под разные рыночные условия

Pivots + FVG + Liquidity Sweeps (Smart Entry)//@version=5
indicator("Pivots + FVG + Liquidity Sweeps (Smart Entry)", overlay=true, max_labels_count=500, max_boxes_count=500)
// ===== INPUTS =====
pivotLeft = input.int(5, "Pivot left bars", minval=1)
pivotRight = input.int(5, "Pivot right bars", minval=1)
sweepLookback = input.int(20, "Lookback for sweep detection (bars)")
sweepAtrMultiplier = input.float(1.0, "Sweep strength (ATR multiplier)")
fvg_max_age = input.int(200, "FVG box expiry (bars)")
show_pivots = input.bool(true, "Show pivot markers")
show_sweeps = input.bool(true, "Show liquidity sweeps")
show_fvgs = input.bool(true, "Show FVG boxes")
require_sweep_for_entry = input.bool(false, "Require recent sweep for smart entry")
confirmation_type = input.string("Bullish/Bearish Engulf", "Confirmation type", options= )
fvg_min_width = input.int(1, "Min FVG width (ticks)", minval=0)
// ===== ATR =====
atrLen = input.int(14, "ATR length")
atr = ta.atr(atrLen)
// ===== PIVOTS =====
ph = ta.pivothigh(high, pivotLeft, pivotRight)
pl = ta.pivotlow(low, pivotLeft, pivotRight)
if show_pivots
if not na(ph)
label.new(bar_index - pivotRight, ph, "PH", style=label.style_label_down, color=color.red, textcolor=color.white, size=size.small)
if not na(pl)
label.new(bar_index - pivotRight, pl, "PL", style=label.style_label_up, color=color.green, textcolor=color.white, size=size.small)
// ===== FVG STRUCT =====
type FVG
float top
float bottom
int born_bar
bool bullish
var FVG fvgs = array.new()
var box fvgBoxes = array.new()
// ===== FVG DETECTION =====
if barstate.isconfirmed
prevHigh = high
prevLow = low
if low > prevHigh and (low - prevHigh) >= syminfo.mintick * fvg_min_width
array.push(fvgs, FVG.new(low, prevHigh, bar_index, true))
if high < prevLow and (prevLow - high) >= syminfo.mintick * fvg_min_width
array.push(fvgs, FVG.new(prevLow, high, bar_index, false))
// cleanup old FVGs
for i = array.size(fvgs) - 1 to 0
f = array.get(fvgs, i)
if bar_index - f.born_bar > fvg_max_age
array.remove(fvgs, i)
// ===== DRAW FVG BOXES =====
if show_fvgs
for i = 0 to array.size(fvgBoxes) - 1
box.delete(array.get(fvgBoxes, i))
array.clear(fvgBoxes)
for i = 0 to array.size(fvgs) - 1
f = array.get(fvgs, i)
col = f.bullish ? color.new(color.green, 85) : color.new(color.red, 85)
bx = box.new(f.born_bar, f.top, bar_index, f.bottom, bgcolor=col, border_width=0)
array.push(fvgBoxes, bx)
// ===== LIQUIDITY SWEEPS =====
var int lastBullSweepBar = na
var int lastBearSweepBar = na
priorHigh = ta.highest(high , sweepLookback)
priorLow = ta.lowest(low , sweepLookback)
bullSweep = high > priorHigh + sweepAtrMultiplier * atr and close < priorHigh
bearSweep = low < priorLow - sweepAtrMultiplier * atr and close > priorLow
if barstate.isconfirmed
if bullSweep
lastBullSweepBar := bar_index
if show_sweeps
label.new(bar_index, high, "Bull Sweep", style=label.style_label_down, color=color.orange, textcolor=color.white, size=size.small)
if bearSweep
lastBearSweepBar := bar_index
if show_sweeps
label.new(bar_index, low, "Bear Sweep", style=label.style_label_up, color=color.orange, textcolor=color.white, size=size.small)
// ===== CONFIRMATION =====
isBullEngulf() => close > open and open < close and close > open
isBearEngulf() => close < open and open > close and close < open
isAnyBull() => close > open
isAnyBear() => close < open
// ===== SMART ENTRY =====
for i = array.size(fvgs) - 1 to 0
f = array.get(fvgs, i)
inFvg = close <= f.top and close >= f.bottom
if inFvg
okSweep = true
if require_sweep_for_entry
okSweep := f.bullish ? (not na(lastBullSweepBar) and bar_index - lastBullSweepBar <= sweepLookback) : (not na(lastBearSweepBar) and bar_index - lastBearSweepBar <= sweepLookback)
if okSweep
confirm = confirmation_type == "Bullish/Bearish Engulf" ? (f.bullish ? isBullEngulf() : isBearEngulf()) : confirmation_type == "Close Above/Below FVG" ? (f.bullish ? close > f.top : close < f.bottom) : (f.bullish ? isAnyBull() : isAnyBear())
if confirm
if f.bullish
label.new(bar_index, low, "Smart Long", style=label.style_label_up, color=color.lime, textcolor=color.black, size=size.normal)
else
label.new(bar_index, high, "Smart Short", style=label.style_label_down, color=color.fuchsia, textcolor=color.white, size=size.normal)
break

BB Re-entry HUD1) What this script does
This indicator is an BB Re-entry HUD
Core idea:
Price sweeps outside BB (often liquidity wick sweep)
Re-enters back inside BB within 1–2 bars
Multiple ELITE++ filters reduce fake signals
HUD scores follow-through strength (trend & momentum confirmation)
2) ELITE++ Re-entry Signal Logic
A BUY/SELL signal is triggered when:
One of the previous 1–2 bars moved outside BB (wick or close, selectable)
Current bar re-enters BB (optionally requires close inside)
Optional filters confirm signal quality:
Outside depth minimum (% of BB width)
Candle direction confirmation (Buy=green, Sell=red)
Re-entry close crosses previous candle 50%
Zone filter near BB edges
Touch filter: wick touches the band
Squeeze → Expand regime requirement
Cooldown to avoid rapid repeat signals
3) Trade Power HUD (0–5 Scoring)
After a signal, HUD evaluates either on the next bar (recommended) or the same bar.
Score components (1 point each):
Structure: short-term structure aligns with direction
Impulse Body: body > average body
Volume: volume > volume MA
BB Trend + Expand: price on trend side + BB width expanding
RSI + ATR: RSI threshold + ATR expanding
Interpretation:
4–5/5 = STRONG → Hold / Trail
2–3/5 = MID → Take partial / be cautious
0–1/5 = WEAK → Higher chance of fakeout
4) How to use (practical)
Enable BB plots and arrows
Wait for BUY/SELL signal
Check HUD score:
4–5: higher follow-through probability
2–3: quick TP / reduced size
0–1: skip or wait for better confirmation
Works well on 5m–15m (intraday) and 1H (smoother swings).
5) Notes
This is not a standalone holy grail—best used with support/resistance and market structure context.
Volatile news periods may produce multiple band breaks—use squeeze/cooldown filters accordingly.

ICT Entry V2 [TS_Indie]📌 Description – ICT Entry V2
The market structure, liquidity, FVG, and iFVG mechanisms remain the same as in Version 1.
However, the price action for order entries is different, with the positions of the FVG and iFVG swapped.
Pending orders and stop loss are placed at the iFVG.
⚙️ Core Logic & Working Mechanism
I won’t explain FVG in detail, as most traders are already familiar with it.
Let’s focus on the mechanism of iFVG instead.
The concept of iFVG is based on a supply-to-demand flip and a demand-to-supply flip within an FVG zone.
For an iFVG to be confirmed, the candle close must break through the FVG.
A wick alone does not count as a valid iFVG confirmation.
The confirmation of market structure swings uses a pivot length mechanism combined with price action.
It validates a swing by detecting a structure break formed by candles making new highs or new lows.
📈 Buy Setup
1.Liquidity sweep on the demand side, with price closing above the liquidity level.
2.A demand zone is formed as iFVG and FVG, where FVG is located above iFVG.
3.The gap between the upper box of iFVG and the lower box of FVG must be within the defined Min and Max range.
4.Market Structure must be in a Bullish trend.
5.Place a Pending Order at the upper box of iFVG and set Stop Loss at the lower box of iFVG (Entry and Stop Loss can be adjusted using Entry Zone and ATR-based Stop Loss).
📉 Sell Setup
1.Liquidity sweep on the supply side, with price closing below the liquidity level.
2.A supply zone is formed as iFVG and FVG, where FVG is located below iFVG.
3.The gap between the lower box of iFVG and the upper box of FVG must be within the defined Min and Max range.
4.Market Structure must be in a Bearish trend.
5.Place a Pending Order at the lower box of iFVG and set Stop Loss at the upper box of iFVG (Entry and Stop Loss can be adjusted using Entry Zone and ATR-based Stop Loss).
⚙️ Liquidity Sweep Conditions
➯ When a liquidity sweep occurs on the demand side, the system will start looking for Buy Setup conditions.
➯ When a liquidity sweep occurs on the supply side, the system will immediately switch to looking for Sell Setup conditions.
➯ The system will always prioritize the most recent liquidity sweep and search for setups based on that direction.
➯ The liquidity sweep condition will be invalidated when price closes back below (for demand sweep) or above (for supply sweep) the most recently swept liquidity level.
⭐ Pending Order Cancellation Conditions
A Pending Order will be canceled under the following conditions:
1.A new Price Action signal appears on either the Buy or Sell side.
2.When Time Session is enabled, the Pending Order is canceled once price exits the selected session.
🕹 Order Management Rule
When there is an active open position, the indicator restricts the creation of new Pending Orders to prevent overlapping positions.
⚠️ Disclaimer
This indicator is designed for educational and research purposes only. It does not guarantee profits and should not be considered financial advice. Trading in financial markets involves significant risk, including the potential loss of capital.
🥂 Community Sharing
If you find parameter settings that work well or produce strong statistical results, feel free to share them with the community so we can improve and develop this indicator together.

Fibonacci Entry Zone [OTE] (@ath.snipr)🇬🇧 English Description
📌 Fibonacci Entry Zone – @ath.snipr
Fibonacci Entry Zone is an indicator designed to automatically detect market structure, identify Change of Character (CHoCH), and project Optimal Trade Entry (OTE) zones using Fibonacci retracements.
It is suitable for scalping, day trading, and swing trading across all markets (Forex, indices, crypto, commodities).
🎯 Indicator Purpose
This indicator helps traders to:
✔ Detect significant swing highs and lows
✔ Identify structure shifts (CHoCH)
✔ Automatically draw Fibonacci retracement levels
✔ Highlight the Golden Zone (OTE)
✔ Dynamically track new swings in real-time
The goal is to patiently wait for price to retrace into a high-probability value area instead of chasing price.
🧠 How It Works
1️⃣ Market Structure Detection
The algorithm detects price pivots to identify:
📈 Bullish structure: Higher High / Higher Low
📉 Bearish structure: Lower High / Lower Low
When a structure shift occurs, a CHoCH label appears and a new Fibonacci projection is automatically created.
2️⃣ Fibonacci OTE Levels
Fibonacci levels are calculated between the latest swing high and swing low.
Default levels:
0.50
0.618
These represent the Optimal Trade Entry (OTE) zone where price statistically reacts more often.
The Golden Zone can be filled for better visualization.
3️⃣ Dynamic Updates
When Swing Tracker is enabled:
Fibonacci levels automatically update as new swings form.
The projection always stays aligned with the current market structure.
4️⃣ Visual Elements
The indicator displays:
✔ CHoCH labels
✔ Break of Structure lines
✔ Swing trend line (dotted)
✔ Swing price labels
✔ Extended Fibonacci levels
Everything is fully customizable.
🛠️ Key Settings
Structure
Structure Period – Swing sensitivity (higher = stronger structure).
Bullish / Bearish – Enable bullish or bearish structures.
BoS Width – Structure line thickness.
Fibonacci Mode
Swing Tracker – Auto-update Fibonacci levels.
Swing Line – Show swing connection line.
Swing Labels – Show swing price labels.
Fibonacci
Extend – Extend levels to current price.
Previous – Keep previous levels.
Fill Golden Zone – Highlight OTE zone.
Levels – Customize Fibonacci levels.
📈 How to Trade with It (example)
▶ Bullish Scenario
A bullish CHoCH appears.
Price impulsively moves up.
Wait for a retracement into the Golden Zone (0.5 – 0.618).
Confirm with your strategy (price action, liquidity, SMT, etc.).
Enter long with stop below the last swing low.
▶ Bearish Scenario
Same logic in reverse.
⚠️ Disclaimer
This indicator is a decision-support tool only.
It does not guarantee profits and must be used with proper risk management and personal confirmation.

M15 Impulse FVG EntryM15 Impulse FVG Entry
M15 Impulse FVG Entry is a minimalist price-action tool designed to highlight structured entry contexts using impulse candles, decision zones, and Fair Value Gap (FVG) logic.
⸻
Core Logic
1. M15 Impulse Candle
A strong M15 candle is identified using ATR expansion and body-to-range ratio.
This candle defines a decision zone (High / Low).
2. IN Candle
Only the first candle that forms fully inside the decision zone after the M15 impulse is considered.
This candle acts as the structural reference.
3. OUT Candle
Price must break cleanly outside the zone.
The previous candle must already close outside the zone.
No reversal is allowed through the IN candle extreme.
4. FVG Entry Context
The gap between the IN candle and the OUT candle forms the Fair Value Gap.
A midpoint between IN and OUT can be used as a potential entry reference.
⸻
What This Script Shows
• M15 — Impulse candle marker
• Zone — High / Low of the impulse candle
• IN — First valid candle inside the zone
• OUT — Valid breakout candle
⸻
Design Philosophy
• No BUY / SELL bias
• No alerts, no automation
• No indicator stacking
• Clean and chart-friendly
This script provides market context and structure only .
Risk management and execution rules remain the trader’s responsibility.

GEOFF LONG/SHORT ENTRY + STOP + TP / FINALIZED + ALERT / EMA
This professional-grade scalper is engineered specifically for the Micro E-mini S&P 500 (MES) and focuses exclusively on high-probability "A+" setups. By stripping away secondary noise, the indicator identifies surgical entries where momentum, trend, and institutional value converge.
### THE "PERFECT SETUP" LOGIC (4-LAYER FILTER)
To ensure the highest strike rate, a trade is only triggered when all four of the following conditions align:
1. TREND: 8 EMA crossing the 21 EMA (Short-term momentum shift).
2. VALUE: Price must be above VWAP for Longs or below VWAP for Shorts (Institutional bias).
3. MOMENTUM: RSI must be > 55 for Longs or < 45 for Shorts (Confirming the "Flush").
4. VOLATILITY: The entry candle must close outside the EMA spread to confirm strength.
### KEY FEATURES
* IRON-CLAD ANCHORING: Uses Pine Script v6 'chart.point' math to mathematically weld boxes and labels to the price bars. Drawings will NOT drift or lag when zooming or panning.
* DYNAMIC RISK CALCULATOR: Automatically calculates Take Profit and Stop Loss levels based on your input points. It displays the real-time dollar gain/loss ($5 per point for MES) directly on the chart.
* SURGICAL VISUALS: Features a 3-label system (Entry Price, Target Price, and Stop Price) positioned externally to keep the candlestick price action clear and visible.
* COLOR-SYNC LOGIC: Intuitively designed so that the Profit Target is ALWAYS Lime/Green and the Risk/Stop is ALWAYS Red, regardless of whether you are in a Long or Short position.
* INTEGRATED ALERTS: Includes built-in alert conditions for "Perfect Long" and "Perfect Short" to sync with phone or browser notifications.
### BEST USED ON:
Optimized for the 1m, 2m, and 5m timeframes for MES Futures.

ICT Entry V1 [TS_Indie]📌 Description – ICT Entry V1
This trading system is based on price action, combined with FVG, iFVG, and liquidity, and it uses the mechanism from the indicator “Smallest Swing ” to validate swings that become liquidity.
⚙️ Core Logic & Working Mechanism
I won’t explain FVG in detail, as most traders are already familiar with it.
Let’s focus on the mechanism of iFVG instead.
The concept of iFVG is based on a supply-to-demand flip and a demand-to-supply flip within an FVG zone.
For an iFVG to be confirmed, the candle close must break through the FVG.
A wick alone does not count as a valid iFVG confirmation.
The confirmation of market structure swings uses a pivot length mechanism combined with price action.
It validates a swing by detecting a structure break formed by candles making new highs or new lows.
📈 Buy Setup
1.Liquidity sweep on the demand side, with price closing above the liquidity level.
2.A demand zone is formed as FVG and iFVG, where iFVG is located above FVG.
3.The gap between the upper box of FVG and the lower box of iFVG must be within the defined Min and Max range.
4.Market Structure must be in a Bullish trend.
5.Place a Pending Order at the upper box of FVG and set Stop Loss at the lower box of FVG (Entry and Stop Loss can be adjusted using Entry Zone and ATR-based Stop Loss).
📉 Sell Setup
1.Liquidity sweep on the supply side, with price closing below the liquidity level.
2.A supply zone is formed as FVG and iFVG, where iFVG is located below FVG.
3.The gap between the lower box of FVG and the upper box of iFVG must be within the defined Min and Max range.
4.Market Structure must be in a Bearish trend.
5.Place a Pending Order at the lower box of FVG and set Stop Loss at the upper box of FVG (Entry and Stop Loss can be adjusted using Entry Zone and ATR-based Stop Loss).
⚙️ Liquidity Sweep Conditions
➯ When a liquidity sweep occurs on the demand side, the system will start looking for Buy Setup conditions.
➯ When a liquidity sweep occurs on the supply side, the system will immediately switch to looking for Sell Setup conditions.
➯ The system will always prioritize the most recent liquidity sweep and search for setups based on that direction.
➯ The liquidity sweep condition will be invalidated when price closes back below (for demand sweep) or above (for supply sweep) the most recently swept liquidity level.
⭐ Pending Order Cancellation Conditions
A Pending Order will be canceled under the following conditions:
1.A new Price Action signal appears on either the Buy or Sell side.
2.When Time Session is enabled, the Pending Order is canceled once price exits the selected session.
🕹 Order Management Rule
When there is an active open position, the indicator restricts the creation of new Pending Orders to prevent overlapping positions.
⚠️ Disclaimer
This indicator is designed for educational and research purposes only. It does not guarantee profits and should not be considered financial advice. Trading in financial markets involves significant risk, including the potential loss of capital.
🥂 Community Sharing
If you find parameter settings that work well or produce strong statistical results, feel free to share them with the community so we can improve and develop this indicator together.

Borna Zones EntryThis indicator marks close-based entry signals for DAX / GER40 on the 1-minute timeframe, using two fixed intraday zones:
08:00 candle → Zone 08
09:00 candle → Zone 09
If the zones overlap, an entry is marked on the first candle close breaking the combined zone.
If the zones are separated, an entry is marked on the first candle close breaking the 09:00 zone, in the direction of the 08:00 zone.
Entries are shown only between 09:00 and 11:00 and only on the first valid breakout (no repeated signals).

Borna Zones Entry First Close BreakThis indicator marks close-based entry signals for DAX / GER40 on the 1-minute timeframe, using two fixed intraday zones:
08:00 candle → Zone 08
09:00 candle → Zone 09
If the zones overlap, an entry is marked on the first candle close breaking the combined zone.
If the zones are separated, an entry is marked on the first candle close breaking the 09:00 zone, in the direction of the 08:00 zone.
Entries are shown only between 09:00 and 11:00 and only on the first valid breakout (no repeated signals).

ATR Based SL & TP Targets from Entry (Long/Short)ATR-based target helper for manual trade planning.
Plots a single entry level plus ATR-based stop loss and take-profit targets on the price scale. The script uses a standard ATR (default 14) and lets you select the position side (Long or Short). For Long positions, it places the stop loss 1× ATR below the entry and take-profit levels at 1, 2, 3, and 4× ATR above. For Short positions, it mirrors this logic, placing the stop 1× ATR above the entry and targets 1–4× ATR below. You can adjust the entry price and ATR multipliers from the settings, and all levels update instantly, giving a clean visual of your risk and reward targets on the price scale.
-------------------
Tip:
After entry, and after I set my SL & TP levels, I hide the indicator until it's needed again.
