Cari dalam skrip untuk "fib"
Fib RetracementI've re-created the fib retracement tool as an indicator and this is as close as I can currently get to matching the built-in fib retracement tool.
Why did I make this? For custom labels for every fib retracement level.
Caveats to this vs the built-in tool are:
the "Save as Default" doesn't appear to work (I believe this is due to the interactive/confirm based settings)
copy and paste to another chart is locked into the price of source location
when dragging the points of retracement the tool/indicator disappears
Hopefully some can find usefulness in this code or it's functionality.
Fib Signals | -- MoonLaunchr --Script that can display signals against key Fibonacci levels based on highs and lows within a given time-frame
Set the number of days back in time that you would like the indicator to look for the high and low for calculating fibs.
Bear Market options include sub-level fibs within the 12.3% range - 38.2 and 61.8% 3 levels deep.
Signals when crossing over and under key fibs.
Set ALERTS for each key fib piercing.
Set ALERTS when new highs or lows are made.
All levels and signals can be displayed or hidden and customised within the indicator options.
Next candle price projection.
Bull Market key fib sub-levels will be added in the next update (top 12.8% sub-levels 1,2 & 3).
Happy trading!

Fib Cross (Daily)All the fib levels are based on the 200 SMA . All MA's are SMAs except the 50% level (100 candles) which is an EMA . On the daily chart , the 61.8% golden ratio fib level is a significant support throughout a crypto bullrun

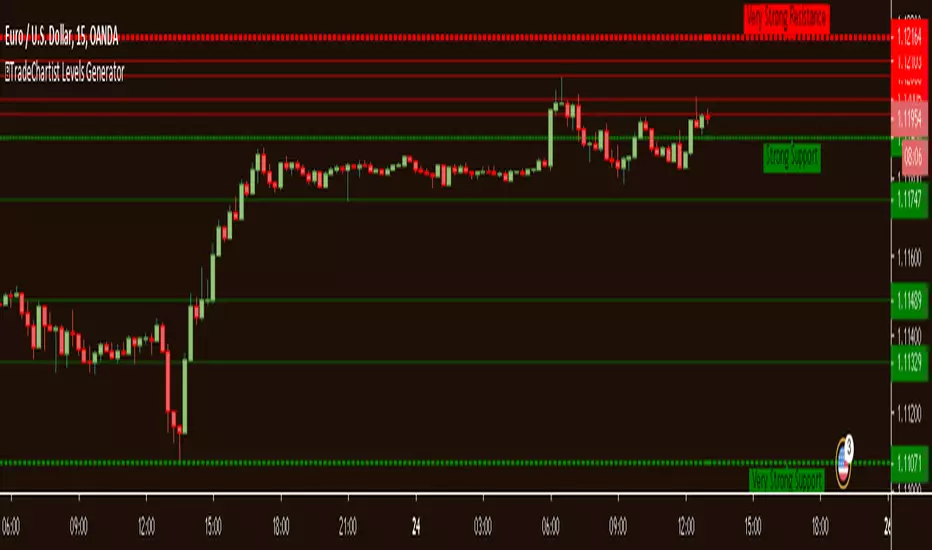
TradeChartist Fib Master™TradeChartist Fib Master is a versatile Fibonacci Support and Resistance indicator that can be used to plot Automatic Levels and Fibonacci Levels based on a variety of ways from the settings, including Auto Fibs plot by connecting to an external indicator.
===================================================================================================================
What does ™TradeChartist Fib Master do?
Plots Automatic Levels without the need for user input
Plots 3 types of Fibonacci Levels
════ 1. Auto-Fibs (by connecting to an external indicator - Oscillatory or non-Oscillatory)
════ 2. Fibs based on Lookback (Lookback type - Candles or Days)
════ 3. Fibs based on Price Input
===================================================================================================================
Detailed description of ™TradeChartist Fib Master features
╔══ Automatic Levels Generator ══╗
Enabling Plot Automatic Levels plots support and resistance levels automatically without any input from the user other than preferred levels plot from the indicator settings namely,
Plot Local Levels for Lower TF - Plots all important Support/Resistance levels for mostly smaller time frames (can be used for up to 1hr in most cases). Recommended for Scalping/Swing Trading mostly dependent on volatility.
Plot Local Levels for Higher TF - Plots all important Support/Resistance levels inferred from mostly time frames - Short to Mid term outlook.
Plot Extended Levels for Higher TF - Plots all important Support/Resistance levels inferred from very higher time frames - Mid to Long term outlook.
Use Trading View Data Window to make effective use of the levels.
Tip: Add a duplicate Fib Master indicator to chart, use Automatic Levels Generator and increase transparency of Fib colours to 100. This helps view the levels on Data Window while having the Fib plots on chart.
Note: Uncheck Plot Automatic Levels to enable Fibonacci plots from Fibonacci Levels Generator
╔══ Fibonacci Levels Generator ══╗
════ 1. Auto-Fibs ════
Almost any indicator plot or Signal (Oscillatory or non-Oscillatory) can be connected to Fib Master to generate automatic fib levels. This is done by automatically detecting the price trend based on the connected indicator, its corresponding highest high and lowest low prices of each trend.
Also, Fib Master plots Bull (default - green) and Bear (default - red) Zones background including the signal candle (default - orange), where the trend changes based on the connected indicator Signal. This helps detect the effectiveness of the connected indicator Signal too, as too many unproductive signals from the connected indicator will create numerous Bull and Bear Zones (which also will render the Auto-Fibs ineffective).
To connect an external indicator Signal, just choose the corresponding Signal plot from the Plug Indicator Here dropdown from settings and choose whether the connected signal is Oscillatory (for Oscillators like RSI, CCI, MACD, Trend Identifier signals from more complex indicators like ™TradeChartist Bollinger Bands and Donchian Channels Pro etc.) or non-Oscillatory (for plots like Moving Averages, Super Trend, Ichimoku plots like Kijun Sen etc.)
If the connected Signal is Oscillatory, enter the filter levels. Default is 0 for both fields as most Oscillators have 0 as their mean reversal zone. For Oscillators like RSI, 60/40, 50/50, 55/45 etc. can be used.
Note: Please test the performance and effectiveness of Auto-Fibs of connected Signal first before using it for trades.
════ 2. Fibs based on Lookback ════
Lookback type - Candles
Determines the High and Low price of the user input number of Candles back (100 default) and plots Fibonacci Levels based on the calculated High and Low for the number of candles in the past from the current candle. The levels stay intact on any time frame as long as no new Highs or Lows are formed.
Lookback type - Days
Determines the High and Low price of the user input number of Days back (100 default) and plots Fibonacci Levels based on the calculated High and Low for the number of days in the past from the day of the current bar. The levels stay intact on any time frame as long as no new Highs or Lows are formed.
════ 3. Fibs based on Price Input ════
Plots Fibonacci Levels based on the user specified High and Low Price in the settings input fields. The levels stay intact on any time frame irrespective of new Highs or Lows being formed. Manual Price Input will enable the trader to keep the Levels intact and visually see the higher Fibonacci Retracement levels, when the price crosses beyond 100% retracement. On the other two lookback types, the Fibonacci levels are displayed only upto 100% retracement.
===================================================================================================================
Note: Show Auto-Fibs from current High/Low
When this option is chosen from indicator settings, the Auto-fib levels are drawn from the highest high of the trending price direction to lowest low of last trend for uptrend or vice-versa for downtrend.
===================================================================================================================
Extra Features
The Fibonacci levels can also be reversed by enabling Reverse Fibonacci Levels option from the settings.
0.886 and 1.113 Fib levels can be plotted on chart by enabling Show 0.886 and 1.113 Fibs from settings, as these are important levels for harmonic pattern traders.
Fib Line and Label Style including Color, transparency, size etc. can be changed from settings based on user preference.
===================================================================================================================
Example Charts
XAU-USD Gold Daily chart using Automatic Levels Generator with Zones identified when connected to external indicator
BTC-USDT Daily chart using Automatic Levels Generator
SPX 1hr chart using Automatic Levels Generator
ETH-USDT 1hr chart using AutoFibs generated by connecting Fib Master to RSI with 60/40 Filter levels
XAG-USD (Silver) 1hr chart using Fibonacci Levels based on lookback
===================================================================================================================
Best Practice: Test with different settings first using Paper Trades before trading with real money
===================================================================================================================
This is not a free to use indicator. Get in touch with me (PM me directly if you would like trial access to test the indicator)
Premium Scripts - Trial access and Information
Trial access offered on all Premium scripts.
PM me directly to request trial access to the scripts or for more information.
===================================================================================================================

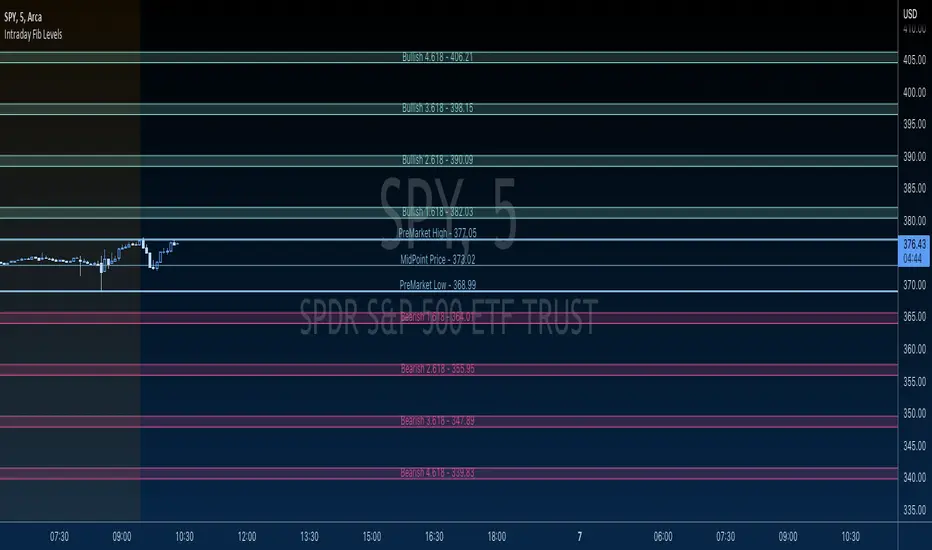
Intraday Fibs RetracementFibonacci (Fibs) levels are often used by traders as a way to find support and resistance, based on the Fibonacci sequence. These levels are widely used in technical analysis to identify potential reversal points in the price of an asset.
Fibs retracement draws lines at these Fibs level between a significant high and low point on a price chart.
What it shows:
This indicator will automatically draw Fibs Retracement Levels on your chart without any manual work.
It is designed to be used for day trading, especially in scenarios where a ticker gaps up/down large compared to the prior day close. (i.e. scenario where the difference of day's open and prior day close is large)
The drawing will happen on each trading day the moment trading hours open, and will NOT draw during pre-market and post-market.
User can see the line of each Fibs level, labelled with the Fib percentage and price value for the corresponding levels.
User will specify a start and end point of Fibs and based on the choice the indicator will automatically compute the other user defined Fibs levels and display on the chart.
How to use it:
The Fib levels drawn can be a potential support and resistance zone. Therefore in scenario where you already have a position and are approaching one of these levels it could be a point to close out some or all the position as you are approaching a resistance. On the other hand when price do approach these levels you could enter a position for a reversal trade. These are few ways to use the indicator but there are other ways that can be used, which can be found out by researching "Fibonacci (Fibs) Retracement".
In the example on the chart you can see a price bounce from the 0.7886 Fibs level on this particular day, where the price gapped up and was coming down after market hours opened.
Key settings:
1. Fibs Retracement Start and end Point: User selects where the Fibs levels should be drawn.
Available Options are:
Start Points:
Market Open
Market Open High (Dependent on the time frame you are on)
Pre-market High
Day's High
End Points:
Previous Day Close
Previous Day Low
Previous Day High
Pre-market Low (Current Day)
Day's Low
2. Custom Fib Levels: User can manually enter the Fib levels they want to see. (Max 9)
Default values are: 0,0.236,0.382,0.5,0.618,0.786,1,1.618,2.618.
3. Display settings: User can specify the line colour, thickness and style.
4. Label Setting: User can choose to turn on/off the labels for the each Fibs Level. Label will show the fib percentage and the corresponding price. User can also choose the location of the labels, defined by an offset from the current candle.
----------------------------------------------------------------------
If anything is not clear please let me know!

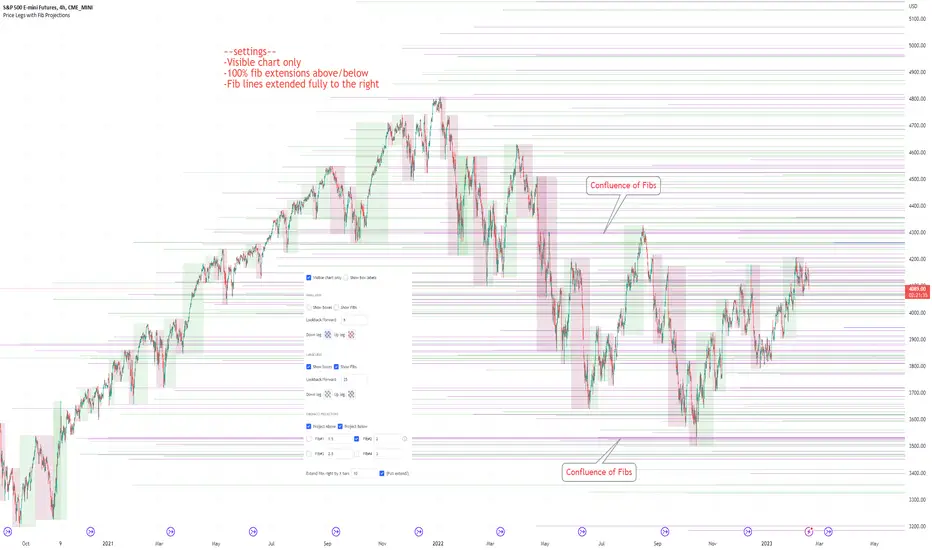
Price Legs & Fib Projections: Fibonacci Confluence-Plots price legs based on two user input lookback numbers. Smaller number for small legs, larger number for large legs.
-Plots Fib projections of these price legs, above and below; User can input four independent fib levels or standard deviation levels
## User Inputs ##
~Show visible chart only; Show price leg labels (time and price); show small legs (fibs and/or boxes); show large legs (fibs and/or boxes)
~Input 4 Fibonacci levels or measured move levels. Toggle each level on/off
~toggle on/off Fib levels ABOVE or fib levels BELOW
~extend Fib levels 'X' bars to the right, or toggle on/off 'Full Extend' to the right
## Tips & Notes ##
-use 'Full Extend' together with 'visible chart only' if searching for multiple confluence of Fib levels.
-can quickly get very cluttered, but the aim in writing this was to try to find area of confluence at a glance amongst a mess of levels, then hide the indicator and study/note that area.
-if lines don't print toward the left hand side of the chart you've likely reached the max line limit set by Tradingview.
-Fib level input of 1.0 represents zero % extension above the high or below the low of the leg; 2.0 represents 100% extension.
1hr S&P: Visible chart only; large legs only; 50%, 100%, 150%, 200% Fib extensions; Above only; lines extended fully to the right:
Usage notes; 15m S&P: Small & Large price legs; partial extend; all fib levels above/below:
Litt Auto FibThe Litt Auto Fib Tool automatically draws Fibonacci Retracements & Fibonacci Extensions based on time periods. The time period has two important settings.
1. The Fib Period is the period in which the Fib Tool determines a High and Low.
2. Use Previous Fib overlays the past periods Fib Levels on the current period.
For example, if we are using Daily period (D), then the Litt Auto Fib will calculate that Time periods High and Low. After determining the High and Low the tool will plot retracement levels and extension levels based off that Time periods High and Low. If we have the Use Previous Fib Unchecked it will use the current Day. If we have the Use Previous Fib checked (Or set to True), the Fib tool will use the previous day and overlay onto the current day. These levels can act as support and resistance, profit targets or stop losses. If you need more information on Fibonacci or how traders use it, it is best to do a quick Google search.

™TradeChartist Fib Extensions™TradeChartist Fib Extensions is a free to use script that helps traders plot Fibonacci Extensions on chart. Even though Trading View has a Fib extensions tool, some traders may prefer a plotting script like this with Fib plot lines extending across the whole of the chart to track historic prices in relation to Fib extensions drawn.
----To draw Fib extensions for uptrend ,
1. Choose a Pivot Low point (LL or a HL) as Pivot 1
2. Choose a Pivot High point (must be higher than Pivot 1) as Pivot 2
3. Choose a Pivot Low point (must be lower than Pivot 2, must be Higher than Pivot 1)
----To draw Fib extensions for downtrend,
1. Choose a Pivot High point (HH or a LH) as Pivot 1
2. Choose a Pivot Low point (must be lower than Pivot 1) as Pivot 2
3. Choose a Pivot High point (must be higher than Pivot 2 and lower than Pivot 1)
Negative extensions of -23.6% and -61.8% fib plots may be useful for some to spot reversals or to set stop losses.
Higher levels can be used if price goes beyond 161.8%
This is a free to use indicator. Give a thumbs up or leave a comment if you like the script
Check my 'Scripts' page to see other published scripts. Get in touch with me if you would like access to my invite-only scripts for a trial before deciding on a paid access for a period of your choice. Half-Yearly, Annual and Lifetime access available on invite-only scripts along with 1hr Team Viewer intro session.

Auto Fib Retracement AlertsFor the fibonacci traders.
The Auto Fib Retracement Is a good indicator for tradingview to show you the current alerts and points to watch in the market
IMPORTANT SETTING => Retracement
This controls your alert levels
I have modified it to deliver the following
+Custom Fib retracement level alerts
+Drawing of old levels and retracement levels
+Backtesting Old Alerts
There are two shapes drawn on the chart;
Shown When the fib end is attained and market retraces back to your level
1. Buy retracement -
2. Sell retracement
How are they detected?
When we have new levels in the market; this is when the red or gree line changes, we calculate the new fib level that we will be watching for retracement
This is the purple level drawn on the chart
When the market first crosses below or above this level, The alert will be fired.
Consequent crosses are not updated
Enjoy! 😍
Originally requested by trade atechproduction
Hull Signal and Auto Fib 30 secThis script will not be given away for free. Been months of developing and the effort is paying off.
The code uses a 40 HULL MA on the 30 second chart to identify up/down changes in trend. It ensures the equity is positive on the day to go long, or negative on the day to go short.
It draws the stop and fib lines according to the current 3 min ATR over the last 4 periods (12 minutes) : x1 x2 x3 x4 x6
Candles are highlighted upon entries. Grid begins.
Code resets upon one of the following:
- 4x target achieved and the trade has been active for 30 minutes
- 6x target achieved
- Stop hits
- 30 minutes have lapsed and the close is less than target x2
I have performed simple strategy analyses and have determined:
(Approximately)
34% lose x1
66% achieve 1:1, manually stop out at B/E after first target hits
48% achieve 2:1, manually stop out above B/E after x2 target hits
38% achieve 3:1, manually stop out above x1 after x3 target hits (will reset fib grid without change in trend)
13% achieve 4:1, manually stop out above x3 after x4 target hits (will reset fib grid without change in trend)
I have not evaluated for x6 though it expected to be around 5% of the winning trades. (will reset fib grid without change in trend)
Message me if your interested further.

Auto FibTook the code from LazyBears rsi-fib and made it so you could apply it to a chart. It plots fib levels between the high and low of a timeframe of your choosing. Seems to line up well with custom drawn fib levels.
Not sure if it's any better than just drawing the lines yourself, but whatever.

GBTT Premarket Fib ZonesOverview:
This is a daily pre market fib tool. Basically, it looks at your premarket price action and generates a set of fibs. From there, it cross references bearish vs bullish fibs, creates a bear and bull zone to watch for during the day. Finally it draws associated fib levels in each direction are plotted/shaded to represent possible price levels for the day.
The lines will redraw/update every day at open, 930 est and then be there on the chart all day until the following open. These zones are meant to be a reference point for the current trading day only.
Intended use:
To provide educational content about the short term movement of an asset. Can be used on any time frame. But remember, it updates at 930 at open for each day and is only applicable to the current trading day.
Disclaimer:
NOT intended to be a sole source of Technical Analysis or anything more than an educational tool!
Fib TSIFib TSI = Fibonacci True Strength Index
The Fib TSI indicator uses Fibonacci numbers input for the True Strength Index moving averages. Then it is converted into a stochastic 0-100 scale.
The Fibonacci sequence is the series of numbers where each number is the sum of the two preceding numbers. 1, 2, 3, 5, 8, 13, 21, 34, 55, 89, 144, 233, 377, 610...
TSI uses moving averages of the underlying momentum of a financial instrument.
Stochastic is calculated by a formula of high and low over a length of time on a scale of 0-100.
How to use Fib TSI:
100 = overbought
0 = oversold
Rising = bullish
Falling = bearish
crossover 50 = bullish
crossunder 50 = bearish
The default input settings are:
2 = Stoch D smoothing
3 = TSI signal
TSI uses 2 moving averages compared with each other.
5 = TSI fastest
TSI uses 2 moving averages compared with each other.
Default value is 3/5.
color = white
8 = TSI fast
TSI uses 2 moving averages compared with each other.
Default value is 5/8.
color = blue
13 = TSI mid
TSI uses 2 moving averages compared with each other.
Default value is 8/13.
color = orange
21 = TSI slow
TSI uses 2 moving averages compared with each other.
Default value is 13/21.
color = purple
34 = TSI slowest
TSI uses 2 moving averages compared with each other.
Default value is 21/34.
color = yellow
55 = Stoch K length
All total / 5 = All TSI
color rising above 50 = bright green
color falling above 50 = mint green
color falling below 50 = bright red
color rising below 50 = pink
Up bullish reversal = green arrow up
bullish trend = green dots
Down bearish reversal = red arrow down
bearish trend = red dots
Horizontal lines:
100
75
50
25
0
2 different visual options example snapshot:

Auto Fib ZonesAuto Fib Zones is a extension of the ABC finder script that I released. It uses the pivot point system I developed in the ABC finder to identify major or significant trending moves in the market.
It will then draw the fibzones for the trend line. The fib zone will auto update for as long as the trend line continues (size will keep increasing).
The zones will continue to extend to the right along with price until it is tested. The start of the green teal zone is the 0.618 and fills to the 0.786 and the Blue zone is the 0.786 and fills to the trend start or 1 value of the fib.
You can adjust the Bars Back variable to require more or less candles to create/ validate a new trend. In the screen shot about it is set to 50 bars however I've seen good results on higher timeframes like 4h + with 15 bars as the setting.
This is basically ITC's Optimal Trade Entry concept at least that is what the original inspiration for modifying my base script was.
As always hope it helps. God bless

Automated MSB OTE Fibs and Premium DiscountOTE means optimal trade entry and can give the best price point to enter a trade at lower time frames. This indicator automatically draws these OTE levels and the premium /discount of the range, following a market structure break or MSB.
It does this by finding a pivot, checking if it has been broken by a candle body, then drawing a line for that MSB.
The premium /discount range and fib levels are taken from the high/low before and after the MSB, with the most recent MSB being used.
What is particularly great is that the levels and boxes move in realtime, so there is never any need to redraw things manually, drawing is fully automated and updates with every change in price or MSBs.
Settings:
Left and Right bars for Pivot - this determines the strength of the pivot that has been broken. The stronger the pivot, the stronger the MSB.
Max Lookback - How far to look back for MSBs.
Various aesthetic options to show bullish / bearish MSBs independently, as well as colour and line settings for the MSB, Fibs and Premium/Discount.

B-auto fibA new interactive input mode for price and time inputs is now available. Instead of selecting bar numers and/or time from input widgets, you can now select them by clicking on the chart.
The interactive mode is activated by using confirm = true in input.time() and input.price().
This is code for an Anchored fibonachi indicator where the anchor point is set interactively
this way you can change start date and fib level is calculating automaticly indicator is finding highest and lowest price and calculating fib levels
thanks to versiyon5
i hope tradingview will make a fibo widget like Anchored VWAP it will be very usefull
thanks good works so far :)

Fib RSI++ by [JohnnySnow]Fib RSI++ by is an RSI Inspired by my absolutely favorite RSI on tradingview: RSI & EMA with Reverse Calculator Panel by balipour.
Built for quicker and easily identify prices at current RSI /possibly reversals/ RSI direction and RSI landings.
From balipour, I reuse /adapt to pinescriptV5 3 lines of code ( ) - the balipour implementation for reversing RSI formula in order to calculate price estimation based on the Given RSI level. Credits to the author.
Inspired by it, I also combine RSI with a MA but tuned to reads better the support/resistance levels (my humble opinion).
For quicker price target identification 2 features were added:
- Gridlines based on Fib levels, standard overbought/oversold levels and other levels I personally use. All of the grid lines can be configured according to user preferences.
- 2 information tables:
--First with a collection of 'close' numbers and Fib RSI levels price estimations at given RSI
--The second table allows the user to add up to 3 custom RSI levels to further target the price estimation.
Author UI Preferences to be used with this indicator: dark theme, hidden vertical and horizontal chart gridlines.


Fib Time Zone with Alert* Fib Time Zone with Alert will draw a series of vertical lines on chart. They are spaced at the Fibonacci intervals of 1, 2, 3, 5, 8, 13, 21, 34, 55 and 89. Trader defined the zero line and the 1 line, then Fib Time Zone with Alert auto draw the rest and display alert when price touch the line.
* Alert condition available in the Create Alert dialog box with title "Fib Time Zone Alert".
* Line 0 was defined by Date, Month, Year, Hour, Minute (use Exchange Timezone).
* Line 1 was defined by number of bars between Line 0 and Line 1.
* Line 2,3,5,8,13,21,34,55 and 89 auto draw.
ATR Fib Pivot Stop ComboAcknowledgements: Everget for the Chandlier Exit indicator + other indicators for structure reference and MG for the Trailing Pivot stop indicator.
I wanted a Fib-Pivot-Stop indicator, so I duct-taped them together with some Fibs, and this was the result.
Technically you could say this is experimental and unfinished - the indicator is bulky/clunky enough to make it hard enough to use traditional MAs and other indicators that are drawn on chart. If you have success with this indicator trading, I want to know - send me a PM or link me a chart, please.
Levels Generator with Fibs"Levels Generator with Fibs" is an easy to use and a well coded script that can be used by traders of all levels from beginners to advanced professionals.
What does the script do?
Plots the support and resistance levels automatically based on user preference of Local or Global levels from indicator settings.
Plots Fibonacci retracement levels between high and low based on 'Days' or 'Candles' lookback from indicator settings.
What markets can this script be used on?
Forex
Stocks
Commodities
Cryptocurrencies
and almost any asset on Trading View
Does the script repaint levels?
No. The script does not repaint as it plots levels based on the past price movement. The only time the levels change for a given timeframe is when the price makes a new All Time High or a new All Time Low.
What is the difference between "Plot Levels" and "Plot Fibonacci Levels"?
"Plot Levels" plots support and resistance levels automatically without any input from the user other than preferred levels 'plot' from the indicator settings namely
Plot All Global Levels - Plots all important levels from ATH to ATL (dependent on data age/availability on Trading View) - recommended for Long term outlook
Plot Local Levels for Higher TF - Plots all important Support/Resistance levels for mostly higher time frames (1hr or higher) - Short to Mid term outlook
Plot Local Levels for Lower TF - Plots all important Support/Resistance levels for mostly smaller time frames (can be used for up to 1hr in most cases) - Recommended for Scalping/Swing Trading mostly dependent on volatility
"Plot Fibonacci Levels" plots all standard Fibonacci retracement levels - 0, 23.6%, 38.2%, 50%, 61.8%, 78.6% and 100% based on
"Days" Lookback - Fibonacci levels between High and Low based on number of days in the past, starting from the current day on any time frame chart
"Candles" Lookback - Fibonacci levels between High and Low based on number of candles in the past, starting from the current candle on any time frame chart
Can the Fibonacci levels be reversed?
Yes. The Fibonacci levels can be reversed by checking the "Reverse" checkbox from the indicator settings. This is very handy if the trend looks like there may be a support or resistance from one of the Fib levels and a possibility of a new high or a new low based on the price action.
What is the need for "Plot 1.272 Fibonacci Level" under "Plot Fibonacci Levels"?
1.272 is an important Fibonacci number as it is the square root of 1.618 and is the near support or resistance after 100% price retracement. Even though it keeps moving on the chart dependent on the new high or new low based on Days/Candles lookback, it serves as a 'nice to have' reference for any trader looking beyond 100% retracement for support/resistance.
Why do the 'local levels' lines' color changes between green and red?
The nearby levels lines change color based on price closing above or below them. This happens to only closest local levels for lower TF near price action and for top/bottom lines of the local levels for higher TF.
The line turns green when it becomes support as price closes above it.
The line turns red when it becomes resistance as price closes below it.
Can the levels lines' colors be changed?
Yes. The color of the Higher TF levels and all Global levels (from "Plot All Global Levels") can be changed from the 'Styles' tab from the indicator settings. Some lines change between green and red (which show on both light and dark themed background), so they are not editable and are hidden, but all other lines can be edited to show /hide or change color from the 'Styles' tab on the indicator settings.
What chart background is recommended?
The colors of the levels are neutral to both light and dark background of the chart screen, but a black or a dark background shows the lines even better. It comes down to user preference. If the default horizontal and vertical lines on chart screen is of no use, it can be hidden from 'Background' tab on Trading View chart settings by increasing the transparency of the lines all the way up.
Get in touch with me if you would like access to the script on monthly, 6 monthly or annual basis.
Fib Swing Counter [A@J]Fib Swing Counter — Trade the Rhythm of the Market
This indicator automatically marks swing highs and lows with Fibonacci numbers (1, 1, 2, 3, 5, 8, 13, …), helping you track market structure, count price legs, and identify hidden order behind price movement.
Core Features:
Auto-detects pivots and labels them with the Fibonacci sequence.
Alternates between highs and lows — no repeats, no noise.
Custom reset time — start your count at the New York session open, a major news event, or your own strategic point.
Clean and simple visual display, adaptable to your chart style.
How Traders Use It:
Liquidity cycles: Spot when price is expanding or contracting in Fibonacci-driven waves.
Entry timing: Wait for setups to align with a key Fib count.
Confluence with other tools: Combine with ICT concepts, SMT divergence, supply/demand blocks, or Fibonacci retracements.
Session-based analysis: Restart the sequence everyMarket Open, Midnight, New York or London open to study price behavior from a fresh anchor point.
Whether you're into smart money concepts, price action, or algorithmic patterns, this tool adds a rhythmic layer to your analysis — because markets move with sequence, not randomness.
