Auto Fib RetracementThis tool puts the killzone (61.8% to 88.6%) fibs on the last move automatically.
Cari dalam skrip untuk "fib"
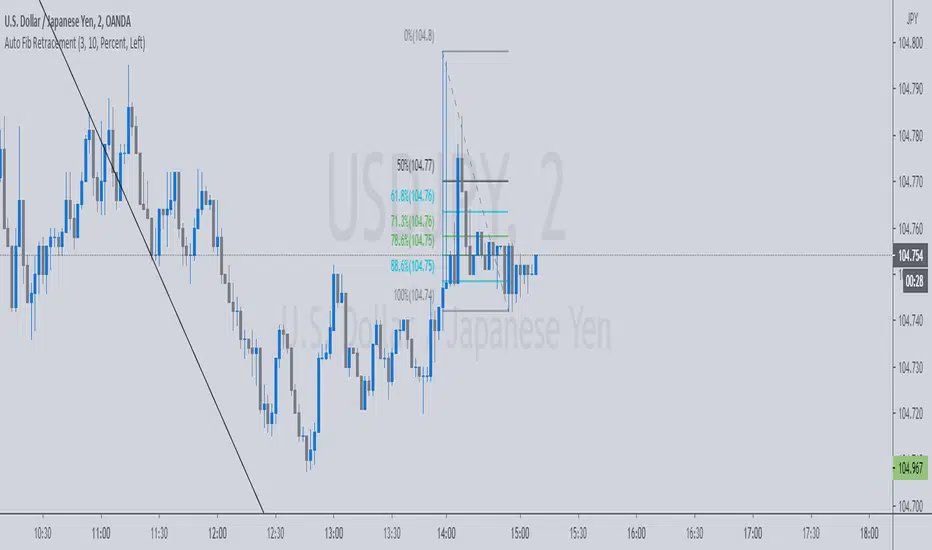
Auto Fib Retracement Modified by MrTuanDoan
This indicator is a modified version of TradingView builtin "Auto Fib Retracement".
It improves how the price is displayed with exact number instead of rounded number.

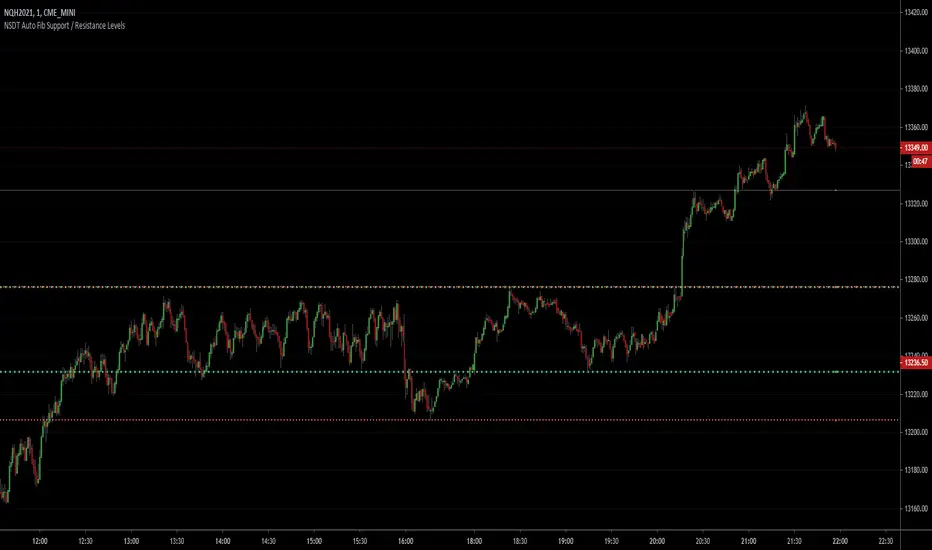
NSDT Auto Fib Support / Resistance LevelsThis script automatically plots support and resistance lines using the fib numbers as the amount of candles to lookback. Each line is colored differently to easily identify the support/resistance pair (i.e. 23%, 38%, 61%, etc..) with the 50% (Green) and 78% (Red) a thicker line. All variables are editable. Added alert capability.

Phoenix085-Studies-PerCentage Current Price ((fib-pivot-%))Misc Details :
Another Indicator and Totally my own concept...
If others have similar study already then Credit to them for coming up with this even before I did but this is just me fiddling with pinescript trying to paint my dream like a great man once said...
Background :
I am a strong believer of Market being Fractals and what best way to script it than Pivots.
So I just wanted to identify the Pivot High and Pivot Low of some period(in the script it is set to 500, please do play with it to get the best setting which captures atleast the major highs and lows of recent past)
I also think that Fibonacci levels are very crucial and so wanted to see how the market reacts at the Fibonacci ratios from Pivot High and Low.
Overview :
As said above the price at Pivot Low is considered as 0% on the graph and Value at Pivot High as the 100%.
Depending on the CMP, the thick white line is plotted...
The main thing of interest here is the Horizontal lines are Fib Levels and the market kinda reacts around those levels as the buyers and sellers have to come to equilibrium...
A price retracing from the 100% level just means Double Top = Sell(Probable) and a bounce from the 0% just means a double bottom = Buy(Probable)....
Also this indicator along with my other Public indicator() might give a better understanding of the price actions (I Hope)...
This is free to use and share with as many as you like...
Credits:
All the great people who have greatly influenced and still continue to do so...
@JustUncleL
@BigBitsIO
@TheArtofTrading
@QuantNomad
@SquigglesNiggles and many many many more

User-Inputed Time Range & FibsGreetings Traders! I have decided to release a few scripts as open-source as I'm sure others can benefit from them and perhaps make them better.(Be sure to check my Profile for the other scripts as well: www.tradingview.com).
This one is called User-Inputed Time Range & Fibs.
The idea behind this script is to record the Range Highs and Lows of a User Defined Period, and plot potential Targets based on either Fibonacci Extensions or a Multiple of the Range Size. I created this originally for use with the US Session Initial Balance(From 9:30-10:30AM EST), however it can be set to any time period.
What is Initial Balance? In simple words, Initial Balance (IB) is the price data, which are formed during the first hour of a trading session. Activity of traders forms the so-called Initial Balance at this time. This concept was introduced for the first time by Peter Steidlmayer when he presented the market profile to traders(atas.net).
The IB is monitored as a break-out area for Range Extension traders. The IB High is also seen as an area of resistance and the IB Low as an area of support until it is broken(www.mypivots.com).
As a note, depending on the Time Zone you are in, you may need to manually add or subtract from the Timed Range to match the desired Time. For example in NY Eastern Time, I have to use 8:30-9:30AM to Capture the 9:30-10-30AM IB for ES and NQ. Similarly, I must use 14:30-15:30PM to Capture the 9:30-10-30AM IB for BTC. You will need to make adjustments based on the Time Zone you are located in.
I wanted to give a Special Thanks to @PineCoders for the Custom Rounding Function from Backtesting/Trading Engine--> (), Pinecoders.com for help with Tracking the Highs/Lows--> (www.pinecoders.com), and @TradeChartist for allowing me to use some of the code for the Fibonacci Extensions from his script here--> ().
If you like User-Inputed Time Range & Fibs, be sure to Like, Follow, and if you have any questions, don't be afraid to drop a comment below.

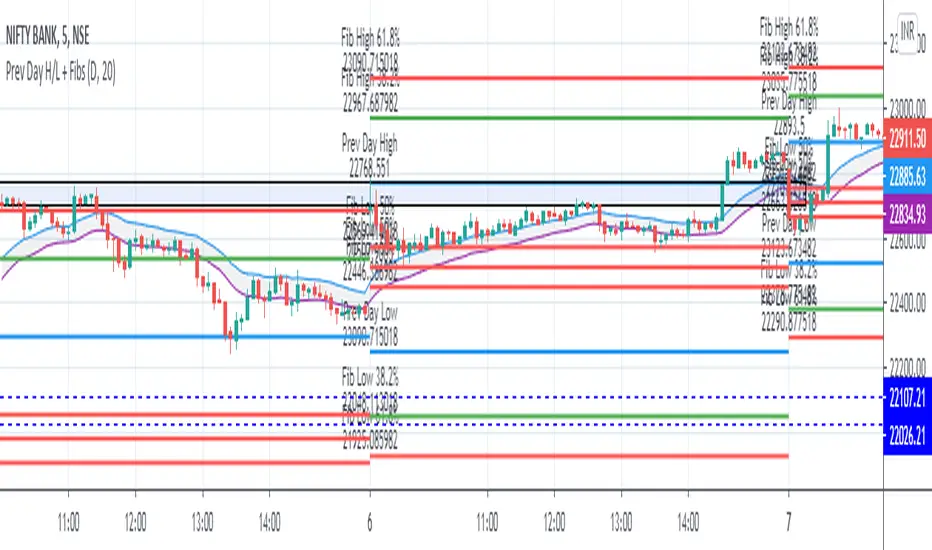
Previous Day High - Low and EMA BandThe fib are plotted to previous day High and low to find next days support and resistance based on fibs.
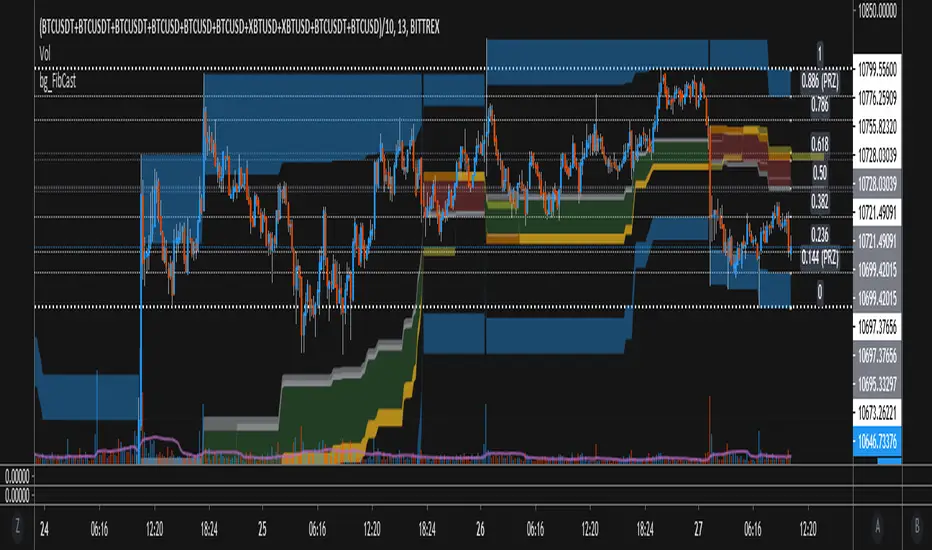
bgeraghty_FibCastThis script draws a High-To-Low or Low-To-High Fibonacci Retrace over the chart, based on which of those two happens in the given time period (Default is 144 Candles).
Updates from older versions:
- Paints 0.5, 0.618, 0.65 and spaces in between, giving good hindsight to the trend, and ideas of where strong support/resistance may lie.
- Silver Paint Strip = 0.50 retrace, Gold = 0.618-0.65, and the Red/Green between indicates the direction of the (Fib) Trend as H->L or L->H
- Paints 0.144 and 0.886 ranges Blue, and these are typically extremes or possible reversal zones. (PRZ)
DG Fib Direction (MTF)This indicator shows whether the pair is in a fib long or short on 6 different timeframes which gives you an overall direction of price.
When the circles are red, it means price should go down.
When the circle is green, it means price should go up.
This can be used on any timeframes or pairs.

™TradeChartist Levels Generator V4"™TradeChartist Levels Generator" is an easy to use script that can be used by traders of all levels from beginners to advanced professionals.
What does the script do?
Plots the support and resistance levels automatically based on user preference of Local levels of Lower or Higher Timeframe from indicator settings.
Plots Fibonacci retracement levels between high and low based on 'Days' or 'Candles' lookback from indicator settings.
The script proves to be very effective when used with another indicator for trend confirmation like the ribbon (not included in this script) shown on chart.
What markets can this script be used on?
Forex
Stocks
Commodities
Cryptocurrencies
and almost any asset on Trading View
What is the difference between "Plot Levels" and "Plot Fibonacci Levels"?
"Plot Levels" plots support and resistance levels automatically without any input from the user other than preferred levels 'plot' from the indicator settings namely
Plot Local Levels for Higher TF - Plots all important Support/Resistance levels for mostly higher time frames (1hr or higher) - Short to Mid term outlook
Plot Local Levels for Lower TF - Plots all important Support/Resistance levels for mostly smaller time frames (can be used for up to 1hr in most cases) -
Recommended for Scalping/Swing Trading mostly dependent on volatility
"Plot Fibonacci Levels" plots all standard Fibonacci retracement levels - 0, 23.6%, 38.2%, 50%, 61.8%, 78.6% and 100% based on
"Days" Lookback - Fibonacci levels between High and Low based on number of days in the past, starting from the current day on any time frame chart
"Candles" Lookback - Fibonacci levels between High and Low based on number of candles in the past, starting from the current candle on any time frame chart
Can the Fibonacci levels be reversed?
Yes. The Fibonacci levels can be reversed by checking the "Reverse" checkbox from the indicator settings. This is very handy if the trend looks like there may be a support or resistance from one of the Fib levels and a possibility of a new high or a new low based on the price action.
What is the need for "Plot 1.272 Fibonacci Level" under "Plot Fibonacci Levels"?
1.272 is an important Fibonacci number as it is the square root of 1.618 and is the near support or resistance after 100% price retracement. Even though it keeps moving on the chart dependent on the new high or new low based on Days/Candles lookback, it serves as a 'nice to have' reference for any trader looking beyond 100% retracement for support/resistance .
Why do the 'local levels' lines' color changes between green and red?
The nearby levels lines change color based on price closing above or below them. This happens to only closest local levels for lower TF near price action and for top/bottom lines of the local levels for higher TF.
The line turns green when it becomes support as price closes above it.
The line turns red when it becomes resistance as price closes below it.
This is a free to use indicator. Give a thumbs up or leave a comment if you like the script.
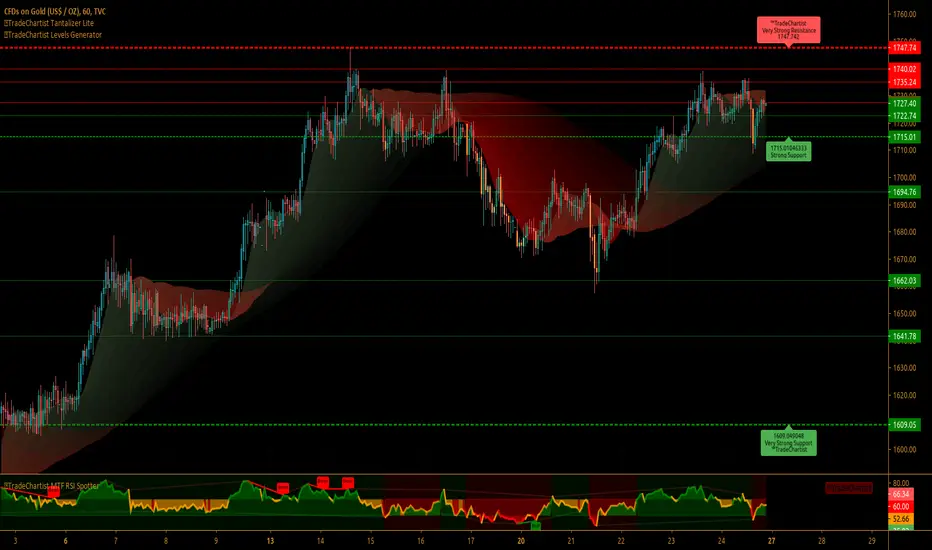
Chart Killer - Dynamic FibsChart Killer presents Dynamic Fibonnaci levels.
Just like the regular fibonacci, but this one is dynamic.
Easy to see your targets or entry points on it.
Fibs included:
- 0
- 0.236
- 0.382
- 0.5
- 0.618
- 0.786
- 1

Fibonacci Drapes (Dynamic Fib Tool)Automatic Fibs with main levels outlined and ranges shown in background colors. You can change the lengths and the color/look of all parts of this indicator. Have fun!


PDF {pSAR /w HiLo Trends + Fib Retrace/Extension Levels}parabolic SAR /w HighLow Trends Indicator/Bar-color-marking + Dynamic Fib Retrace and Extension Level
~ * ~ * ~ * ~ * ~ * ~ * ~ * ~ * ~ * ~ * ~ * ~ * ~ * ~ * ~ * ~ * ~ * ~ * ~ * ~ * ~
Note:
In no way is this intended as a financial/investment/trading advice. You are responsible for your own investment decisions and trades.
Please exercise your own judgement for your own trades base on your own risk-aversion level and goals as an investor or a trader. The use of OTHER indicators and analysis in conjunction (tailored to your own style of investing/trading) will help improve confidence of your analysis, for you to determine your own trade decisions.
~ * ~ * ~ * ~ * ~ * ~ * ~ * ~ * ~ * ~ * ~ * ~ * ~ * ~ * ~ * ~ * ~ * ~ * ~ * ~ * ~
Please check out my other indicators sets and series, e.g.
LIVIDITIUM (dynamic levels),
AEONDRIFT (standard deviation bands),
FUSIONGAPS (MA based oscillators),
MAJESTIC (Momentum/Acceleration/Jerk Oscillators),
PRISM (pSAR based oscillator, with RSI/StochRSI as well as Momentum/Acceleration/Jerk indicators),
and more to come.
Constructive feedback and suggestions are welcome.
~ JuniAiko
(=^~^=)v~


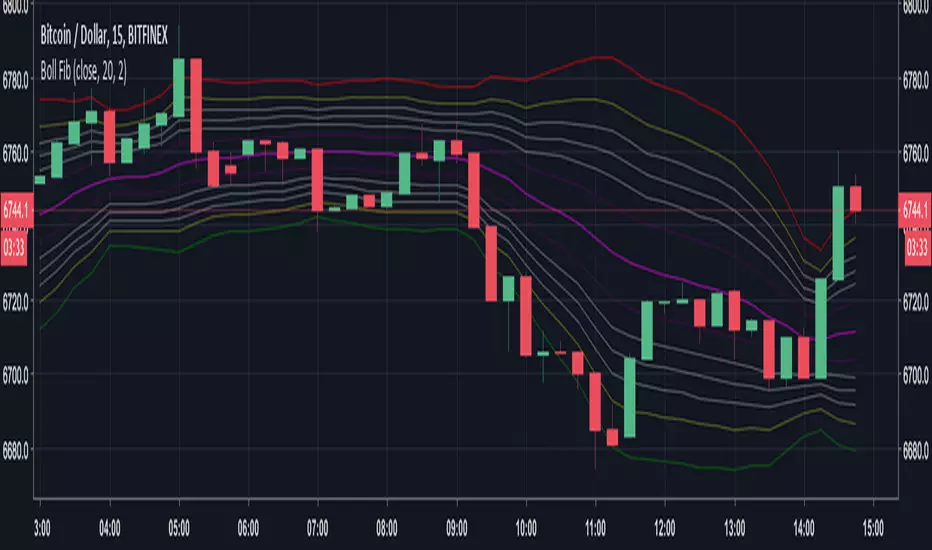
linear and Bollingers Bands and Fibonacci ratios This model give us the following
1 .linear regression channel
2.dynamic upper and lower fibs
3. upper and lower bollinger bands
each specific to the time frame that you use
So by using all 3 in one indicator it easy to see ressistance and support level

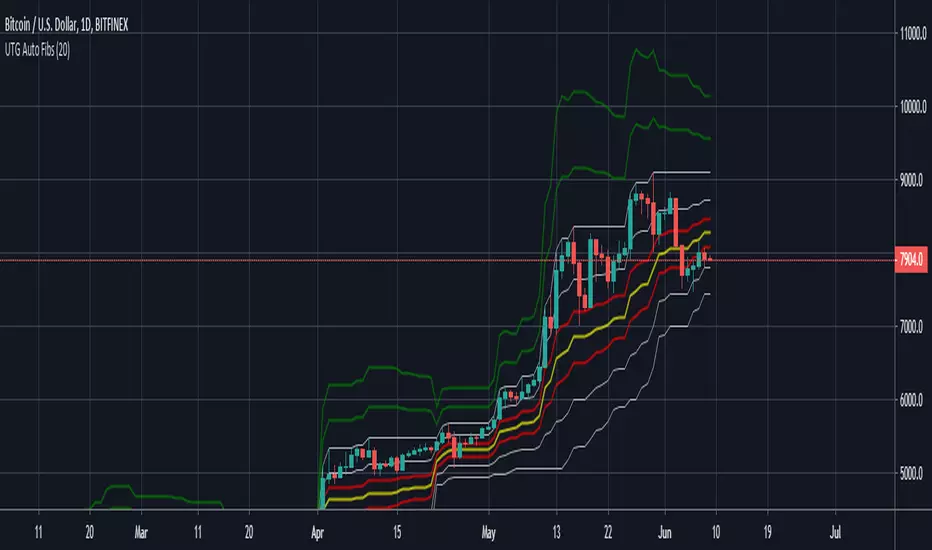
UTG Auto FibsAuto plotting Fib levels based on previous strong pivot points.
colors are customization, but default is as follows
green - 1.618 extension
green - 1.272 extension
white - top of pivot
white - .23 retracement
red -.38 retracement
yellow - .50 retracement
red - .61 retracement
white - .78 retracement
white - bottom of pivot
Pickledeggtradermans Moving Averages + FibHey i've posted a script that allows upto 5 sma's, 2 ema's and also live fib levels. Let me know what you think. Enjoy


TB!Guppy,Fib GMMA, VWap Resistance, Liquidity PoolThis is an assistive chart for the TB! Fibonacci Elliot Wave Oscillator indicator
It incorporates Fib Based fractalized GMMA , Liquidity Pool Theory and VWap based resistance zones.

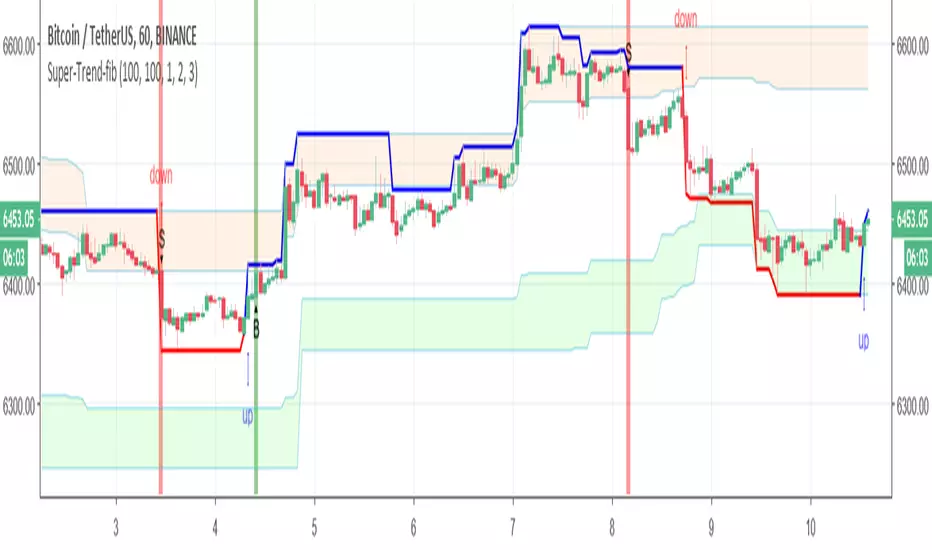
Super-Trend-fibIn this model we have fib Donchian channel with super trend alerts (B=buy) S =sell
and trailing volume system up trend alert and down trend alert
so have fun