reversalchartpatternsLibrary "reversalchartpatterns"
User Defined Types and Methods for reversal chart patterns - Double Top, Double Bottom, Triple Top, Triple Bottom, Cup and Handle, Inverted Cup and Handle, Head and Shoulders, Inverse Head and Shoulders
method delete(this)
Deletes the drawing components of ReversalChartPatternDrawing object
Namespace types: ReversalChartPatternDrawing
Parameters:
this (ReversalChartPatternDrawing) : ReversalChartPatternDrawing object
Returns: current ReversalChartPatternDrawing object
method delete(this)
Deletes the drawing components of ReversalChartPattern object. In turn calls the delete of ReversalChartPatternDrawing
Namespace types: ReversalChartPattern
Parameters:
this (ReversalChartPattern) : ReversalChartPattern object
Returns: current ReversalChartPattern object
method lpush(this, obj, limit, deleteOld)
Array push with limited number of items in the array. Old items are deleted when new one comes and exceeds the limit
Namespace types: array
Parameters:
this (array) : array object
obj (ReversalChartPattern) : ReversalChartPattern object which need to be pushed to the array
limit (int) : max items on the array. Default is 10
deleteOld (bool) : If set to true, also deletes the drawing objects. If not, the drawing objects are kept but the pattern object is removed from array. Default is false.
Returns: current ReversalChartPattern object
method draw(this)
Draws the components of ReversalChartPatternDrawing
Namespace types: ReversalChartPatternDrawing
Parameters:
this (ReversalChartPatternDrawing) : ReversalChartPatternDrawing object
Returns: current ReversalChartPatternDrawing object
method draw(this)
Draws the components of ReversalChartPatternDrawing within the ReversalChartPattern object.
Namespace types: ReversalChartPattern
Parameters:
this (ReversalChartPattern) : ReversalChartPattern object
Returns: current ReversalChartPattern object
method scan(zigzag, patterns, errorPercent, shoulderStart, shoulderEnd, allowedPatterns, offset)
Scans zigzag for ReversalChartPattern occurences
Namespace types: zg.Zigzag
Parameters:
zigzag (Zigzag type from Trendoscope/Zigzag/11) : ZigzagTypes.Zigzag object having array of zigzag pivots and other information on each pivots
patterns (array) : Existing patterns array. Used for validating duplicates
errorPercent (float) : Error threshold for considering ratios. Default is 13
shoulderStart (float) : Starting range of shoulder ratio. Used for identifying shoulders, handles and necklines
shoulderEnd (float) : Ending range of shoulder ratio. Used for identifying shoulders, handles and necklines
allowedPatterns (array) : array of int containing allowed pattern types
offset (int) : Offset of zigzag to consider only confirmed pivots
Returns: int pattern type
method createPattern(zigzag, patternType, patternColor, properties, offset)
Create Pattern from ZigzagTypes.Zigzag object
Namespace types: zg.Zigzag
Parameters:
zigzag (Zigzag type from Trendoscope/Zigzag/11) : ZigzagTypes.Zigzag object having array of zigzag pivots and other information on each pivots
patternType (int) : Type of pattern being created. 1 - Double Tap, 2 - Triple Tap, 3 - Cup and Handle, 4 - Head and Shoulders
patternColor (color) : Color in which the patterns are drawn
properties (ReversalChartTradeProperties)
offset (int)
Returns: ReversalChartPattern object created
method getName(this)
get pattern name of ReversalChartPattern object
Namespace types: ReversalChartPattern
Parameters:
this (ReversalChartPattern) : ReversalChartPattern object
Returns: string name of the pattern
method getDescription(this)
get consolidated description of ReversalChartPattern object
Namespace types: ReversalChartPattern
Parameters:
this (ReversalChartPattern) : ReversalChartPattern object
Returns: string consolidated description
method init(this)
initializes the ReversalChartPattern object and creates sub object types
Namespace types: ReversalChartPattern
Parameters:
this (ReversalChartPattern) : ReversalChartPattern object
Returns: ReversalChartPattern current object
ReversalChartPatternDrawing
Type which holds the drawing objects for Reversal Chart Pattern Types
Fields:
patternLines (array type from Trendoscope/Drawing/2) : array of Line objects representing pattern
entry (Line type from Trendoscope/Drawing/2) : Entry price Line
targets (array type from Trendoscope/Drawing/2)
stop (Line type from Trendoscope/Drawing/2) : Stop price Line
patternLabel (Label type from Trendoscope/Drawing/2)
ReversalChartTradeProperties
Trade properties of ReversalChartPattern
Fields:
riskAdjustment (series float) : Risk Adjustment for calculation of stop
useFixedTarget (series bool) : Boolean flag saying use fixed target type wherever possible. If fixed target type is not possible, then risk reward/fib ratios are used for calculation of targets
variableTargetType (series int) : Integer value which defines whether to use fib based targets or risk reward based targets. 1 - Risk Reward, 2 - Fib Ratios
variableTargetRatios (array) : Risk reward or Fib Ratios to be used for calculation of targets when fixed target is not possible or not enabled
entryPivotForWm (series int) : which Pivot should be considered as entry point for WM patterns. 0 refers to the latest breakout pivot where as 5 refers to initial pivot of the pattern
ReversalChartPattern
Reversal Chart Pattern master type which holds the pattern components, drawings and trade details
Fields:
pivots (array type from Trendoscope/Zigzag/11) : Array of Zigzag Pivots forming the pattern
patternType (series int) : Defines the main type of pattern 1 - Double Tap, 1 - Triple Tap, 3 - Cup and Handle, 4 - Head and Shoulders, 5- W/M Patterns, 6 - Full Trend, 7 - Half Trend
patternColor (series color) : Color in which the pattern will be drawn on chart
properties (ReversalChartTradeProperties)
drawing (ReversalChartPatternDrawing) : ReversalChartPatternDrawing object which holds the drawing components
trade (Trade type from Trendoscope/TradeTracker/1) : TradeTracker.Trade object holding trade components
Cari dalam skrip untuk "fib"

Vietnamese Stocks: Multi-Ticker Fibonacci AlertThis Pine Script™ indicator is designed specifically for traders monitoring the Vietnamese stock market (HOSE, HNX). Its primary goal is to automate the tracking of Fibonacci retracement levels across a large list of stocks, alerting you when prices breach key support zones.
Core Functionality:
The script calculates Fibonacci retracement levels (23.6%, 38.2%, 50%, 61.8%, 78.6%) for up to 40 tickers simultaneously. The calculation is based on the highest high and lowest low identified since a user-defined Start Time. This allows you to anchor the Fibonacci analysis to a specific market event, trend start, or time period relevant to your strategy.
What it Does For You:
Automated Watchlist Scanning: Instead of drawing Fib levels on dozens of charts, select one of the two pre-configured watchlists (up to 40 symbols each, customizable in settings) populated with popular Vietnamese stocks.
Time-Based Fibonacci: Define a Start Time in the settings. The script uses this date to find the subsequent highest high and lowest low for each symbol in your chosen watchlist, forming the basis for the Fib calculation.
Intelligent Alerts: Get notified via TradingView's alerts when the candle closing price of any stock in your active watchlist falls below the critical 38.2%, 50%, 61.8%, or 78.6% levels relative to its own high/low range since the start time. Alerts are consolidated for efficiency.
Visual Aids:
- Plots the same time-based Fibonacci levels directly on your current chart symbol for quick reference.
- Includes an optional on-chart table showing which monitored stocks are currently below key Fib levels (enable "Show Debug Info").
- Features experimental background coloring to highlight potential bullish signals on the current chart.
Configuration:
Start Time: Crucial input – sets the anchor point for Fib calculations.
WatchList Selection: Choose between WatchList #1 (Bluechip/Midcap focus) or WatchList #2 (Defensive/Other focus) using the boolean toggles.
Symbol Customization: Easily replace the default symbols with your preferred Vietnamese stocks directly in the indicator settings.
Notification Prefix: Add custom text to the beginning of your alert messages.
Alert Setup: Remember to create an alert in TradingView, selecting this indicator and the alert() condition, usually with "Once Per Bar Close" frequency.
This tool is open-source under the MPL 2.0 license. Feel free to use, modify, and learn from it.

Midnight Range Standard DeviationsCredit to Lex Fx for the basic framework of this script
This indicator is designed to assist traders in identifying potential trading opportunities based on the Intraday Concurrency Technique (ICT) concepts, specifically the midnight range deviations and their relationship to Fibonacci levels. It builds upon the work of Lex-FX, whom we gratefully acknowledge for the original concept and inspiration for this indicator.
Core Concept: ICT Midnight Range
The core of this indicator revolves around the concept of the midnight range. According to ICT, the high and low formed in a specific time window (typically the first 30 minutes after midnight, New York Time) can serve as a key reference point for intraday price action. The indicator identifies this range and projects potential support and resistance levels based on deviations from this range, combined with Fibonacci ratios.
How ICT Uses Midnight Range Deviations
ICT methodology often involves looking for price to move away from the initial midnight range, then return to it, or deviate beyond it, as key areas for potential entries.
Range Identification: The indicator automatically identifies the high and low of the midnight range (00:00 - 00:30 NY Time).
Deviation Levels: The indicator calculates and displays deviation levels based on multiples of the initial midnight range. These levels are often used to identify potential areas of support and resistance, as well as potential targets for price movement. These levels can be set in the additional fib levels section, which can be configured in increments of .5 deviations all the way up to 12 deviations.
Fibonacci Confluence: ICT often emphasizes the confluence of multiple factors. This indicator adds Fibonacci levels to the midnight range deviations. This allows traders to identify areas where Fibonacci retracements or extensions align with the deviation levels, potentially creating stronger areas of support or resistance.
Looking for Sweeps: ICT often uses these levels to look for times that the high and low are swept as potential areas of liquidity, indicating the start of potential continuations.
Time-Based Analysis: The time at which price interacts with these levels can also be significant in ICT. The indicator provides options to extend the range lines to specific times (e.g., 3 hours, 6 hours, 10 hours, 12 hours, or a custom defined time) after midnight, allowing traders to focus on specific periods of the trading day.
Indicator Settings Explained:
Time Zone (TZ): Defines the time zone used for calculating the midnight range. The default is "America/New_York".
Range High Color, Range Low Color, Range Mid Color: Customize the colors of the high, low, and mid-range lines.
Range Fill Color: Sets the fill color for the area between the range high and low.
Line Style: Choose the style of the range lines (solid, dashed, dotted).
Range Line Thickness: Adjust the thickness of the range lines for better visibility.
Show Fibonacci Levels: Enable or disable the display of Fibonacci deviation levels.
Fib Up Color, Fib Down Color: Customize the colors of the Fibonacci levels above (up) and below (down) the midnight range.
Show Trendline: Enables a trendline that plots the close price, colored according to whether the price is above the high, below the low, or within the midnight range.
Show Range Lines, Show Range Labels: Toggles the visibility of the range lines and their associated labels.
Label Size: Adjust the size of the labels for better readability.
Hide Prices: Option to display only the deviation values on labels, hiding price values.
Place Fibonacci Labels on Left Side: Option to switch label position from right side to left side.
Extend Range To (Hours from Midnight): This section gives you a wide variety of options on how far you want to extend the range to, you can do 3,6,10,12, and 23 hours. Alternatively, you can select the "Use Custom Length" and set a specific time in hours.
Additional Fib Levels: This section allows the trader to set additional deviation points in increments of .5 deviations from .5 all the way up to 12 deviations
TradingView Community Guidelines Compliance:
This indicator description adheres to the TradingView community guidelines by:
Being educational: It explains the ICT methodology and how the indicator can be used in trading.
Being transparent: It clearly describes all the indicator's settings and their purpose.
Providing credit: It acknowledges Lex-FX as the original author of the concept.
Avoiding misleading claims: It does not guarantee profits or imply that the indicator is a "holy grail."
Disclaimer: Usage of this indicator and the information provided is at your own risk. The author is not responsible for any losses incurred as a result of using this indicator.
Important Considerations:
This indicator is intended for educational purposes and to assist in applying the ICT methodology.
It should not be used as a standalone trading system.
Always combine this indicator with other forms of technical analysis and risk management techniques.
Backtest thoroughly on your chosen market and timeframe before using in live trading.
Trading involves risk. Only trade with capital you can afford to lose.

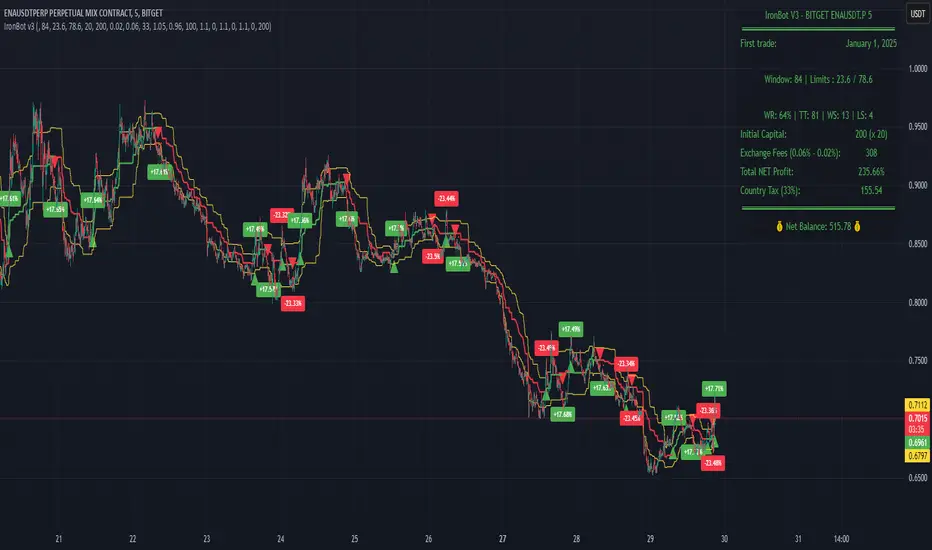
IronBot v3Introduction
IronBot V3 is a TradingView indicator that analyzes market trends, identifies potential trading opportunities, and helps manage trades by visualizing entry points, stop-loss levels, and take-profit targets.
How It Works
The indicator evaluates price action within a specified analysis window to determine market trends. It uses Fibonacci retracement levels to identify key price levels for trend detection and trading signals. Based on user-defined inputs, it calculates and displays trade levels, including entry points, stop-loss, and multiple take-profit levels.
Trend Definition:
The highest high and lowest low are calculated over a specified number of candles.
The price range is determined as the difference between the highest high and lowest low.
Three Fibonacci levels are calculated within this range:
- Fib Level 0.236
- Trend Line (0.5 level)
- Fib Level 0.786
Determining Long and Short Conditions:
Long Conditions (Buy):
The closing price must be above both the trend line (0.5 level) and the Fib Level 0.236.
Additionally, the market must not currently be in a bearish trend.
Short Conditions (Sell):
The closing price must be below both the trend line and the Fib Level 0.786.
The market must not currently be in a bullish trend.
Trend State Updates:
When a condition is met, the indicator sets the trend to bullish or bearish and turns off bearish or bullish trend conditions.
If neither buy nor sell conditions are met, the trend remains unchanged, and no new trade signals are generated.
Inputs and Their Role in the Algorithm
General Settings
Analysis Window: Specifies the number of historical candles to analyze. This influences the calculation of key levels such as highs and lows, which are critical for determining Fibonacci retracement levels.
First Trade: Defines the start date for generating trading signals.
Trade Configuration
Display TP/SL: Enables or disables the visualization of take-profit and stop-loss levels on the chart.
Leverage: Defines the leverage applied to trades for risk and position size calculations.
Initial Capital: Specifies the starting capital, which is used for calculating position sizes and profits.
Exchange Fees (%): Sets the percentage of fees applied by the exchange, which is factored into profit calculations.
Country Tax (%): Allows users to define applicable taxes, which are subtracted from net profits.
Stop-Loss Configuration
Break Even: Toggles the break-even functionality. When enabled, the stop-loss level adjusts dynamically as take-profit levels are reached.
Stop Loss (%): Defines the percentage distance from the entry price to the stop-loss level.
Take-Profit Settings
The indicator supports up to four take-profit levels:
- TP1 through TP4 Ratios: Specify the price levels for each take-profit target as a percentage of the entry price.
- Profit Percentages: Allocate a percentage of the position size to each take-profit level.
Visualization Elements
Trend Indicators: Displays Fibonacci-based trend lines and markers for bullish or bearish conditions.
Trade Levels: Entry, stop-loss, and take-profit levels are visualized on the chart by dotted lines for clarity. Additionally, a semi-transparent background is applied when a portion of the trade is closed to enhance visualization. Positive profits from a closed trade are green; otherwise, they are red.
Trade Profit Indicator: On each trade, every time a part of the trade is closed (e.g., take profit is reached), the profit indicator will be updated.
Performance Panel: Summarizes key account statistics, including net balance, profit/loss, and trading performance metrics.
Usage Guidelines
Add the indicator to your TradingView chart.
Configure the input settings based on your trading strategy.
Use the displayed levels and trend signals to make informed trading decisions.
Contact
For further assistance, including automation inquiries, feel free to contact me through TradingView’s messaging system.
Purpose and Disclaimer
IronBot V3 is designed for educational purposes and to assist in analyzing market trends. It is not financial advice, and users should perform their own due diligence before making any trading decisions.
Trading involves significant risk, and past performance is not indicative of future results. Use this indicator responsibly.
DTFX Algo Zones [LuxAlgo]DTFX Algo Zones are auto-generated Fibonacci Retracements based on market structure shifts.
These retracement levels are intended to be used as support and resistance levels to look for price to bounce off of to confirm direction.
🔶 USAGE
Due to the retracement levels only being generated from identified market structure shifts, the retracements are confined to only draw from areas considered more important due to the technical Break of Structure (BOS) or Change of Character (CHoCH).
The simple action that causes a market structure shift occurs is price breaking above or below a specific swing point. When a market structure shift happens, a retracement is drawn from the point of break to the highest or lowest point since that point. Due to the price action necessary for a market structure shift, these retracements will not always be immediately actionable.
These retracement levels are intended to be used as points to watch for price to retrace to and bounce from, confirming the current direction of price.
In the example below, after the retracement is initiated, by bouncing off of the retracement levels formed from the previous market structure shift it would further confirm the bias of the market structure shift. A break going through these levels would display a weakness from the current market structure shift, implying that it could simply be noise.
🔶 DETAILS
The script uses standard SMC Market structure identification to determine Break of Structures (BOS) and Change of Characters (CHoCH). The specific swing points can be identified by the shapes placed above or below the specific swing high/low candle.
By unchecking the "Display All Zones" setting, users are able to specify the exact number of retracement zones to display using the "Show Last" parameter. This is handy for cleaning up the chart to stay focused on the most recent retracements.
Additionally, when displaying multiple zones, the "Clean-Up Level Overlap" setting may be helpful for decluttering as well. This option optimizes the display of retracement levels to minimize their overlap on other adjacent zones.
The script allows for up to 5 Fib levels to be displayed from each zone, with options for display, value, line style, and color for each of the 5.
The calculation for Fib Levels changes depending on the direction of market structure shifts. When an upwards (Bullish) zone is generated, the retracement is drawn with the bottom of the zone being 0 and the top of the zone being 1. This is reversed for downwards (Bearish) zones.
🔶 SETTINGS
Structure Length: Sets the SMC structure length to use for finding MMS.
Show Last: Displays this number of retracement zones. (Display All Zones Must be Unchecked)
Display All Zones: Ignores "Show Last" number and displays all historical MMS Retracement Zones.
Zone Display: Choose which zones to display, only bearish, only bullish, or both.
Clean-Up Level Overlap: Minimizes overlap between adjacent zones and levels.
Fib Levels: Settings to display and customize up to 5 Fib levels for each zone.

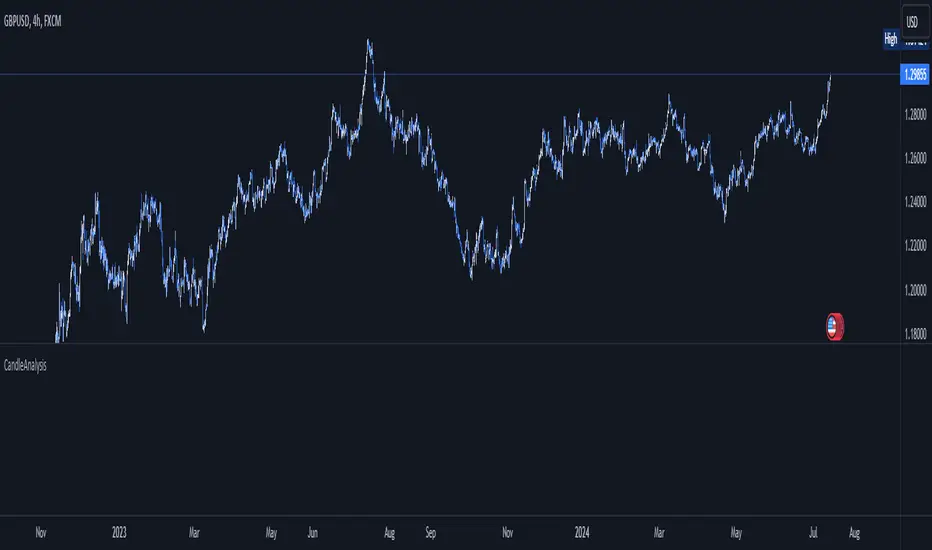
CandleAnalysisLibrary "CandleAnalysis"
A collection of frequently used candle analysis functions in my scripts.
isBullish(barsBack)
Checks if a specific bar is bullish.
Parameters:
barsBack (int) : (int) The number of bars to look back. The default is 0 (current bar).
Returns: True if the bar is bullish, otherwise returns false.
isBearish(barsBack)
Checks if a specific bar is bearish.
Parameters:
barsBack (int) : (int) The number of bars to look back. The default is 0 (current bar).
Returns: True if the bar is bearish, otherwise returns false.
isBE(barsBack)
Checks if a specific bar is break even.
Parameters:
barsBack (int) : (int) The number of bars to look back. The default is 0 (current bar).
Returns: True if the bar is break even, otherwise returns false.
getBodySize(barsBack, inPriceChg)
Calculates a specific candle's body size.
Parameters:
barsBack (int) : (int) The number of bars to look back. The default is 0 (current bar).
inPriceChg (bool) : (bool) True to return the body size as a price change value. The default is false (in points).
Returns: The candle's body size in points.
getTopWickSize(barsBack, inPriceChg)
Calculates a specific candle's top wick size.
Parameters:
barsBack (int) : (int) The number of bars to look back. The default is 0 (current bar).
inPriceChg (bool) : (bool) True to return the wick size as a price change value. The default is false (in points).
Returns: The candle's top wick size in points.
getBottomWickSize(barsBack, inPriceChg)
Calculates a specific candle's bottom wick size.
Parameters:
barsBack (int) : (int) The number of bars to look back. The default is 0 (current bar).
inPriceChg (bool) : (bool) True to return the wick size as a price change value. The default is false (in points).
Returns: The candle's bottom wick size in points.
getBodyPercent(barsBack)
Calculates a specific candle's body size as a percentage of its entire size including its wicks.
Parameters:
barsBack (int) : (int) The number of bars to look back. The default is 0 (current bar).
Returns: The candle's body size percentage.
isHammer(fib, bullish, barsBack)
Checks if a specific bar is a hammer candle based on a given fibonacci level.
Parameters:
fib (float) : (float) The fibonacci level to base candle's body on. The default is 0.382.
bullish (bool) : (bool) True if the candle must to be green. The default is false.
barsBack (int) : (int) The number of bars to look back. The default is 0 (current bar).
Returns: True if the bar matches the requirements of a hammer candle, otherwise returns false.
isShootingStar(fib, bearish, barsBack)
Checks if a specific bar is a shooting star candle based on a given fibonacci level.
Parameters:
fib (float) : (float) The fibonacci level to base candle's body on. The default is 0.382.
bearish (bool) : (bool) True if the candle must to be red. The default is false.
barsBack (int) : (int) The number of bars to look back. The default is 0 (current bar).
Returns: True if the bar matches the requirements of a shooting star candle, otherwise returns false.
isDoji(wickSize, bodySize, barsBack)
Checks if a specific bar is a doji candle based on a given wick and body size.
Parameters:
wickSize (float) : (float) The maximum top wick size compared to the bottom and vice versa. The default is 1.5.
bodySize (float) : (bool) The maximum body size as a percentage compared to the entire candle size. The default is 5.
barsBack (int) : (int) The number of bars to look back. The default is 0 (current bar).
Returns: True if the bar matches the requirements of a doji candle.
isBullishEC(gapTolerance, rejectionWickSize, engulfWick, barsBack)
Checks if a specific bar is a bullish engulfing candle.
Parameters:
gapTolerance (int)
rejectionWickSize (int) : (int) The maximum top wick size compared to the body as a percentage. The default is 10.
engulfWick (bool) : (bool) True if the engulfed candle's wick requires to be engulfed as well. The default is false.
barsBack (int) : (int) The number of bars to look back. The default is 0 (current bar).
Returns: True if the bar matches the requirements of a bullish engulfing candle.
isBearishEC(gapTolerance, rejectionWickSize, engulfWick, barsBack)
Checks if a specific bar is a bearish engulfing candle.
Parameters:
gapTolerance (int)
rejectionWickSize (int) : (int) The maximum bottom wick size compared to the body as a percentage. The default is 10.
engulfWick (bool) : (bool) True if the engulfed candle's wick requires to be engulfed as well. The default is false.
barsBack (int) : (int) The number of bars to look back. The default is 0 (current bar).
Returns: True if the bar matches the requirements of a bearish engulfing candle.
MarcosLibraryLibrary "MarcosLibrary"
A colection of frequently used functions in my scripts.
bullFibRet(priceLow, priceHigh, fibLevel)
Calculates a bullish fibonacci retracement value.
Parameters:
priceLow (float) : (float) The lowest price point.
priceHigh (float) : (float) The highest price point.
fibLevel (float) : (float) The fibonacci level to calculate.
Returns: The fibonacci value of the given retracement level.
bearFibRet(priceLow, priceHigh, fibLevel)
Calculates a bearish fibonacci retracement value.
Parameters:
priceLow (float) : (float) The lowest price point.
priceHigh (float) : (float) The highest price point.
fibLevel (float) : (float) The fibonacci level to calculate.
Returns: The fibonacci value of the given retracement level.
bullFibExt(priceLow, priceHigh, thirdPivot, fibLevel)
Calculates a bullish fibonacci extension value.
Parameters:
priceLow (float) : (float) The lowest price point.
priceHigh (float) : (float) The highest price point.
thirdPivot (float) : (float) The third price point.
fibLevel (float) : (float) The fibonacci level to calculate.
Returns: The fibonacci value of the given extension level.
bearFibExt(priceLow, priceHigh, thirdPivot, fibLevel)
Calculates a bearish fibonacci extension value.
Parameters:
priceLow (float) : (float) The lowest price point.
priceHigh (float) : (float) The highest price point.
thirdPivot (float) : (float) The third price point.
fibLevel (float) : (float) The fibonacci level to calculate.
Returns: The fibonacci value of the given extension level.
isBullish(barsBack)
Checks if a specific bar is bullish.
Parameters:
barsBack (int) : (int) The number of bars to look back. The default is 0 (current bar).
Returns: True if the bar is bullish, otherwise returns false.
isBearish(barsBack)
Checks if a specific bar is bearish.
Parameters:
barsBack (int) : (int) The number of bars to look back. The default is 0 (current bar).
Returns: True if the bar is bearish, otherwise returns false.
isBE(barsBack)
Checks if a specific bar is break even.
Parameters:
barsBack (int) : (int) The number of bars to look back. The default is 0 (current bar).
Returns: True if the bar is break even, otherwise returns false.
getBodySize(barsBack, inPriceChg)
Calculates a specific candle's body size.
Parameters:
barsBack (int) : (int) The number of bars to look back. The default is 0 (current bar).
inPriceChg (bool) : (bool) True to return the body size as a price change value. The default is false (in points).
Returns: The candle's body size in points.
getTopWickSize(barsBack, inPriceChg)
Calculates a specific candle's top wick size.
Parameters:
barsBack (int) : (int) The number of bars to look back. The default is 0 (current bar).
inPriceChg (bool) : (bool) True to return the wick size as a price change value. The default is false (in points).
Returns: The candle's top wick size in points.
getBottomWickSize(barsBack, inPriceChg)
Calculates a specific candle's bottom wick size.
Parameters:
barsBack (int) : (int) The number of bars to look back. The default is 0 (current bar).
inPriceChg (bool) : (bool) True to return the wick size as a price change value. The default is false (in points).
Returns: The candle's bottom wick size in points.
getBodyPercent(barsBack)
Calculates a specific candle's body size as a percentage of its entire size including its wicks.
Parameters:
barsBack (int) : (int) The number of bars to look back. The default is 0 (current bar).
Returns: The candle's body size percentage.
isHammer(fib, bullish, barsBack)
Checks if a specific bar is a hammer candle based on a given fibonacci level.
Parameters:
fib (float) : (float) The fibonacci level to base candle's body on. The default is 0.382.
bullish (bool) : (bool) True if the candle must to be green. The default is false.
barsBack (int) : (int) The number of bars to look back. The default is 0 (current bar).
Returns: True if the bar matches the requirements of a hammer candle, otherwise returns false.
isShootingStar(fib, bearish, barsBack)
Checks if a specific bar is a shooting star candle based on a given fibonacci level.
Parameters:
fib (float) : (float) The fibonacci level to base candle's body on. The default is 0.382.
bearish (bool) : (bool) True if the candle must to be red. The default is false.
barsBack (int) : (int) The number of bars to look back. The default is 0 (current bar).
Returns: True if the bar matches the requirements of a shooting star candle, otherwise returns false.
isDoji(wickSize, bodySize, barsBack)
Checks if a specific bar is a doji candle based on a given wick and body size.
Parameters:
wickSize (float) : (float) The maximum top wick size compared to the bottom and vice versa. The default is 1.5.
bodySize (float) : (bool) The maximum body size as a percentage compared to the entire candle size. The default is 5.
barsBack (int) : (int) The number of bars to look back. The default is 0 (current bar).
Returns: True if the bar matches the requirements of a doji candle.
isBullishEC(gapTolerance, rejectionWickSize, engulfWick, barsBack)
Checks if a specific bar is a bullish engulfing candle.
Parameters:
gapTolerance (int)
rejectionWickSize (int) : (int) The maximum top wick size compared to the body as a percentage. The default is 10.
engulfWick (bool) : (bool) True if the engulfed candle's wick requires to be engulfed as well. The default is false.
barsBack (int) : (int) The number of bars to look back. The default is 0 (current bar).
Returns: True if the bar matches the requirements of a bullish engulfing candle.
isBearishEC(gapTolerance, rejectionWickSize, engulfWick, barsBack)
Checks if a specific bar is a bearish engulfing candle.
Parameters:
gapTolerance (int)
rejectionWickSize (int) : (int) The maximum bottom wick size compared to the body as a percentage. The default is 10.
engulfWick (bool) : (bool) True if the engulfed candle's wick requires to be engulfed as well. The default is false.
barsBack (int) : (int) The number of bars to look back. The default is 0 (current bar).
Returns: True if the bar matches the requirements of a bearish engulfing candle.

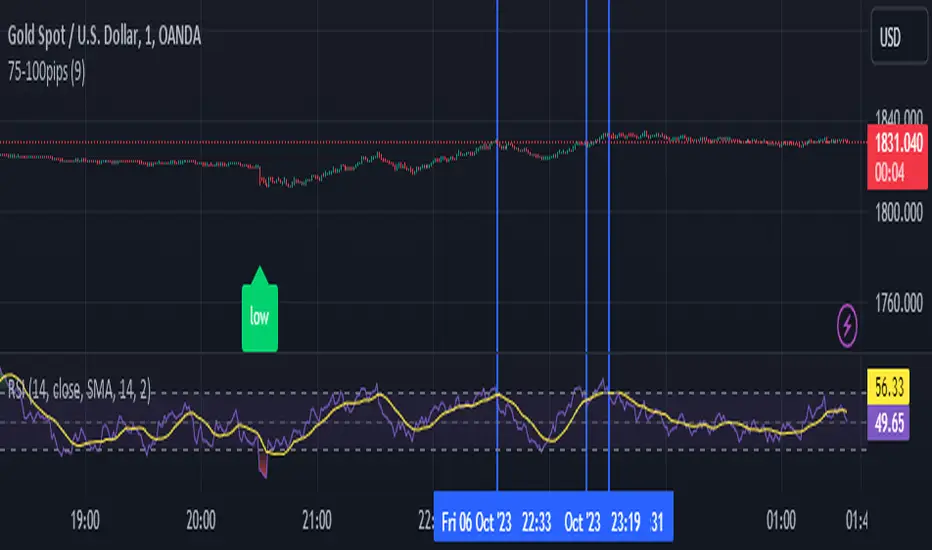
75-100pipsGreen/Red Arrowed Buy/Sell signals are just simple buy sell signals based on SuperTrend, VWAP, Bollinger, Linear Regression
Purple Arrowed Buy/Sell Signals happen when the price/candle cross over or under the yellow outer lines (4.236 fib lines) It's extremely rare and hard for price to stay above these lines therefore we can usually and comfortably buy/sell it, a key information here though when price pumps or dumps super fast and hard to the point of crossing these borders, the trend might also be extremely strong and continous so even if the price temporarily goes back inside the borders as the lines expand over time price can continue riding or crossing these lines back again and continue the uptrend/downtrend, therefore crossing these outer borders doesn't necessarilly and always mean a reversal is due.
When analyzing the instrument you're trading the important factors for support/resistance areas are usually the outer lines like i said previously it's super hard for price to be outside these and will almost always get back inside quickly. The Middle thicker green/red line which is Variable Index Dynamic Average should also be a nice pivot line for major support and resistance . All the other lines are also important dynamic support/resistance lines.
Their Importance Order
1- Outer Yellow Line (4.236 Fibs)
2- Thicker Middle Green/Red Line (VIDYA)
3- Thinner Upper/Lower Green/Red Line (VIDYA +3, VIDYA -3)
4- The Rest Of The Lines (Fib Lines)
You can use this indicator in any market condition in any market to determine key support/resistance levels, use it for mean reversion through price expanding to outside of the most outer line therefore being overbought/oversold basically using the purple buy/sell signals or only follow the normal buy/sell signals or use it in confluence with each other. You can also use this indicator in confluence with your own manual technical analysis or other indicators/strategies you are already using and are comfortable with.
A good part is the support/resistance lines from timeframe to timeframe pictures the whole situation quite well, you can use lower timeframe to find your entry/exit positions and higher timeframe to find your key support/resistance points, they all should be somewhat in confluence from timeframe to timeframe anyways. My recommendation would be to look at 1HR, 4HR and 1D charts for swing trading and 5-15 Min for quick scalping/day trading
You should still probably at least take a look to higher timeframes so that you don't get burned when you realize there is a huge resistance line at price XXXXX on the 4 hour chart but you're expecting it to go above it on the 5 minute chart, it can go above it temporarily but we analyze everything on a closing basis so it most likely won't close above it. Again don't take a position or FOMO when price breaks a support/resistance line, we're looking for a CLOSE above/below them and a retest to see if S/R flip happened would even be better.
Sometimes the most outer line won't be the 4.236 (Yellow) lines as when it gets quite volatile the Thinner Upper/Lower Green/Red Lines (VIDYA +3, VIDYA-3) might cross them to be the most outer line, in this case i have observed that the trend is extremely strong this time price almost always doesn't go above or below the VIDYA line but can stay outside of the Yellow 4.236 Fib line for an extended amount of time (price will still get back inside the channel relatively quickly, just not as fast as the normal condition)
With Proper Risk Management and Discipline this indicator can be of great use to you as it's surprisingly successful especially at mean reversion and pointing out the support/resistance lines, they are so much more successful than your average MA/EMA lines.
CNTLibraryLibrary "CNTLibrary"
Custom Functions To Help Code In Pinescript V5
Coded By Christian Nataliano
First Coded In 10/06/2023
Last Edited In 22/06/2023
Huge Shout Out To © ZenAndTheArtOfTrading and his ZenLibrary V5, Some Of The Custom Functions Were Heavily Inspired By Matt's Work & His Pine Script Mastery Course
Another Shout Out To The TradingView's Team Library ta V5
//====================================================================================================================================================
// Custom Indicator Functions
//====================================================================================================================================================
GetKAMA(KAMA_lenght, Fast_KAMA, Slow_KAMA)
Calculates An Adaptive Moving Average Based On Perry J Kaufman's Calculations
Parameters:
KAMA_lenght (int) : Is The KAMA Lenght
Fast_KAMA (int) : Is The KAMA's Fastes Moving Average
Slow_KAMA (int) : Is The KAMA's Slowest Moving Average
Returns: Float Of The KAMA's Current Calculations
GetMovingAverage(Source, Lenght, Type)
Get Custom Moving Averages Values
Parameters:
Source (float) : Of The Moving Average, Defval = close
Lenght (simple int) : Of The Moving Average, Defval = 50
Type (string) : Of The Moving Average, Defval = Exponential Moving Average
Returns: The Moving Average Calculation Based On Its Given Source, Lenght & Calculation Type (Please Call Function On Global Scope)
GetDecimals()
Calculates how many decimals are on the quote price of the current market © ZenAndTheArtOfTrading
Returns: The current decimal places on the market quote price
Truncate(number, decimalPlaces)
Truncates (cuts) excess decimal places © ZenAndTheArtOfTrading
Parameters:
number (float)
decimalPlaces (simple float)
Returns: The given number truncated to the given decimalPlaces
ToWhole(number)
Converts pips into whole numbers © ZenAndTheArtOfTrading
Parameters:
number (float)
Returns: The converted number
ToPips(number)
Converts whole numbers back into pips © ZenAndTheArtOfTrading
Parameters:
number (float)
Returns: The converted number
GetPctChange(value1, value2, lookback)
Gets the percentage change between 2 float values over a given lookback period © ZenAndTheArtOfTrading
Parameters:
value1 (float)
value2 (float)
lookback (int)
BarsAboveMA(lookback, ma)
Counts how many candles are above the MA © ZenAndTheArtOfTrading
Parameters:
lookback (int)
ma (float)
Returns: The bar count of how many recent bars are above the MA
BarsBelowMA(lookback, ma)
Counts how many candles are below the MA © ZenAndTheArtOfTrading
Parameters:
lookback (int)
ma (float)
Returns: The bar count of how many recent bars are below the EMA
BarsCrossedMA(lookback, ma)
Counts how many times the EMA was crossed recently © ZenAndTheArtOfTrading
Parameters:
lookback (int)
ma (float)
Returns: The bar count of how many times price recently crossed the EMA
GetPullbackBarCount(lookback, direction)
Counts how many green & red bars have printed recently (ie. pullback count) © ZenAndTheArtOfTrading
Parameters:
lookback (int)
direction (int)
Returns: The bar count of how many candles have retraced over the given lookback & direction
GetSwingHigh(Lookback, SwingType)
Check If Price Has Made A Recent Swing High
Parameters:
Lookback (int) : Is For The Swing High Lookback Period, Defval = 7
SwingType (int) : Is For The Swing High Type Of Identification, Defval = 1
Returns: A Bool - True If Price Has Made A Recent Swing High
GetSwingLow(Lookback, SwingType)
Check If Price Has Made A Recent Swing Low
Parameters:
Lookback (int) : Is For The Swing Low Lookback Period, Defval = 7
SwingType (int) : Is For The Swing Low Type Of Identification, Defval = 1
Returns: A Bool - True If Price Has Made A Recent Swing Low
//====================================================================================================================================================
// Custom Risk Management Functions
//====================================================================================================================================================
CalculateStopLossLevel(OrderType, Entry, StopLoss)
Calculate StopLoss Level
Parameters:
OrderType (int) : Is To Determine A Long / Short Position, Defval = 1
Entry (float) : Is The Entry Level Of The Order, Defval = na
StopLoss (float) : Is The Custom StopLoss Distance, Defval = 2x ATR Below Close
Returns: Float - The StopLoss Level In Actual Price As A
CalculateStopLossDistance(OrderType, Entry, StopLoss)
Calculate StopLoss Distance In Pips
Parameters:
OrderType (int) : Is To Determine A Long / Short Position, Defval = 1
Entry (float) : Is The Entry Level Of The Order, NEED TO INPUT PARAM
StopLoss (float) : Level Based On Previous Calculation, NEED TO INPUT PARAM
Returns: Float - The StopLoss Value In Pips
CalculateTakeProfitLevel(OrderType, Entry, StopLossDistance, RiskReward)
Calculate TakeProfit Level
Parameters:
OrderType (int) : Is To Determine A Long / Short Position, Defval = 1
Entry (float) : Is The Entry Level Of The Order, Defval = na
StopLossDistance (float)
RiskReward (float)
Returns: Float - The TakeProfit Level In Actual Price
CalculateTakeProfitDistance(OrderType, Entry, TakeProfit)
Get TakeProfit Distance In Pips
Parameters:
OrderType (int) : Is To Determine A Long / Short Position, Defval = 1
Entry (float) : Is The Entry Level Of The Order, NEED TO INPUT PARAM
TakeProfit (float) : Level Based On Previous Calculation, NEED TO INPUT PARAM
Returns: Float - The TakeProfit Value In Pips
CalculateConversionCurrency(AccountCurrency, SymbolCurrency, BaseCurrency)
Get The Conversion Currecny Between Current Account Currency & Current Pair's Quoted Currency (FOR FOREX ONLY)
Parameters:
AccountCurrency (simple string) : Is For The Account Currency Used
SymbolCurrency (simple string) : Is For The Current Symbol Currency (Front Symbol)
BaseCurrency (simple string) : Is For The Current Symbol Base Currency (Back Symbol)
Returns: Tuple Of A Bollean (Convert The Currency ?) And A String (Converted Currency)
CalculateConversionRate(ConvertCurrency, ConversionRate)
Get The Conversion Rate Between Current Account Currency & Current Pair's Quoted Currency (FOR FOREX ONLY)
Parameters:
ConvertCurrency (bool) : Is To Check If The Current Symbol Needs To Be Converted Or Not
ConversionRate (float) : Is The Quoted Price Of The Conversion Currency (Input The request.security Function Here)
Returns: Float Price Of Conversion Rate (If In The Same Currency Than Return Value Will Be 1.0)
LotSize(LotSizeSimple, Balance, Risk, SLDistance, ConversionRate)
Get Current Lot Size
Parameters:
LotSizeSimple (bool) : Is To Toggle Lot Sizing Calculation (Simple Is Good Enough For Stocks & Crypto, Whilst Complex Is For Forex)
Balance (float) : Is For The Current Account Balance To Calculate The Lot Sizing Based Off
Risk (float) : Is For The Current Risk Per Trade To Calculate The Lot Sizing Based Off
SLDistance (float) : Is The Current Position StopLoss Distance From Its Entry Price
ConversionRate (float) : Is The Currency Conversion Rate (Used For Complex Lot Sizing Only)
Returns: Float - Position Size In Units
ToLots(Units)
Converts Units To Lots
Parameters:
Units (float) : Is For How Many Units Need To Be Converted Into Lots (Minimun 1000 Units)
Returns: Float - Position Size In Lots
ToUnits(Lots)
Converts Lots To Units
Parameters:
Lots (float) : Is For How Many Lots Need To Be Converted Into Units (Minimun 0.01 Units)
Returns: Int - Position Size In Units
ToLotsInUnits(Units)
Converts Units To Lots Than Back To Units
Parameters:
Units (float) : Is For How Many Units Need To Be Converted Into Lots (Minimun 1000 Units)
Returns: Float - Position Size In Lots That Were Rounded To Units
ATRTrail(OrderType, SourceType, ATRPeriod, ATRMultiplyer, SwingLookback)
Calculate ATR Trailing Stop
Parameters:
OrderType (int) : Is To Determine A Long / Short Position, Defval = 1
SourceType (int) : Is To Determine Where To Calculate The ATR Trailing From, Defval = close
ATRPeriod (simple int) : Is To Change Its ATR Period, Defval = 20
ATRMultiplyer (float) : Is To Change Its ATR Trailing Distance, Defval = 1
SwingLookback (int) : Is To Change Its Swing HiLo Lookback (Only From Source Type 5), Defval = 7
Returns: Float - Number Of The Current ATR Trailing
DangerZone(WinRate, AvgRRR, Filter)
Calculate Danger Zone Of A Given Strategy
Parameters:
WinRate (float) : Is The Strategy WinRate
AvgRRR (float) : Is The Strategy Avg RRR
Filter (float) : Is The Minimum Profit It Needs To Be Out Of BE Zone, Defval = 3
Returns: Int - Value, 1 If Out Of Danger Zone, 0 If BE, -1 If In Danger Zone
IsQuestionableTrades(TradeTP, TradeSL)
Checks For Questionable Trades (Which Are Trades That Its TP & SL Level Got Hit At The Same Candle)
Parameters:
TradeTP (float) : Is The Trade In Question Take Profit Level
TradeSL (float) : Is The Trade In Question Stop Loss Level
Returns: Bool - True If The Last Trade Was A "Questionable Trade"
//====================================================================================================================================================
// Custom Strategy Functions
//====================================================================================================================================================
OpenLong(EntryID, LotSize, LimitPrice, StopPrice, Comment, CommentValue)
Open A Long Order Based On The Given Params
Parameters:
EntryID (string) : Is The Trade Entry ID, Defval = "Long"
LotSize (float) : Is The Lot Size Of The Trade, Defval = 1
LimitPrice (float) : Is The Limit Order Price To Set The Order At, Defval = Na / Market Order Execution
StopPrice (float) : Is The Stop Order Price To Set The Order At, Defval = Na / Market Order Execution
Comment (string) : Is The Order Comment, Defval = Long Entry Order
CommentValue (string) : Is For Custom Values In The Order Comment, Defval = Na
Returns: Void
OpenShort(EntryID, LotSize, LimitPrice, StopPrice, Comment, CommentValue)
Open A Short Order Based On The Given Params
Parameters:
EntryID (string) : Is The Trade Entry ID, Defval = "Short"
LotSize (float) : Is The Lot Size Of The Trade, Defval = 1
LimitPrice (float) : Is The Limit Order Price To Set The Order At, Defval = Na / Market Order Execution
StopPrice (float) : Is The Stop Order Price To Set The Order At, Defval = Na / Market Order Execution
Comment (string) : Is The Order Comment, Defval = Short Entry Order
CommentValue (string) : Is For Custom Values In The Order Comment, Defval = Na
Returns: Void
TP_SLExit(FromID, TPLevel, SLLevel, PercentageClose, Comment, CommentValue)
Exits Based On Predetermined TP & SL Levels
Parameters:
FromID (string) : Is The Trade ID That The TP & SL Levels Be Palced
TPLevel (float) : Is The Take Profit Level
SLLevel (float) : Is The StopLoss Level
PercentageClose (float) : Is The Amount To Close The Order At (In Percentage) Defval = 100
Comment (string) : Is The Order Comment, Defval = Exit Order
CommentValue (string) : Is For Custom Values In The Order Comment, Defval = Na
Returns: Void
CloseLong(ExitID, PercentageClose, Comment, CommentValue, Instant)
Exits A Long Order Based On A Specified Condition
Parameters:
ExitID (string) : Is The Trade ID That Will Be Closed, Defval = "Long"
PercentageClose (float) : Is The Amount To Close The Order At (In Percentage) Defval = 100
Comment (string) : Is The Order Comment, Defval = Exit Order
CommentValue (string) : Is For Custom Values In The Order Comment, Defval = Na
Instant (bool) : Is For Exit Execution Type, Defval = false
Returns: Void
CloseShort(ExitID, PercentageClose, Comment, CommentValue, Instant)
Exits A Short Order Based On A Specified Condition
Parameters:
ExitID (string) : Is The Trade ID That Will Be Closed, Defval = "Short"
PercentageClose (float) : Is The Amount To Close The Order At (In Percentage) Defval = 100
Comment (string) : Is The Order Comment, Defval = Exit Order
CommentValue (string) : Is For Custom Values In The Order Comment, Defval = Na
Instant (bool) : Is For Exit Execution Type, Defval = false
Returns: Void
BrokerCheck(Broker)
Checks Traded Broker With Current Loaded Chart Broker
Parameters:
Broker (string) : Is The Current Broker That Is Traded
Returns: Bool - True If Current Traded Broker Is Same As Loaded Chart Broker
OpenPC(LicenseID, OrderType, UseLimit, LimitPrice, SymbolPrefix, Symbol, SymbolSuffix, Risk, SL, TP, OrderComment, Spread)
Compiles Given Parameters Into An Alert String Format To Open Trades Using Pine Connector
Parameters:
LicenseID (string) : Is The Users PineConnector LicenseID
OrderType (int) : Is The Desired OrderType To Open
UseLimit (bool) : Is If We Want To Enter The Position At Exactly The Previous Closing Price
LimitPrice (float) : Is The Limit Price Of The Trade (Only For Pending Orders)
SymbolPrefix (string) : Is The Current Symbol Prefix (If Any)
Symbol (string) : Is The Traded Symbol
SymbolSuffix (string) : Is The Current Symbol Suffix (If Any)
Risk (float) : Is The Trade Risk Per Trade / Fixed Lot Sizing
SL (float) : Is The Trade SL In Price / In Pips
TP (float) : Is The Trade TP In Price / In Pips
OrderComment (string) : Is The Executed Trade Comment
Spread (float) : is The Maximum Spread For Execution
Returns: String - Pine Connector Order Syntax Alert Message
ClosePC(LicenseID, OrderType, SymbolPrefix, Symbol, SymbolSuffix)
Compiles Given Parameters Into An Alert String Format To Close Trades Using Pine Connector
Parameters:
LicenseID (string) : Is The Users PineConnector LicenseID
OrderType (int) : Is The Desired OrderType To Close
SymbolPrefix (string) : Is The Current Symbol Prefix (If Any)
Symbol (string) : Is The Traded Symbol
SymbolSuffix (string) : Is The Current Symbol Suffix (If Any)
Returns: String - Pine Connector Order Syntax Alert Message
//====================================================================================================================================================
// Custom Backtesting Calculation Functions
//====================================================================================================================================================
CalculatePNL(EntryPrice, ExitPrice, LotSize, ConversionRate)
Calculates Trade PNL Based On Entry, Eixt & Lot Size
Parameters:
EntryPrice (float) : Is The Trade Entry
ExitPrice (float) : Is The Trade Exit
LotSize (float) : Is The Trade Sizing
ConversionRate (float) : Is The Currency Conversion Rate (Used For Complex Lot Sizing Only)
Returns: Float - The Current Trade PNL
UpdateBalance(PrevBalance, PNL)
Updates The Previous Ginve Balance To The Next PNL
Parameters:
PrevBalance (float) : Is The Previous Balance To Be Updated
PNL (float) : Is The Current Trade PNL To Be Added
Returns: Float - The Current Updated PNL
CalculateSlpComm(PNL, MaxRate)
Calculates Random Slippage & Commisions Fees Based On The Parameters
Parameters:
PNL (float) : Is The Current Trade PNL
MaxRate (float) : Is The Upper Limit (In Percentage) Of The Randomized Fee
Returns: Float - A Percentage Fee Of The Current Trade PNL
UpdateDD(MaxBalance, Balance)
Calculates & Updates The DD Based On Its Given Parameters
Parameters:
MaxBalance (float) : Is The Maximum Balance Ever Recorded
Balance (float) : Is The Current Account Balance
Returns: Float - The Current Strategy DD
CalculateWR(TotalTrades, LongID, ShortID)
Calculate The Total, Long & Short Trades Win Rate
Parameters:
TotalTrades (int) : Are The Current Total Trades That The Strategy Has Taken
LongID (string) : Is The Order ID Of The Long Trades Of The Strategy
ShortID (string) : Is The Order ID Of The Short Trades Of The Strategy
Returns: Tuple Of Long WR%, Short WR%, Total WR%, Total Winning Trades, Total Losing Trades, Total Long Trades & Total Short Trades
CalculateAvgRRR(WinTrades, LossTrades)
Calculates The Overall Strategy Avg Risk Reward Ratio
Parameters:
WinTrades (int) : Are The Strategy Winning Trades
LossTrades (int) : Are The Strategy Losing Trades
Returns: Float - The Average RRR Values
CAGR(StartTime, StartPrice, EndTime, EndPrice)
Calculates The CAGR Over The Given Time Period © TradingView
Parameters:
StartTime (int) : Is The Starting Time Of The Calculation
StartPrice (float) : Is The Starting Price Of The Calculation
EndTime (int) : Is The Ending Time Of The Calculation
EndPrice (float) : Is The Ending Price Of The Calculation
Returns: Float - The CAGR Values
//====================================================================================================================================================
// Custom Plot Functions
//====================================================================================================================================================
EditLabels(LabelID, X1, Y1, Text, Color, TextColor, EditCondition, DeleteCondition)
Edit / Delete Labels
Parameters:
LabelID (label) : Is The ID Of The Selected Label
X1 (int) : Is The X1 Coordinate IN BARINDEX Xloc
Y1 (float) : Is The Y1 Coordinate IN PRICE Yloc
Text (string) : Is The Text Than Wants To Be Written In The Label
Color (color) : Is The Color Value Change Of The Label Text
TextColor (color)
EditCondition (int) : Is The Edit Condition of The Line (Setting Location / Color)
DeleteCondition (bool) : Is The Delete Condition Of The Line If Ture Deletes The Prev Itteration Of The Line
Returns: Void
EditLine(LineID, X1, Y1, X2, Y2, Color, EditCondition, DeleteCondition)
Edit / Delete Lines
Parameters:
LineID (line) : Is The ID Of The Selected Line
X1 (int) : Is The X1 Coordinate IN BARINDEX Xloc
Y1 (float) : Is The Y1 Coordinate IN PRICE Yloc
X2 (int) : Is The X2 Coordinate IN BARINDEX Xloc
Y2 (float) : Is The Y2 Coordinate IN PRICE Yloc
Color (color) : Is The Color Value Change Of The Line
EditCondition (int) : Is The Edit Condition of The Line (Setting Location / Color)
DeleteCondition (bool) : Is The Delete Condition Of The Line If Ture Deletes The Prev Itteration Of The Line
Returns: Void
//====================================================================================================================================================
// Custom Display Functions (Using Tables)
//====================================================================================================================================================
FillTable(TableID, Column, Row, Title, Value, BgColor, TextColor, ToolTip)
Filling The Selected Table With The Inputed Information
Parameters:
TableID (table) : Is The Table ID That Wants To Be Edited
Column (int) : Is The Current Column Of The Table That Wants To Be Edited
Row (int) : Is The Current Row Of The Table That Wants To Be Edited
Title (string) : Is The String Title Of The Current Cell Table
Value (string) : Is The String Value Of The Current Cell Table
BgColor (color) : Is The Selected Color For The Current Table
TextColor (color) : Is The Selected Color For The Current Table
ToolTip (string) : Is The ToolTip Of The Current Cell In The Table
Returns: Void
DisplayBTResults(TableID, BgColor, TextColor, StartingBalance, Balance, DollarReturn, TotalPips, MaxDD)
Filling The Selected Table With The Inputed Information
Parameters:
TableID (table) : Is The Table ID That Wants To Be Edited
BgColor (color) : Is The Selected Color For The Current Table
TextColor (color) : Is The Selected Color For The Current Table
StartingBalance (float) : Is The Account Starting Balance
Balance (float)
DollarReturn (float) : Is The Account Dollar Reture
TotalPips (float) : Is The Total Pips Gained / loss
MaxDD (float) : Is The Maximum Drawdown Over The Backtesting Period
Returns: Void
DisplayBTResultsV2(TableID, BgColor, TextColor, TotalWR, QTCount, LongWR, ShortWR, InitialCapital, CumProfit, CumFee, AvgRRR, MaxDD, CAGR, MeanDD)
Filling The Selected Table With The Inputed Information
Parameters:
TableID (table) : Is The Table ID That Wants To Be Edited
BgColor (color) : Is The Selected Color For The Current Table
TextColor (color) : Is The Selected Color For The Current Table
TotalWR (float) : Is The Strategy Total WR In %
QTCount (int) : Is The Strategy Questionable Trades Count
LongWR (float) : Is The Strategy Total WR In %
ShortWR (float) : Is The Strategy Total WR In %
InitialCapital (float) : Is The Strategy Initial Starting Capital
CumProfit (float) : Is The Strategy Ending Cumulative Profit
CumFee (float) : Is The Strategy Ending Cumulative Fee (Based On Randomized Fee Assumptions)
AvgRRR (float) : Is The Strategy Average Risk Reward Ratio
MaxDD (float) : Is The Strategy Maximum DrawDown In Its Backtesting Period
CAGR (float) : Is The Strategy Compounded Average GRowth In %
MeanDD (float) : Is The Strategy Mean / Average Drawdown In The Backtesting Period
Returns: Void
//====================================================================================================================================================
// Custom Pattern Detection Functions
//====================================================================================================================================================
BullFib(priceLow, priceHigh, fibRatio)
Calculates A Bullish Fibonacci Value (From Swing Low To High) © ZenAndTheArtOfTrading
Parameters:
priceLow (float)
priceHigh (float)
fibRatio (float)
Returns: The Fibonacci Value Of The Given Ratio Between The Two Price Points
BearFib(priceLow, priceHigh, fibRatio)
Calculates A Bearish Fibonacci Value (From Swing High To Low) © ZenAndTheArtOfTrading
Parameters:
priceLow (float)
priceHigh (float)
fibRatio (float)
Returns: The Fibonacci Value Of The Given Ratio Between The Two Price Points
GetBodySize()
Gets The Current Candle Body Size IN POINTS © ZenAndTheArtOfTrading
Returns: The Current Candle Body Size IN POINTS
GetTopWickSize()
Gets The Current Candle Top Wick Size IN POINTS © ZenAndTheArtOfTrading
Returns: The Current Candle Top Wick Size IN POINTS
GetBottomWickSize()
Gets The Current Candle Bottom Wick Size IN POINTS © ZenAndTheArtOfTrading
Returns: The Current Candle Bottom Wick Size IN POINTS
GetBodyPercent()
Gets The Current Candle Body Size As A Percentage Of Its Entire Size Including Its Wicks © ZenAndTheArtOfTrading
Returns: The Current Candle Body Size IN PERCENTAGE
GetTopWickPercent()
Gets The Current Top Wick Size As A Percentage Of Its Entire Body Size
Returns: Float - The Current Candle Top Wick Size IN PERCENTAGE
GetBottomWickPercent()
Gets The Current Bottom Wick Size As A Percentage Of Its Entire Bodu Size
Returns: Float - The Current Candle Bottom Size IN PERCENTAGE
BullishEC(Allowance, RejectionWickSize, EngulfWick, NearSwings, SwingLookBack)
Checks If The Current Bar Is A Bullish Engulfing Candle
Parameters:
Allowance (int) : To Give Flexibility Of Engulfing Pattern Detection In Markets That Have Micro Gaps, Defval = 0
RejectionWickSize (float) : To Filter Out long (Upper And Lower) Wick From The Bullsih Engulfing Pattern, Defval = na
EngulfWick (bool) : To Specify If We Want The Pattern To Also Engulf Its Upper & Lower Previous Wicks, Defval = false
NearSwings (bool) : To Specify If We Want The Pattern To Be Near A Recent Swing Low, Defval = true
SwingLookBack (int) : To Specify How Many Bars Back To Detect A Recent Swing Low, Defval = 10
Returns: Bool - True If The Current Bar Matches The Requirements of a Bullish Engulfing Candle
BearishEC(Allowance, RejectionWickSize, EngulfWick, NearSwings, SwingLookBack)
Checks If The Current Bar Is A Bearish Engulfing Candle
Parameters:
Allowance (int) : To Give Flexibility Of Engulfing Pattern Detection In Markets That Have Micro Gaps, Defval = 0
RejectionWickSize (float) : To Filter Out long (Upper And Lower) Wick From The Bearish Engulfing Pattern, Defval = na
EngulfWick (bool) : To Specify If We Want The Pattern To Also Engulf Its Upper & Lower Previous Wicks, Defval = false
NearSwings (bool) : To Specify If We Want The Pattern To Be Near A Recent Swing High, Defval = true
SwingLookBack (int) : To Specify How Many Bars Back To Detect A Recent Swing High, Defval = 10
Returns: Bool - True If The Current Bar Matches The Requirements of a Bearish Engulfing Candle
Hammer(Fib, ColorMatch, NearSwings, SwingLookBack, ATRFilterCheck, ATRPeriod)
Checks If The Current Bar Is A Hammer Candle
Parameters:
Fib (float) : To Specify Which Fibonacci Ratio To Use When Determining The Hammer Candle, Defval = 0.382 Ratio
ColorMatch (bool) : To Filter Only Bullish Closed Hammer Candle Pattern, Defval = false
NearSwings (bool) : To Specify If We Want The Doji To Be Near A Recent Swing Low, Defval = true
SwingLookBack (int) : To Specify How Many Bars Back To Detect A Recent Swing Low, Defval = 10
ATRFilterCheck (float) : To Filter Smaller Hammer Candles That Might Be Better Classified As A Doji Candle, Defval = 1
ATRPeriod (simple int) : To Change ATR Period Of The ATR Filter, Defval = 20
Returns: Bool - True If The Current Bar Matches The Requirements of a Hammer Candle
Star(Fib, ColorMatch, NearSwings, SwingLookBack, ATRFilterCheck, ATRPeriod)
Checks If The Current Bar Is A Hammer Candle
Parameters:
Fib (float) : To Specify Which Fibonacci Ratio To Use When Determining The Hammer Candle, Defval = 0.382 Ratio
ColorMatch (bool) : To Filter Only Bullish Closed Hammer Candle Pattern, Defval = false
NearSwings (bool) : To Specify If We Want The Doji To Be Near A Recent Swing Low, Defval = true
SwingLookBack (int) : To Specify How Many Bars Back To Detect A Recent Swing Low, Defval = 10
ATRFilterCheck (float) : To Filter Smaller Hammer Candles That Might Be Better Classified As A Doji Candle, Defval = 1
ATRPeriod (simple int) : To Change ATR Period Of The ATR Filter, Defval = 20
Returns: Bool - True If The Current Bar Matches The Requirements of a Hammer Candle
Doji(MaxWickSize, MaxBodySize, DojiType, NearSwings, SwingLookBack)
Checks If The Current Bar Is A Doji Candle
Parameters:
MaxWickSize (float) : To Specify The Maximum Lenght Of Its Upper & Lower Wick, Defval = 2
MaxBodySize (float) : To Specify The Maximum Lenght Of Its Candle Body IN PERCENT, Defval = 0.05
DojiType (int)
NearSwings (bool) : To Specify If We Want The Doji To Be Near A Recent Swing High / Low (Only In Dragonlyf / Gravestone Mode), Defval = true
SwingLookBack (int) : To Specify How Many Bars Back To Detect A Recent Swing High / Low (Only In Dragonlyf / Gravestone Mode), Defval = 10
Returns: Bool - True If The Current Bar Matches The Requirements of a Doji Candle
BullishIB(Allowance, RejectionWickSize, EngulfWick, NearSwings, SwingLookBack)
Checks If The Current Bar Is A Bullish Harami Candle
Parameters:
Allowance (int) : To Give Flexibility Of Harami Pattern Detection In Markets That Have Micro Gaps, Defval = 0
RejectionWickSize (float) : To Filter Out long (Upper And Lower) Wick From The Bullsih Harami Pattern, Defval = na
EngulfWick (bool) : To Specify If We Want The Pattern To Also Engulf Its Upper & Lower Previous Wicks, Defval = false
NearSwings (bool) : To Specify If We Want The Pattern To Be Near A Recent Swing Low, Defval = true
SwingLookBack (int) : To Specify How Many Bars Back To Detect A Recent Swing Low, Defval = 10
Returns: Bool - True If The Current Bar Matches The Requirements of a Bullish Harami Candle
BearishIB(Allowance, RejectionWickSize, EngulfWick, NearSwings, SwingLookBack)
Checks If The Current Bar Is A Bullish Harami Candle
Parameters:
Allowance (int) : To Give Flexibility Of Harami Pattern Detection In Markets That Have Micro Gaps, Defval = 0
RejectionWickSize (float) : To Filter Out long (Upper And Lower) Wick From The Bearish Harami Pattern, Defval = na
EngulfWick (bool) : To Specify If We Want The Pattern To Also Engulf Its Upper & Lower Previous Wicks, Defval = false
NearSwings (bool) : To Specify If We Want The Pattern To Be Near A Recent Swing High, Defval = true
SwingLookBack (int) : To Specify How Many Bars Back To Detect A Recent Swing High, Defval = 10
Returns: Bool - True If The Current Bar Matches The Requirements of a Bearish Harami Candle
//====================================================================================================================================================
// Custom Time Functions
//====================================================================================================================================================
BarInSession(sess, useFilter)
Determines if the current price bar falls inside the specified session © ZenAndTheArtOfTrading
Parameters:
sess (simple string)
useFilter (bool)
Returns: A boolean - true if the current bar falls within the given time session
BarOutSession(sess, useFilter)
Determines if the current price bar falls outside the specified session © ZenAndTheArtOfTrading
Parameters:
sess (simple string)
useFilter (bool)
Returns: A boolean - true if the current bar falls outside the given time session
DateFilter(startTime, endTime)
Determines if this bar's time falls within date filter range © ZenAndTheArtOfTrading
Parameters:
startTime (int)
endTime (int)
Returns: A boolean - true if the current bar falls within the given dates
DayFilter(monday, tuesday, wednesday, thursday, friday, saturday, sunday)
Checks if the current bar's day is in the list of given days to analyze © ZenAndTheArtOfTrading
Parameters:
monday (bool)
tuesday (bool)
wednesday (bool)
thursday (bool)
friday (bool)
saturday (bool)
sunday (bool)
Returns: A boolean - true if the current bar's day is one of the given days
AUSSess()
Checks If The Current Australian Forex Session In Running
Returns: Bool - True If Currently The Australian Session Is Running
ASIASess()
Checks If The Current Asian Forex Session In Running
Returns: Bool - True If Currently The Asian Session Is Running
EURSess()
Checks If The Current European Forex Session In Running
Returns: Bool - True If Currently The European Session Is Running
USSess()
Checks If The Current US Forex Session In Running
Returns: Bool - True If Currently The US Session Is Running
UNIXToDate(Time, ConversionType, TimeZone)
Converts UNIX Time To Datetime
Parameters:
Time (int) : Is The UNIX Time Input
ConversionType (int) : Is The Datetime Output Format, Defval = DD-MM-YYYY
TimeZone (string) : Is To Convert The Outputed Datetime Into The Specified Time Zone, Defval = Exchange Time Zone
Returns: String - String Of Datetime

LYGLibraryLibrary "LYGLibrary"
A collection of custom tools & utility functions commonly used with my scripts
getDecimals()
Calculates how many decimals are on the quote price of the current market
Returns: The current decimal places on the market quote price
truncate(number, decimalPlaces)
Truncates (cuts) excess decimal places
Parameters:
number (float)
decimalPlaces (simple float)
Returns: The given number truncated to the given decimalPlaces
toWhole(number)
Converts pips into whole numbers
Parameters:
number (float)
Returns: The converted number
toPips(number)
Converts whole numbers back into pips
Parameters:
number (float)
Returns: The converted number
getPctChange(value1, value2, lookback)
Gets the percentage change between 2 float values over a given lookback period
Parameters:
value1 (float)
value2 (float)
lookback (int)
av_getPositionSize(balance, risk, stopPoints, conversionRate)
Calculates OANDA forex position size for AutoView based on the given parameters
Parameters:
balance (float)
risk (float)
stopPoints (float)
conversionRate (float)
Returns: The calculated position size (in units - only compatible with OANDA)
bullFib(priceLow, priceHigh, fibRatio)
Calculates a bullish fibonacci value
Parameters:
priceLow (float) : The lowest price point
priceHigh (float) : The highest price point
fibRatio (float) : The fibonacci % ratio to calculate
Returns: The fibonacci value of the given ratio between the two price points
bearFib(priceLow, priceHigh, fibRatio)
Calculates a bearish fibonacci value
Parameters:
priceLow (float) : The lowest price point
priceHigh (float) : The highest price point
fibRatio (float) : The fibonacci % ratio to calculate
Returns: The fibonacci value of the given ratio between the two price points
getMA(length, maType)
Gets a Moving Average based on type (MUST BE CALLED ON EVERY CALCULATION)
Parameters:
length (simple int)
maType (string)
Returns: A moving average with the given parameters
getEAP(atr)
Performs EAP stop loss size calculation (eg. ATR >= 20.0 and ATR < 30, returns 20)
Parameters:
atr (float)
Returns: The EAP SL converted ATR size
getEAP2(atr)
Performs secondary EAP stop loss size calculation (eg. ATR < 40, add 5 pips, ATR between 40-50, add 10 pips etc)
Parameters:
atr (float)
Returns: The EAP SL converted ATR size
barsAboveMA(lookback, ma)
Counts how many candles are above the MA
Parameters:
lookback (int)
ma (float)
Returns: The bar count of how many recent bars are above the MA
barsBelowMA(lookback, ma)
Counts how many candles are below the MA
Parameters:
lookback (int)
ma (float)
Returns: The bar count of how many recent bars are below the EMA
barsCrossedMA(lookback, ma)
Counts how many times the EMA was crossed recently
Parameters:
lookback (int)
ma (float)
Returns: The bar count of how many times price recently crossed the EMA
getPullbackBarCount(lookback, direction)
Counts how many green & red bars have printed recently (ie. pullback count)
Parameters:
lookback (int)
direction (int)
Returns: The bar count of how many candles have retraced over the given lookback & direction
getBodySize()
Gets the current candle's body size (in POINTS, divide by 10 to get pips)
Returns: The current candle's body size in POINTS
getTopWickSize()
Gets the current candle's top wick size (in POINTS, divide by 10 to get pips)
Returns: The current candle's top wick size in POINTS
getBottomWickSize()
Gets the current candle's bottom wick size (in POINTS, divide by 10 to get pips)
Returns: The current candle's bottom wick size in POINTS
getBodyPercent()
Gets the current candle's body size as a percentage of its entire size including its wicks
Returns: The current candle's body size percentage
isHammer(fib, colorMatch)
Checks if the current bar is a hammer candle based on the given parameters
Parameters:
fib (float)
colorMatch (bool)
Returns: A boolean - true if the current bar matches the requirements of a hammer candle
isStar(fib, colorMatch)
Checks if the current bar is a shooting star candle based on the given parameters
Parameters:
fib (float)
colorMatch (bool)
Returns: A boolean - true if the current bar matches the requirements of a shooting star candle
isDoji(wickSize, bodySize)
Checks if the current bar is a doji candle based on the given parameters
Parameters:
wickSize (float)
bodySize (float)
Returns: A boolean - true if the current bar matches the requirements of a doji candle
isBullishEC(allowance, rejectionWickSize, engulfWick)
Checks if the current bar is a bullish engulfing candle
Parameters:
allowance (float)
rejectionWickSize (float)
engulfWick (bool)
Returns: A boolean - true if the current bar matches the requirements of a bullish engulfing candle
isBearishEC(allowance, rejectionWickSize, engulfWick)
Checks if the current bar is a bearish engulfing candle
Parameters:
allowance (float)
rejectionWickSize (float)
engulfWick (bool)
Returns: A boolean - true if the current bar matches the requirements of a bearish engulfing candle
isInsideBar()
Detects inside bars
Returns: Returns true if the current bar is an inside bar
isOutsideBar()
Detects outside bars
Returns: Returns true if the current bar is an outside bar
barInSession(sess, useFilter)
Determines if the current price bar falls inside the specified session
Parameters:
sess (simple string)
useFilter (bool)
Returns: A boolean - true if the current bar falls within the given time session
barOutSession(sess, useFilter)
Determines if the current price bar falls outside the specified session
Parameters:
sess (simple string)
useFilter (bool)
Returns: A boolean - true if the current bar falls outside the given time session
dateFilter(startTime, endTime)
Determines if this bar's time falls within date filter range
Parameters:
startTime (int)
endTime (int)
Returns: A boolean - true if the current bar falls within the given dates
dayFilter(monday, tuesday, wednesday, thursday, friday, saturday, sunday)
Checks if the current bar's day is in the list of given days to analyze
Parameters:
monday (bool)
tuesday (bool)
wednesday (bool)
thursday (bool)
friday (bool)
saturday (bool)
sunday (bool)
Returns: A boolean - true if the current bar's day is one of the given days
atrFilter(atrValue, maxSize)
Parameters:
atrValue (float)
maxSize (float)
fillCell(tableID, column, row, title, value, bgcolor, txtcolor)
This updates the given table's cell with the given values
Parameters:
tableID (table)
column (int)
row (int)
title (string)
value (string)
bgcolor (color)
txtcolor (color)
Returns: A boolean - true if the current bar falls within the given dates

RSI Overbought/Oversold + Divergence IndicatorDESCRIPTION:
This script combines the Relative Strength Index ( RSI ), Moving Average and Divergence indicator to make a better decision when to enter or exit a trade.
- The Moving Average line (MA) has been made hidden by default but enhanced with an RSIMA cloud.
- When the RSI is above the selected MA it turns into green and when the RSI is below the select MA it turns into red.
- When the RSI is moving into the Overbought or Oversold area, some highlighted areas will appear.
- When some divergences or hidden divergences are detected an extra indication will be highlighted.
- When the divergence appear in the Overbought or Oversold area the more weight it give to make a decision.
- The same color pallet has been used as the default candlestick colors so it looks familiar.
HOW TO USE:
The prerequisite is that we have some knowledge about the Elliot Wave Theory, the Fibonacci Retracement and the Fibonacci Extension tools.
Wave 1
(1) When we receive some buy signals we wait until we receive some extra indications.
(2) On the RSI Overbought/Oversold + Divergence Indicator we can see a Bullish Divergence and our RSI is changing from red to green ( RSI is higher then the MA).
(3) If we are getting here into the trade then we need to use a stop loss. We put our stop loss 1 a 2 pips just below the lowest wick. We also invest maximum 50% of the total amount we want to invest.
Wave 2
(4) Now we wait until we see a clear reversal and here we starting to use the Fibonacci Retracement tool. We draw a line from the lowest point of wave(1) till the highest point of wave (1). When we are retraced till the 0.618 fib also called the golden ratio we check again the RSI Overbought/Oversold + Divergence Indicator. When we see a reversal we do our second buy. We set again a stop loss just below the lowest wick (this is the yellow line on the chart). We also move the stop loss we have set in step (3) to this level.
Wave 3
(5) To identify how far the uptrend can go we need to use the Fibonacci Extension tool. We draw a line from the lowest point of wave(1) till the highest point of wave (1) and draw it back to the lowest point of wave (2). Wave (3) is most of the time the longest wave and can go till it has reached the 1.618 or 2.618 fib. On the 1.618 we can take some profit. If we don't want to sell we move our stop loss to the 1 fib line (yellow line on the chart).
(6) We wait until we see a clear reversal on the Overbought/Oversold + Divergence Indicator and sell 33% to 50% of our investment.
Wave 4
(7) Now we wait again until we see a clear reversal and here we starting to use the Fibonacci Retracement tool. We draw a line from the lowest point of wave(2) till the highest point of wave (3). When we are retraced till the 0.618 fib also called the golden ratio we check again the RSI Overbought/Oversold + Divergence Indicator. When we see a reversal we buy again. We set again a stop loss just below the lowest wick (this is the yellow line on the chart).
(8) If we bought at the first reversal ours stop los was triggered (9) and we got out of the trade.
(9) If we did not bought at step (7) because our candle did not hit the 0.618 fib or we got stopped out of the trade we buy again at the reversal.
Wave 5
(10) To identify how far the uptrend can go we need to use the Fibonacci Extension tool. We draw a line from the lowest point of wave(2) till the highest point of wave (3) and draw it back to the lowest point of wave (4). Most of the time wave 5 goes up till it has reached the 1 fib. And that is the point where we got out of the trade with all of our investment. In this trade we got out of the trade a bit earlier. We received the sell signals and got a reversal on the Overbought/Oversold + Divergence Indicator.
We are hoping you learned something so you can make better decisions when to get into or out of a trade.
If you have any question just drop it into the comments below.
FEATURES:
• You can show/hide the RSI .
• You can show/hide the MA.
• You can show/hide the lRSIMA cloud.
• You can show/hide the Stoch RSI cloud.
• You can show/hide and adjust the Overbought and Oversold zones.
• You can show/hide and adjust the Overbought Extended and Oversold Extended zones.
• You can show/hide the Overbought and Oversold highlighted zones.
• Etc...
HOW TO GET ACCESS TO THE SCRIPT:
• Favorite the script and add it to your chart.
REMARKS:
• This advice is NOT financial advice.
• We do not provide personal investment advice and we are not a qualified licensed investment advisor.
• All information found here, including any ideas, opinions, views, predictions, forecasts, commentaries, suggestions, or stock picks, expressed or implied herein, are for informational, entertainment or educational purposes only and should not be construed as personal investment advice.
• We will not and cannot be held liable for any actions you take as a result of anything you read here.
• We only provide this information to help you make a better decision.
• While the information provided is believed to be accurate, it may include errors or inaccuracies.
Good Luck and have fun,
The CryptoSignalScanner Team

Attrition Scalper v2.0Green/Red Arrowed Buy/Sell signals are just simple buy sell signals based on SuperTrend, VWAP, Bollinger, Linear Regression
Purple Arrowed Buy/Sell Signals happen when the price/candle cross over or under the yellow outer lines (4.236 fib lines) It's extremely rare and hard for price to stay above these lines therefore we can usually and comfortably buy/sell it, a key information here though when price pumps or dumps super fast and hard to the point of crossing these borders, the trend might also be extremely strong and continous so even if the price temporarily goes back inside the borders as the lines expand over time price can continue riding or crossing these lines back again and continue the uptrend/downtrend, therefore crossing these outer borders doesn't necessarilly and always mean a reversal is due.
When analyzing the instrument you're trading the important factors for support/resistance areas are usually the outer lines like i said previously it's super hard for price to be outside these and will almost always get back inside quickly. The Middle thicker green/red line which is Variable Index Dynamic Average should also be a nice pivot line for major support and resistance . All the other lines are also important dynamic support/resistance lines.
Their Importance Order
1- Outer Yellow Line (4.236 Fibs)
2- Thicker Middle Green/Red Line (VIDYA)
3- Thinner Upper/Lower Green/Red Line (VIDYA +3, VIDYA -3)
4- The Rest Of The Lines (Fib Lines)
You can use this indicator in any market condition in any market to determine key support/resistance levels, use it for mean reversion through price expanding to outside of the most outer line therefore being overbought/oversold basically using the purple buy/sell signals or only follow the normal buy/sell signals or use it in confluence with each other. You can also use this indicator in confluence with your own manual technical analysis or other indicators/strategies you are already using and are comfortable with.
A good part is the support/resistance lines from timeframe to timeframe pictures the whole situation quite well, you can use lower timeframe to find your entry/exit positions and higher timeframe to find your key support/resistance points, they all should be somewhat in confluence from timeframe to timeframe anyways. My recommendation would be to look at 1HR, 4HR and 1D charts for swing trading and 5-15 Min for quick scalping/day trading
You should still probably at least take a look to higher timeframes so that you don't get burned when you realize there is a huge resistance line at price XXXXX on the 4 hour chart but you're expecting it to go above it on the 5 minute chart, it can go above it temporarily but we analyze everything on a closing basis so it most likely won't close above it. Again don't take a position or FOMO when price breaks a support/resistance line, we're looking for a CLOSE above/below them and a retest to see if S/R flip happened would even be better.
Sometimes the most outer line won't be the 4.236 (Yellow) lines as when it gets quite volatile the Thinner Upper/Lower Green/Red Lines (VIDYA +3, VIDYA-3) might cross them to be the most outer line, in this case i have observed that the trend is extremely strong this time price almost always doesn't go above or below the VIDYA line but can stay outside of the Yellow 4.236 Fib line for an extended amount of time (price will still get back inside the channel relatively quickly, just not as fast as the normal condition)
With Proper Risk Management and Discipline this indicator can be of great use to you as it's surprisingly successful especially at mean reversion and pointing out the support/resistance lines, they are so much more successful than your average MA/EMA lines.

Library CommonLibrary "LibraryCommon"
A collection of custom tools & utility functions commonly used with my scripts
@description TODO: add library description here
getDecimals() Calculates how many decimals are on the quote price of the current market
Returns: The current decimal places on the market quote price
truncate(float, float) Truncates (cuts) excess decimal places
Parameters:
float : number The number to truncate
float : decimalPlaces (default=2) The number of decimal places to truncate to
Returns: The given number truncated to the given decimalPlaces
toWhole(float) Converts pips into whole numbers
Parameters:
float : number The pip number to convert into a whole number
Returns: The converted number
toPips(float) Converts whole numbers back into pips
Parameters:
float : number The whole number to convert into pips
Returns: The converted number
getPctChange(float, float, int) Gets the percentage change between 2 float values over a given lookback period
Parameters:
float : value1 The first value to reference
float : value2 The second value to reference
int : lookback The lookback period to analyze
av_getPositionSize(float, float, float, float) Calculates OANDA forex position size for AutoView based on the given parameters
Parameters:
float : balance The account balance to use
float : risk The risk percentage amount (as a whole number - eg. 1 = 1% risk)
float : stopPoints The stop loss distance in POINTS (not pips)
float : conversionRate The conversion rate of our account balance currency
Returns: The calculated position size (in units - only compatible with OANDA)
bullFib(priceLow, priceHigh, fibRatio) Calculates a bullish fibonacci value
Parameters:
priceLow : The lowest price point
priceHigh : The highest price point
fibRatio : The fibonacci % ratio to calculate
Returns: The fibonacci value of the given ratio between the two price points
bearFib(priceLow, priceHigh, fibRatio) Calculates a bearish fibonacci value
Parameters:
priceLow : The lowest price point
priceHigh : The highest price point
fibRatio : The fibonacci % ratio to calculate
Returns: The fibonacci value of the given ratio between the two price points
getMA(int, string) Gets a Moving Average based on type (MUST BE CALLED ON EVERY CALCULATION)
Parameters:
int : length The MA period
string : maType The type of MA
Returns: A moving average with the given parameters
getEAP(float) Performs EAP stop loss size calculation (eg. ATR >= 20.0 and ATR < 30, returns 20)
Parameters:
float : atr The given ATR to base the EAP SL calculation on
Returns: The EAP SL converted ATR size
getEAP2(float) Performs secondary EAP stop loss size calculation (eg. ATR < 40, add 5 pips, ATR between 40-50, add 10 pips etc)
Parameters:
float : atr The given ATR to base the EAP SL calculation on
Returns: The EAP SL converted ATR size
barsAboveMA(int, float) Counts how many candles are above the MA
Parameters:
int : lookback The lookback period to look back over
float : ma The moving average to check
Returns: The bar count of how many recent bars are above the MA
barsBelowMA(int, float) Counts how many candles are below the MA
Parameters:
int : lookback The lookback period to look back over
float : ma The moving average to reference
Returns: The bar count of how many recent bars are below the EMA
barsCrossedMA(int, float) Counts how many times the EMA was crossed recently
Parameters:
int : lookback The lookback period to look back over
float : ma The moving average to reference
Returns: The bar count of how many times price recently crossed the EMA
getPullbackBarCount(int, int) Counts how many green & red bars have printed recently (ie. pullback count)
Parameters:
int : lookback The lookback period to look back over
int : direction The color of the bar to count (1 = Green, -1 = Red)
Returns: The bar count of how many candles have retraced over the given lookback & direction
getBodySize() Gets the current candle's body size (in POINTS, divide by 10 to get pips)
Returns: The current candle's body size in POINTS
getTopWickSize() Gets the current candle's top wick size (in POINTS, divide by 10 to get pips)
Returns: The current candle's top wick size in POINTS
getBottomWickSize() Gets the current candle's bottom wick size (in POINTS, divide by 10 to get pips)
Returns: The current candle's bottom wick size in POINTS
getBodyPercent() Gets the current candle's body size as a percentage of its entire size including its wicks
Returns: The current candle's body size percentage
isHammer(float, bool) Checks if the current bar is a hammer candle based on the given parameters
Parameters:
float : fib (default=0.382) The fib to base candle body on
bool : colorMatch (default=false) Does the candle need to be green? (true/false)
Returns: A boolean - true if the current bar matches the requirements of a hammer candle
isStar(float, bool) Checks if the current bar is a shooting star candle based on the given parameters
Parameters:
float : fib (default=0.382) The fib to base candle body on
bool : colorMatch (default=false) Does the candle need to be red? (true/false)
Returns: A boolean - true if the current bar matches the requirements of a shooting star candle
isDoji(float, bool) Checks if the current bar is a doji candle based on the given parameters
Parameters:
float : wickSize (default=2) The maximum top wick size compared to the bottom (and vice versa)
bool : bodySize (default=0.05) The maximum body size as a percentage compared to the entire candle size
Returns: A boolean - true if the current bar matches the requirements of a doji candle
isBullishEC(float, float, bool) Checks if the current bar is a bullish engulfing candle
Parameters:
float : allowance (default=0) How many POINTS to allow the open to be off by (useful for markets with micro gaps)
float : rejectionWickSize (default=disabled) The maximum rejection wick size compared to the body as a percentage
bool : engulfWick (default=false) Does the engulfing candle require the wick to be engulfed as well?
Returns: A boolean - true if the current bar matches the requirements of a bullish engulfing candle
isBearishEC(float, float, bool) Checks if the current bar is a bearish engulfing candle
Parameters:
float : allowance (default=0) How many POINTS to allow the open to be off by (useful for markets with micro gaps)
float : rejectionWickSize (default=disabled) The maximum rejection wick size compared to the body as a percentage
bool : engulfWick (default=false) Does the engulfing candle require the wick to be engulfed as well?
Returns: A boolean - true if the current bar matches the requirements of a bearish engulfing candle
isInsideBar() Detects inside bars
Returns: Returns true if the current bar is an inside bar
isOutsideBar() Detects outside bars
Returns: Returns true if the current bar is an outside bar
barInSession(string, bool) Determines if the current price bar falls inside the specified session
Parameters:
string : sess The session to check
bool : useFilter (default=true) Whether or not to actually use this filter
Returns: A boolean - true if the current bar falls within the given time session
barOutSession(string, bool) Determines if the current price bar falls outside the specified session
Parameters:
string : sess The session to check
bool : useFilter (default=true) Whether or not to actually use this filter
Returns: A boolean - true if the current bar falls outside the given time session
dateFilter(int, int) Determines if this bar's time falls within date filter range
Parameters:
int : startTime The UNIX date timestamp to begin searching from
int : endTime the UNIX date timestamp to stop searching from
Returns: A boolean - true if the current bar falls within the given dates
dayFilter(bool, bool, bool, bool, bool, bool, bool) Checks if the current bar's day is in the list of given days to analyze
Parameters:
bool : monday Should the script analyze this day? (true/false)
bool : tuesday Should the script analyze this day? (true/false)
bool : wednesday Should the script analyze this day? (true/false)
bool : thursday Should the script analyze this day? (true/false)
bool : friday Should the script analyze this day? (true/false)
bool : saturday Should the script analyze this day? (true/false)
bool : sunday Should the script analyze this day? (true/false)
Returns: A boolean - true if the current bar's day is one of the given days
atrFilter()
fillCell()

BE_CustomFx_LibraryLibrary "BE_CustomFx_Library"
A handful collection of regular functions, Custom Tools & Utility Functions could be used in regular Scripts. hope these functions can be understood by a non programmer like me too.
G_TextValOfNumber(ValueToConvert, RequiredDecimalPlaces, BeginingChar, EndChar) Function to return the String Value of Number with decimal precision with the prefix and suffix characters provided
Parameters:
ValueToConvert : = Number to Convert
RequiredDecimalPlaces : = No of Decimal values Required. supports to a max of 5 decimals else defaults to 2
BeginingChar : = Prefix character which is needed.
EndChar : = Suffix character which is needed.
Returns: Returns Out put with formated value of Given Number for the specified deicimal values with Prefix and suffix string
G_TradableValue(ValueToConvert, NeedCustomization, RequiredDecimalPlaces) Function to return the Tradable Value of Number
Parameters:
ValueToConvert : = Number to Convert
NeedCustomization : = set to 1 if you want to customize the decimal percision values. default is No customization needed, which provides output equalent to round_to_mintick
RequiredDecimalPlaces : = if NeedCustomization is set to 1 mention the decimal percision value required. max supported decimal is 5 else defaults to 2
Returns: Returns Out put with formated value of Given Number
G_TxtSizeForLables(SizeValue) Function to Get size Value for text values used in Lables
Parameters:
SizeValue : = auto, tiny, small, normal, large, huge. specify either of these values or default value Normal will be displayed as output
Returns: Returns Respective Text size
G_Reg_LineType(LineType) Function to Get Line Style Value for text values used in Lines
Parameters:
LineType : = 'solid (─)', 'dotted (┈)', 'dashed (╌)', 'arrow left (←)', 'arrow right (→)', 'arrows both (↔)' or default line style 'dotted (┈)' will be the output
Returns: Returns Respective Line style
G_ShapeTypeForLables(ShapeType) Function to Get Shape Style Value for text values used in plot shapes
Parameters:
ShapeType : = 'XCross', 'Cross', 'Triangle Up', 'Triangle Down', 'Flag', 'Circle','Arrow Up', 'Arrow Down','Lable Up', 'Lable Down' or default shpae style Triangle Up will be the output
Returns: Returns Respective Shape style
G_Indicator_Val(string, float, int, int) Gets Output of the technical analyis indicator which has length Parameter. RSI, ATR, EMA, SMA, HMA, WMA, VWMA, 'CMO', 'MOM', 'ROC','VWAP'
Parameters:
string : IndicatorName to be specified
float : SrcVal for the TA indicator default is close
int : Length for the TA indicator
int : DecimalValue optional to specify if required formatted output with decimal percision
Returns: Value with the given parameters
G_CandleInfo(string, bool, float, bool) function to get Candle Informarion such as both wicksize, top wick size , bottom wick size, full candle size and body size in default points
Parameters:
string : WhatCandleInfo, string input with either of these options "Wick" , "TWick" , "BWick" , "Candle", "Body" , "BearfbVal", "BullfbVal" , "CandleOpen" ,"CandleClose", "CandleHigh" , "CandleLow", "BodyPct"
bool : RepaintingVersion, set to true if required data on the realtime bar else default is set to false
float : FibValueOfCandle, set the fibo value to extract fibvalue of the candle else default is set to 38.2%
bool : AccountforGaps, set to true if required data on considering the gap between previous and current bar else default is set to false
Returns: Returns Respective values for the candles
G_BullBearBarCount(int, int) Counts how many green & red bars have printed recently (ie. pullback count)
Parameters:
int : HowManyCandlesToCheck The lookback period to look back over
int : BullBear The color of the bar to count (1 = Bull, -1 = Bear), Open = close candles are ignored
Returns: The bar count of how many candles have retraced over the given lookback with specific candles
BarToStartYourCalculation(Int) function to get candle co-ordinate in order to use it further for calculating your analysis work . "Heart full Thanks to 3 Pine motivators (LonesomeTheBlue, Myank & Sriki) who helped me cracking this logic"
Parameters:
Int : SelectedCandleNumber (default=450) How many candles you would need to anlysie in your script from the right.
Returns: A boolean - output is returned to say the starting point and continue to diplay true for the future candles
isHammer(float, bool, bool) Checks if the current bar is a hammer candle based on the given parameters
Parameters:
float : fib (default=0.382) The fib to base candle body on
bool : colorMatch (default=false) Does the candle need to be green? (true/false)
bool : NeedRepainting (default=false) Specify True if you need them to calculate on the realtime bars
Returns: A boolean - true if the current bar matches the requirements of a hammer candle
isStar(float, bool, bool) Checks if the current bar is a shooting star candle based on the given parameters
Parameters:
float : fib (default=0.382) The fib to base candle body on
bool : colorMatch (default=false) Does the candle need to be red? (true/false)
bool : NeedRepainting (default=false) Specify True if you need them to calculate on the realtime bars
Returns: A boolean - true if the current bar matches the requirements of a shooting star candle
isDoji(float, float, bool) Checks if the current bar is a doji candle based on the given parameters
Parameters:
float : _wickSize (default=1.5 times) The maximum allowed times can be top wick size compared to the bottom (and vice versa)
float : _bodySize (default= 5 percent to be mentioned as 0.05) The maximum body size as a percentage compared to the entire candle size
bool : NeedRepainting (default=false) Specify true if you need them to calculate on the realtime bars
Returns: A boolean - true if the current bar matches the requirements of a doji candle
isBullishEC(float, float, bool, bool) Checks if the current bar is a bullish engulfing candle
Parameters:
float : _allowance (default=0) How many POINTS to allow the open to be off by (useful for markets with micro gaps)
float : _rejectionWickSize (default=disabled) The maximum rejection wick size compared to the body as a percentage
bool : _engulfWick (default=false) Does the engulfing candle require the wick to be engulfed as well?
bool : NeedRepainting (default=false) Specify True if you need them to calculate on the realtime bars
Returns: A boolean - true if the current bar matches the requirements of a bullish engulfing candle
isBearishEC(float, float, bool, bool) Checks if the current bar is a bearish engulfing candle
Parameters:
float : _allowance (default=0) How many POINTS to allow the open to be off by (useful for markets with micro gaps)
float : _rejectionWickSize (default=disabled) The maximum rejection wick size compared to the body as a percentage
bool : _engulfWick (default=false) Does the engulfing candle require the wick to be engulfed as well?
bool : NeedRepainting (default=false) Specify True if you need them to calculate on the realtime bars
Returns: A boolean - true if the current bar matches the requirements of a bearish engulfing candle
Plot_TrendLineAtDegree(float, float, int, string, bool) helps you to plot the Trendlines based on the specified angle at the defined price to bar ratio
Parameters:
float : Degree (default=14) angle at which Trendline to be plot
float : price2bar_ratio (default=1e-10) The maximum rejection wick size compared to the body as a percentage
int : Bars2Plot (default=6) Does the engulfing candle require the wick to be engulfed as well?
string : LineStyle = 'solid (─)', 'dotted (┈)', 'dashed (╌)', 'arrow left (←)', 'arrow right (→)', 'arrows both (↔)' or default line style 'dotted (┈)' will be the output
bool : PlotOnOpen_Close (default=false) Specify True if you need them to calculate on the Open\Close Values
Returns: plot the Trendlines based on the specified angle at the defined price to bar ratio
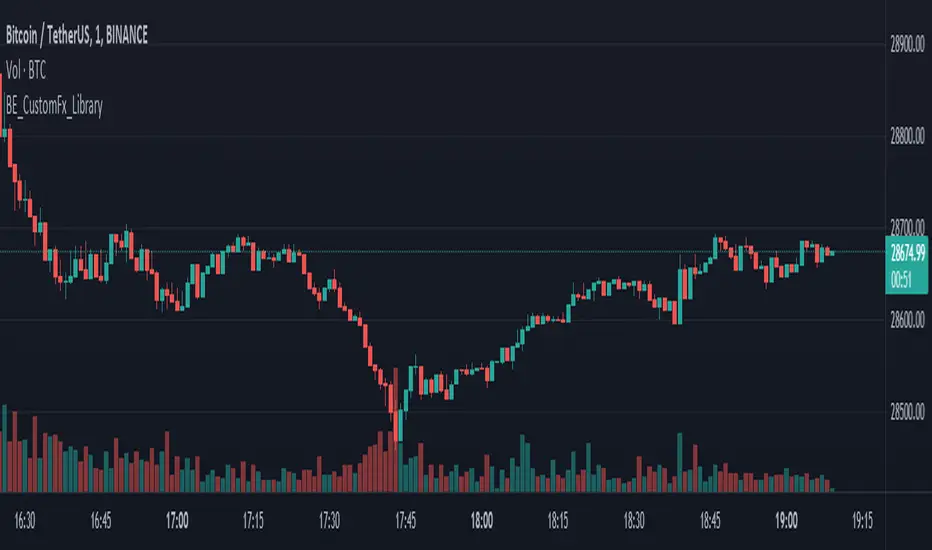
Raff Regression Channel by DGTRᴀꜰꜰ Rᴇɢʀᴇꜱꜱɪᴏɴ Cʜᴀɴɴᴇʟ (RRC)
This study aims to automate Raff Regression Channel drawing either based on ZigZag Indicator or optionally User Preference
The Raff Regression Channel , developed by Gilbert Raff, is based on a linear regression, which is the least-squares line-of-best-fit for a price series, with evenly spaced trend lines above and below . The width of the channel is set by determining the high or low that is the furthest from the linear regression.
Because the channel distance is based off the largest pullback or highest peak within a trend, for effectively drawing and using a Raff Regression Channel it is recommend/required that a Raff Regression Channel is applied to “mature” trends. Knowing this requirement, for better automated drawing results this study benefits from the Zig Zag Indicator, where the Zig Zag indicator is used to help identify price trends and changes in price trends. Option to manually adjust lengths for drawing a Raff Regression Channel is also made available.
Using a Raff Regression Channel
Once The Raff Regression Channel is drawn, covering an existing trend, Exᴛᴇɴꜱɪᴏɴ Lɪɴᴇꜱ are drawn to identify ᴛʜᴇ ꜱᴜᴘᴘᴏʀᴛ﹐ʀᴇꜱɪꜱᴛᴀɴᴄᴇ ᴏʀ ʀᴇᴠᴇʀꜱᴀʟ ᴘᴏɪɴᴛꜱ
The trend is up as long as prices rise within this channel. An uptrend may be reversing (not always, but likely) when price breaks below the channel extension . The trend is down as long as prices decline within the channel. Similarly, a downtrend may be reversing (not always, but likely) when price breaks above the channel extension . Moves outside the channel extensions can be indication of a reversal or can denote overbought or oversold conditions
For further details please refer to education post Raff Regression Channel
█ FEATURES
- AUTO or MANUALLY adjusted Raff Regression Channel and Channel Extentions drawing
- ALERTs, for Linear Regression Line, Raff Regression Upper and Lower Channel Extentions
- LSMA , Least Squares Moving Average, in other words Linear Regression Curve
█ SETTINGS
Setting Loopback and Number of Bars are the most important part for The Raff Regression Channel, where ;
- Lookback, defines where the Raff Regression Channel is starting, it is recommended to set to a trend begining
- Number of Bars, defines how many bars to be assumed for calculation, or simply stated the end of the Raff Regression Channel drawing (not extentions but the main channel, extentions by default will be drawn till the last bar)
Setting of Loopback and Number of Bars is performed eigher automatically based on Zig Zag indicator or users may prefer to set them manually. If selected automatically then
- Deviation and Depth values of Zig Zag indicator are used for calculations (enabling visually plotting of ZigZag Lines will help to identify better visually the points), where ;
Deviation, is a multiplier that affects how much the price should deviate from the previous pivot in order for the bar to become a new pivot.
Depth, affects the minimum number of bars that will be taken into account when building
Short-term traders may wish to apply the channel to small waves of a trend so they can reduce the value of the Deviation and Depth
█ OTHER CHANNEL CONSEPTS
Linear Regression Channels, , what linear regression channels are? and linear regression channel/curve/slope study
Fibonacci Channels, how to apply fibonacci channels and automated fibonacci channels study
Andrews’ Pitchfork, how to apply pitchfork and automated pitchfork study
Special Thanks to @Kiss66000 for his kind suggestion, je vous remercie beaucoup @Kiss66000
Disclaimer :
Trading success is all about following your trading strategy and the indicators should fit within your trading strategy, and not to be traded upon solely
The script is for informational and educational purposes only. Use of the script does not constitute professional and/or financial advice. You alone have the sole responsibility of evaluating the script output and risks associated with the use of the script. In exchange for using the script, you agree not to hold dgtrd TradingView user liable for any possible claim for damages arising from any decision you make based on use of the script
HeikinAshi Fibonacci Retracement v2It draws Fib retracements based on the highest high measured when HeikinAshi candles are green, and lows based on when HeikinAshi candles are red.
The idea is that you can see the fib retracements based on HeikinAshi trends on a larger timeframe to help trade in smaller timeframes.
for v2 I reset the fib trace when a new high is set and also at the second green heikin candle. And I only show the last 20 bars of fib lines to avoid confusion and focus on the current trade.
Happy trading!
HullfibSo this indicator is just to show a concept
it based on Bollinger type of fibs with regular daily fibs (upper =red,lower= blue) and the signal produce by the Hull moving average
the idea is to compare the regular fibs and the Bollinger type of fibs so it easy in this way to see where the real low and where the real high
the hull moving average can be set to be faster or shorter for the buy signal. since it open code you can add or change what ever you want
have fun
Price Probability Engine - Volatility & Structure-Based TargetsThe aim of the indicator is:
To provide adaptive, probability-weighted price target zones that help traders frame where price is most likely to interact next, without predicting when or guaranteeing direction.
Price Probability Engine is a target-projection overlay that blends three independent “next-move” reference methods into a single pair of AVG targets:
AVG Bull = a probabilistic upside objective
AVG Bear = a probabilistic downside objective
It is designed to help you frame the most reasonable near-term price zones using both volatility (ATR) and structure (pivot swings + measured moves) rather than relying on a single indicator.
What you see on the chart
When enabled, the script plots:
AVG Bull line (upper target)
AVG Bear line (lower target)
Optional last-bar labels that print the current target values
The overlay is scale-locked so the plots stay aligned with price when you scroll/zoom the chart.
How it works (conceptual, step-by-step)
1) ATR “reach filter” (probability gating)
All components are first checked against a reach filter:
A target is considered “reachable” only if it is within
Reach Filter × ATR from the current price.
This prevents extremely distant projections from dominating the final average.
2) Three component target engines
The script computes three upside candidates and three downside candidates:
A) ATR Component (volatility projection)
Uses ATR Length and ATR Multiplier
Projects a simple near-term band around price:
atrBull = close + ATR × mult
atrBear = close - ATR × mult
Direction mode:
Candle: compares close to close
Momentum(3): uses close − close
B) AutoFib Component (swing extension)
Detects swing highs/lows using pivot logic (Left/Right bars)
Projects an extension using a selectable Fib level (1.272 / 1.414 / 1.618 / 2.0 / 2.618)
Gives a structure-based target derived from the current swing range
C) Lindsey Component (measured-move target)
Detects a 3-point pivot sequence (P1/P2/P3) and projects a measured move to P4:
Bull: from a low-high-higher-low sequence
Bear: from a high-low-lower-high sequence
Optional P1/P2/P3 markers can be displayed for learning/debugging
3) Dynamic weighting (closer targets matter more)
If Dynamic Weights is enabled, each component’s weight increases as the target gets closer to price (within the reach window).
This means the final AVG tends to favor targets that are both reachable and near-term relevant.
You can control:
Base Weight (Fib / Lindsey / ATR)
Dynamic Power (how aggressively “closer” becomes “heavier”)
4) Outlier trimming (stability)
If Trim Outlier Component is enabled, the script:
computes a simple median reference of the remaining component targets
drops any target that deviates from the median by more than
Outlier Threshold × ATR
This reduces sudden jumps when one method produces an unusually extreme projection.
5) Final output: a weighted average (bull + bear)
The remaining eligible components are combined into:
AVG Bull (weighted average of bull candidates)
AVG Bear (weighted average of bear candidates)
If no components pass the reach filter (or are trimmed), the AVG line can temporarily become unavailable until valid inputs re-appear.
How to use it (practical workflow)
Pick your timeframe, then tune ATR:
Start with ATR Length 14 and ATR Mult 1.0–1.5
Set a reasonable Reach Filter (x ATR):
Smaller = only near targets
Larger = includes more distant projections
Decide how you want it to behave:
Dynamic Weights ON for “closer targets dominate”
Outlier Trim ON for smoother / less erratic averages
Use the AVG lines as planning zones, not certainties:
They are best treated as “where price is most likely to seek next” based on the blend of volatility + structure.
A common use is to monitor how price reacts as it approaches either AVG line (stalling, rejection, acceleration), and then reassess as new pivots/ATR values update.
Settings guide (quick)
ATR Length / Multiplier: controls the volatility envelope
Direction Mode: changes the bias input for ATR projection
Lindsey Left/Right: smaller = more sensitive pivots; larger = fewer, more meaningful pivots
Fib Left/Right + Extension: controls the swing structure target
Reach Filter: controls what qualifies as a realistic near-term target
Dynamic Power: higher = stronger preference for the nearest target
Outlier Threshold: higher = fewer removals; lower = more aggressive trimming
Notes / Transparency
This script does not place trades or guarantee outcomes. It is a visual target framework that adapts as volatility and market structure change. For best clarity, publish charts with this script on a clean layout so the AVG lines and labels are easy to identify.

Crypto Professional Suite V2.0 [R2D2]Here is the complete professional documentation and strategy guide for your Crypto Pro Suite indicator. This guide is designed to help you install the tool correctly, understand its features, and utilize it to maximize your trading returns.
Crypto Pro Suite: The Professional Crypto Trader's All-In-One Toolkit
1. Introduction
The Crypto Pro Suite is a high-performance TradingView indicator designed to consolidate the five most critical technical analysis tools into a single, clean overlay.
Instead of cluttering your screen with multiple sub-charts (panes), this suite integrates Moving Averages, Bollinger Bands, and Fibonacci Levels directly onto the price action. It transforms "oscillator" data (RSI and MACD) into actionable Buy/Sell signals on your candles and a real-time Status Dashboard.
Key Features:
Zero Clutter: No bottom panes required; maximizes screen real estate for price analysis.
Real-Time Dashboard: Instant readout of Trend, RSI status, and MACD momentum.
Dynamic Overlay: Indicators move fluidly with your candles.
2. Installation Instructions
Follow these steps precisely to ensure the "Overlay" feature functions correctly.
Clean Slate: If you have any previous version of this script on your chart, remove it now (click the 'X' next to the indicator name).
Open Editor: Click the Pine Editor tab at the bottom of your TradingView screen.
Paste Code: Delete any existing text and paste the Final Polished Script provided in the previous response.
Save & Add: Click Save, then click Add to chart.
Note: By adding it fresh, TradingView forces the script to lock onto the price candles rather than a separate pane.
Verify: You should see colored lines (MAs, Bollinger Bands) directly on top of your candlesticks and a Dashboard in the top right.
3. Using the Script: Settings & Customization
Access the settings by clicking the Gear Icon next to the indicator name.
Dashboard: You can toggle the info panel On/Off or change its size (Tiny to Large) to fit your screen resolution.
Toggle Control: Each of the 5 indicators has a "Show" checkbox. You can turn off noise (e.g., hide Bollinger Bands) when you only want to focus on Trend (MAs).
Inputs:
MAs: Defaults are 50/200 (Classic Golden Cross setup).
RSI: Default is 14 length, 70/30 limits.
Fibs: Default lookback is 200 bars. Increase this number to find Support/Resistance over a longer timeframe.
4. Maximizing Returns: Strategy & Examples
To maximize returns, professionals do not use indicators in isolation. They look for Confluence—where multiple indicators signal the same direction simultaneously.
A. Moving Averages (Trend Filter)
The Setup: The script plots a Fast MA (Yellow) and Slow MA (Blue).
Strategy:
Golden Cross (Buy): When the Yellow line crosses above the Blue line. This signals the start of a long-term bull trend.
Death Cross (Sell): When the Yellow line crosses below the Blue line.
Pro Tip: Never go long (Buy) if price is significantly below the Blue (Slow) MA.
B. Relative Strength Index (RSI)
The Setup: Instead of a line graph, you will see labels on the candles: "RSI Buy" (Green) or "RSI Sell" (Red).
Strategy:
Mean Reversion: If you see an "RSI Sell" label, the asset is Overbought. This is often a signal to take profit, not necessarily to short.
The Dip Buy: Look for an "RSI Buy" label occurring during a general uptrend (price above Slow MA). This indicates a healthy pullback that is ready to bounce.
C. MACD (Momentum)
The Setup: Green Triangles (Buy) and Red Triangles (Sell) appear above/below candles.
Strategy:
Trend Confirmation: Use MACD to confirm the Moving Average. If price crosses above the MA and you get a Green MACD Triangle, the breakout has high momentum and is likely to succeed.
Exit Signal: If you are in a Long trade and see a Red MACD Triangle, momentum is fading. Consider tightening your stop-loss.
D. Bollinger Bands (Volatility)
The Setup: A shaded teal channel surrounding the price.
Strategy:
The Squeeze: When the bands get very narrow, a massive move is coming. Wait for the breakout.
Walking the Bands: In a strong crypto bull run, price will hug the Upper Band. If price closes outside the band and then immediately closes inside it, it is a reversal signal (Sell).
E. Fibonacci Retracement (Support/Resistance)
The Setup: Dynamic horizontal lines (0%, 23.6%, 38.2%, 50%, 61.8%, 100%) based on recent highs/lows.
Strategy:
The Golden Pocket: The most powerful buy zone in crypto is between the 0.5 and 0.618 lines.
Execution: If price falls to the 0.618 line and you see an "RSI Buy" or MACD Green Triangle appear at that exact level, this is a high-probability entry.
5. The "Perfect Trade" Example
Putting it all together for maximum profit.
Context: The Dashboard says "MA Trend: Bullish."
Trigger: Price pulls back down and touches the 0.618 Fibonacci line.
Confirmation 1: Price is also touching the Lower Bollinger Band (acting as dynamic support).
Confirmation 2: An "RSI Buy" label appears on the candle.
Action: BUY.
Stop Loss: Place just below the 100% Fib line.
Take Profit: Sell half at the 0% Fib line (recent high) and let the rest ride.

Macros+AMD [NW]Macros + AMD - Daily & Weekly Time-Based Analysis
Multi-timeframe AMD (Accumulation, Manipulation, Distribution) visualization with ICT Macro timing windows for time-based market analysis.
Overview
This indicator visualizes the AMD (Accumulation, Manipulation, Distribution) framework on both daily and weekly timeframes, combined with ICT Macro timing windows. It is designed as an educational tool to help traders study time-based market structure and algorithmic price delivery concepts.
The AMD model is based on the idea that markets move through distinct phases within each trading period:
Accumulation (A) - Initial range formation, liquidity building
Manipulation (M) - False moves to trap traders, liquidity sweeps
Distribution (D) - True directional move, price delivery to targets
What This Indicator Displays
Daily AMD Phases
Displays the intraday AMD cycle based on New York trading hours:
A Phase (Blue): 4:00 AM - 8:35 AM EST — Morning accumulation, Asian/London overlap
M Phase (Red): 8:35 AM - 11:25 AM EST — NY session manipulation, news events
D Phase (Green): 11:25 AM - 4:00 PM EST — Afternoon distribution and price delivery
Weekly AMD Phases
Displays the weekly AMD cycle from Monday to Monday:
A Phase: Monday 00:00 - Tuesday 21:56 EST — Weekly high/low formation begins
M Phase: Tuesday 21:56 - Thursday 02:04 EST — Mid-week reversal zone
D Phase: Thursday 02:04 - Monday 00:00 EST — Weekly price delivery
Inner M Phase Fibs
When enabled, subdivides the M (Manipulation) phase using Fibonacci levels:
0.382 level — Inner accumulation ends
0.500 level — Mid-point of manipulation
0.618 level — Inner distribution begins
This helps identify potential reversal points within the manipulation phase.
ICT Macro Windows
Horizontal lines marking the XX:42 to XX:15 macro periods (33-minute windows):
2:42 - 3:15 AM
3:42 - 4:15 AM (London)
7:42 - 8:15 AM
8:42 - 9:15 AM
9:42 - 10:15 AM (Prime AM session)
10:42 - 11:15 AM
11:42 - 12:15 PM
12:42 - 1:15 PM
1:42 - 2:15 PM
2:42 - 3:15 PM
These windows represent times when algorithmic price delivery is more likely to occur.
How To Use
Understanding the AMD Framework
During the A Phase:
Observe range formation and initial liquidity pools
Note the high and low established during this phase
Wait for manipulation before committing to direction
During the M Phase:
Watch for false breakouts and stop hunts
Look for reversal patterns after liquidity sweeps
The inner fibs (0.382, 0.5, 0.618) can help time entries within this phase
Mid-week (Wednesday) often sees key reversals on weekly AMD
During the D Phase:
This is typically when the true move occurs
Price tends to deliver toward draw on liquidity targets
The direction is often opposite to the manipulation move
Using the Macro Windows
The XX:42 to XX:15 windows are times to pay attention to price action:
These 33-minute periods often see increased algorithmic activity
Look for displacement, fair value gaps, or order blocks forming
The 9:42-10:15 AM window is considered particularly significant for NY session
Weekly Day Labels
Monday/Tuesday: "H/L of Week" — Watch for weekly high or low formation
Wednesday: "Reversal Day" — Mid-week reversal probability increases
Thursday/Friday: "Reversal Day" — Continuation or secondary reversal
Settings Guide
Main Settings
Timezone: Set to your broker's timezone or preferred timezone
Macros On Top: Toggle macro lines above or below AMD boxes
Show All Text Labels: Master toggle for all text (turn off for clean charts on HTF)
Daily/Weekly AMD
Show: Enable/disable the AMD visualization
Opacity: Adjust transparency of the phase boxes (higher = more transparent)
AMD Colors
Customize colors for each phase (A, M, D)
Default: Blue (A), Red (M), Green (D)
Inner M Style
Customize the inner M phase fib lines and text colors
Default: Black lines for clean visibility
Macro Settings
Adjust macro line color and thickness
Toggle individual macro windows on/off
Important Notes
This indicator is for educational purposes and time-based analysis
It does not provide buy/sell signals
Always use in conjunction with proper price action analysis
Past price behavior during these time windows does not guarantee future results
The AMD framework is one lens for viewing market structure — use it as part of a complete methodology
Credits
This indicator is based on concepts taught by ICT (Inner Circle Trader) and the broader Smart Money Concepts community. The AMD framework, macro timing windows, and weekly profile concepts are derived from this educational methodology.
Timeframe Recommendations
Best viewed on 1-minute to 15-minute charts
Text labels automatically hide on 9-minute and higher timeframes for cleaner visualization
Indicator hides completely on 1-hour and higher timeframes
Changelog
v1.0 - Initial release
Daily AMD phases (4am-4pm EST)
Weekly AMD phases (Monday-Monday)
Inner M phase Fibonacci subdivisions
10 ICT Macro timing windows
Full customization options
Automatic 9-day cleanup

Complete Harmonic PatternOverview:
The ultimate harmonic XABCD pattern identification, prediction, and backtesting system.
Harmonic patterns are among the most accurate of trading signals, yet they're widely underutilized because they can be difficult to spot and tedious to validate. If you've ever come across a pattern and struggled with questions like "are these retracement ratios close enough to the harmonic ratios?" or "what are the Potential Reversal levels and are they confluent with point D?", then this tool is your new best friend. Or, if you've never traded harmonic patterns before, maybe it's time to start. Put away your drawing tools and calculators, relax, and let this indicator do the heavy lifting for you.
- Identification -
An exhaustive search across multiple pivot lengths ensures that even the sneakiest harmonic patterns are identified. Each pattern is evaluated and assigned a score, making it easy to differentiate weak patterns from strong ones. Tooltips under the pattern labels show a detailed breakdown of the pattern's score and retracement ratios (see the Scoring section below for details).
- Prediction -
After a pattern is identified, paths to potential targets are drawn, and Potential Reversal Zone (PRZ) levels are plotted based on the retracement ratios of the harmonic pattern. Targets are customizable by pattern type (e.g. you can specify one set of targets for a Gartley and another for a Bat, etc).
- Backtesting -
A table shows the results of all the patterns found in the chart. Change your target, stop-loss, and % error inputs and observe how it affects your success rate.
//------------------------------------------------------
// Scoring
//------------------------------------------------------
A percentage-based score is calculated from four components:
(1) Retracement % Accuracy - this measures how closely the pattern's retracement ratios match the theoretical values (fibs) defined for a given harmonic pattern. You can change the "Allowed fib ratio error %" in Settings to be more or less inclusive.
(2) PRZ Level Confluence - Potential Reversal Zone levels are projected from retracements of the XA and BC legs. The PRZ Level Confluence component measures the closeness of the closest XA and BC retracement levels, relative to the total height of the PRZ.
(3) Point D / PRZ Confluence - this measures the closeness of point D to either of the closest two PRZ levels (identified in the PRZ Level Confluence component above), relative to the total height of the PRZ. In theory, the closer together these levels are, the higher the probability of a reversal.
(4) Leg Length Symmetry - this measures the ΔX symmetry of each leg. You can change the "Allowed leg length asymmetry %" in settings to be more or less inclusive.
So, a score of 100% would mean that (1) all leg retracements match the theoretical fib ratios exactly (to 16 decimal places), (2) the closest XA and BC PRZ levels are exactly the same, (3) point D is exactly at the confluent PRZ level, and (4) all legs are exactly the same number of bars. While this is theoretically possible, you have better odds of getting struck by lightning twice on a sunny day.
Calculation weights of all four components can be changed in Settings.
//------------------------------------------------------
// Targets
//------------------------------------------------------
A hard-coded set of targets are available to choose from, and can be applied to each pattern type individually:
(1) .618 XA = .618 retracement of leg XA, measured from point D
(2) 1.272 XA = 1.272 retracement of leg XA, measured from point D
(3) 1.618 XA = 1.618 retracement of leg XA, measured from point D
(4) .618 CD = .618 retracement of leg CD, measured from point D
(5) 1.272 CD = 1.272 retracement of leg CD, measured from point D
(6) 1.618 CD = 1.618 retracement of leg CD, measured from point D
(7) A = point A
(8) B = point B
(9) C = point C

BHUVANA Fibonacci squeezed 50%–61.8% bandThis indicator is designed based on XAUUSD and in the 5 min time frame,When it looks like upstairs it is BUY trend (uptrend),Wjen it looks like downstairs the trend is sell (ie)Down trend)
Swing mapping: Finds the active high/low over a user-defined lookback and computes Fib 50% and Fib 61.8%.
Squeeze detection: Measures the distance between 50% and 61.8%. If the band width is ≤ (ATR × multiplier), the zone is flagged as a Squeeze.
Breakout entries (on close):
Long when price crosses up through 50% while squeezed.
Short when price crosses down through 61.8% while squeezed.
Risk framework: Auto-plots stop lines from the signal bar:
Long SL = swing low; Short SL = swing high.
Visuals: Fib lines (50/61.8) + optional yellow zone highlight during squeeze.
كلاستر
Detailed Description – Fibonacci Cluster Zones + OB + FVG (AR34)
This script is an advanced multi-layer confluence system developed under the AR34 Trading Framework, designed to identify high-accuracy reversal zones, liquidity imbalances, institutional footprints, and trend direction using a unified analytic engine.
It combines Fibonacci mathematics, Smart Money Concepts, market structure, and smart trend signals to produce precise, reliable trading zones.
⸻
🔶 1 — Fibonacci Retracement Zones + Custom Smart Levels
The script calculates the highest and lowest prices over a selected lookback period to generate key Fibonacci retracement levels:
• 0.236
• 0.382
• 0.500
• 0.618
• 0.786
• 1.000
You can also add up to three custom Fibonacci levels (0.66, 0.707, 0.88 or any value you want).
✔ Each level is drawn as a horizontal line
✔ Optional label display for every level
✔ Color and activation fully customizable
These levels help identify pullback zones and potential turning points.
⸻
🔶 2 — True Fibonacci Cluster Detection
The script automatically identifies Cluster Zones, which occur when:
1. A Fibonacci level
2. An Order Block
3. A Fair Value Gap
all overlap in the same price range.
When all three conditions align, the script prints a CLUSTER marker in yellow.
These zones represent:
• High-probability reversal areas
• Strong institutional footprints
• Highly reactive price levels
⸻
🔶 3 — Automatic Order Block (OB) Detection
The indicator detects Order Blocks based on structural candle behavior:
• Bearish candle → followed by bullish
• Price interacts with a Fibonacci level
• Area aligns with institutional order flow
When detected, the OB is marked for easy visualization.
⸻
🔶 4 — Fair Value Gap (FVG) Mapping
The script scans for liquidity imbalances using the classic FVG logic:
• low > high
When an FVG exists, it draws a green liquidity box.
This highlights:
• Gaps left by institutional moves
• High-value return zones
• Efficient price retracement levels
⸻
🔶 5 — Fibonacci Extension Projections
The script calculates extension targets using:
• 1.272
• 1.618
• 2.000
These are drawn as dashed teal lines and help forecast:
• Breakout continuation targets
• Wave extension objectives
• Take-profit areas
⸻
🔶 6 — Smart Trend Signal (EMA-200 Engine)
Trend direction is determined using the EMA 200:
• Price above EMA → uptrend
• Price below EMA → downtrend
A green or red signal icon appears only when the trend flips, reducing noise and improving clarity.
This helps detect:
• Trend shifts early
• Cleaner entries and exits
• Trend-based filtering
⸻
🔶 7 — Four-EMA Multi-Trend System
The indicator includes optional visualization of four moving averages:
• EMA 20 → Short-term
• EMA 50 → Medium-term
• EMA 100 → Long-term
• EMA 200 → Major trend
All are fully customizable (length + color + visibility).
⸻
🔶 8 — Dynamic Negative Fibonacci Levels (Green Only)
When enabled, the script calculates deep retracement zones using:
• –0.23
• –0.75
• –1.20
These negative Fibonacci levels are drawn in green and help identify:
• Deep liquidity capture points
• Hidden structural supports
• Potential reversal bottoms
⸻
🔶 9 — Complete User Control
Users maintain full control over:
✔ Enabling/disabling OB detection
✔ Enabling/disabling FVG detection
✔ Activating custom Fibonacci levels
✔ Showing or hiding labels
✔ Selecting timeframe for Fib calculations
✔ Adjusting moving average parameters
✔ Activating dynamic Fibonacci
The script is designed to be flexible, scalable, and suitable for any trading style.
⸻
🎯 Summary
This indicator is a powerful all-in-one analytical system that merges:
✔ Fibonacci Mathematics
✔ Smart Money Concepts (OB + FVG)
✔ Trend-based filtering
✔ Institutional cluster detection
✔ Dynamic extensions + retracements
✔ Multi-EMA trend mapping
شرح السكربت بالتفصيل – Fibonacci Cluster Zones + OB + FVG (AR34)
هذا السكربت هو نظام تحليل احترافي متكامل من تطوير AR34 Framework يجمع بين أقوى أدوات التداول الحديثة في مؤشر واحد، ويهدف إلى كشف مناطق الانعكاس القوية، والتجميع الذكي، والاتجاه العام، باستخدام مزيج علمي من فيبوناتشي + السيولة + الاتجاه.
يعمل هذا المؤشر بأسلوب Confluence Trading بحيث يدمج عدة مدارس مختلفة في طبقة واحدة لتحديد مناطق الانعكاس والارتداد والاختراق بدقة عالية.
⸻
🔶 1 — مناطق فيبوناتشي (Retracement) + الكلاستر الذكي
يقوم المؤشر بحساب أعلى وأدنى سعر خلال عدد محدد من الشموع (Retracement Length) ثم يرسم مستويات فيبوناتشي الكلاسيكية:
• 0.236
• 0.382
• 0.500
• 0.618
• 0.786
• 1.000
مع إمكانية إضافة 3 مستويات خاصة من اختيارك (0.66 – 0.707 – 0.88 وغيرها).
✔️ كل مستوى يتم رسمه بخط مستقل
✔️ يظهر بجانبه رقم المستوى إذا تم تفعيل خيار Show Fib Labels
✔️ يمكن تغيير لونه، قيمته، وتفعيله حسب رغبتك
⸻
🔶 2 — كاشف الكلاستر الحقيقي (Cluster Detection)
الكلاستر يُعتبر أقوى مناطق الارتداد في التحليل الفني.
السكربت يحدد الكلاستر عندما تتداخل 3 عناصر مع مستوى فيبوناتشي:
1. مستوى فيبوناتشي مهم
2. Order Block
3. Fair Value Gap
إذا اجتمعت الثلاثة في نفس المنطقة، يتم رسمها باللون الأصفر وتظهر كلمة CLUSTER.
هذا يعطيك:
• أقوى منطقة انعكاس
• أعلى دقة في تحديد نقاط الدخول
• مناطق ذات سيولة مرتفعة
⸻
🔶 3 — دمج Order Blocks تلقائياً
يكتشف المؤشر الـ OB الحقيقي باستخدام شروط حركة الشموع:
• bearish candle → bullish candle
• السعر لمس مستوى فيبوناتشي
• منطقة محتملة لتجميع المؤسسات
إذا تحققت الشروط يظهر OB باللون الأحمر.
⸻
🔶 4 — دمج Fair Value Gaps (FVG)
يكتشف الفجوات السعرية بين الشمعتين الأولى والثالثة:
• low > high
ويقوم برسم بوكس أخضر حول الفجوة (FVG Zone).
يساعدك على معرفة:
• مناطق اختلال السيولة
• أهداف السعر القادمة
• مناطق “العودة” المحتملة
⸻
🔶 5 — امتدادات فيبوناتشي (Fibonacci Extensions)
يقوم بحساب الامتدادات من مستويات:
• 1.272
• 1.618
• 2.0
ويظهرها بخطوط متقطعة (Teal Color).
هذه المستويات مهمة لتوقع:
• أهداف اختراق
• مناطق TP
• امتداد موجات السعر
⸻
🔶 6 — إشارة الاتجاه الذكية (Smart Trend Engine – EMA200)
يعتمد على EMA 200 لتحديد الاتجاه العام:
• إذا السعر فوق EMA200 → اتجاه صاعد
• إذا السعر تحت EMA200 → اتجاه هابط
ويظهر المؤشر:
🟢 سهم أخضر عند تحول الاتجاه لصعود
🔴 سهم أحمر عند تحول الاتجاه لهبوط
ميزة التحول فقط عند تغيير الاتجاه (No Noise).
⸻
🔶 7 — أربع موفنقات احترافية (EMA 20 – 50 – 100 – 200)
المؤشر يعرض الموفنقات الأربعة الأساسية:
• EMA 20 → اتجاه قصير
• EMA 50 → متوسط
• EMA 100 → طويل
• EMA 200 → الاتجاه الرئيسي
مع إمكانية:
• تغيير اللون
• تغيير الطول
• إخفائها وإظهارها
⸻
🔶 8 — فيبوناتشي الديناميكي (Dynamic Green Fib)
ميزة قوية جداً تظهر فقط عند تفعيلها.
تحسب أعلى وأدنى سعر في Lookback Period ثم ترسم مستويات سلبية:
• –0.23
• –0.75
• –1.20
هذه المستويات تظهر كخطوط خضراء تحت السعر وتستخدم لـ:
• تحديد مناطق الانعكاس المخفية
• رصد الدعم الديناميكي
• اكتشاف القيعان المحتملة
⸻
🔶 9 — المرونة الكاملة للمستخدم
المؤشر يسمح لك التحكم بكل شيء:
✔️ تفعيل/إلغاء الـ OB
✔️ تفعيل/إلغاء الـ FVG
✔️ تفعيل/إلغاء مستويات فيبوناتشي
✔️ إضافة مستويات مخصصة
✔️ اختيار الفريم المستخدم
✔️ تغيير الألوان
✔️ التحكم في الاتجاه والموفنقات
⸻
🎯 الخلاصة
هذا السكربت يعمل كنظام تحليلي متكامل يجمع:
✔️ فيبوناتشي
✔️ السيولة المؤسسية (OB + FVG)
✔️ الاتجاه الذكي
✔️ الكلاستر الاحترافي
✔️ الموفنقات
✔️ فيبوناتشي الديناميكي
