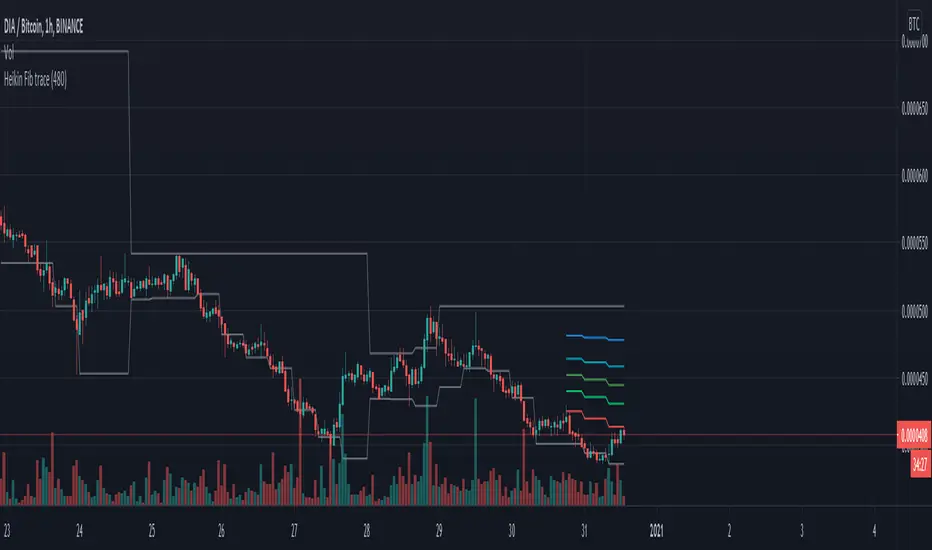
HeikinAshi Fibonacci Retracement v2It draws Fib retracements based on the highest high measured when HeikinAshi candles are green, and lows based on when HeikinAshi candles are red.
The idea is that you can see the fib retracements based on HeikinAshi trends on a larger timeframe to help trade in smaller timeframes.
for v2 I reset the fib trace when a new high is set and also at the second green heikin candle. And I only show the last 20 bars of fib lines to avoid confusion and focus on the current trade.
Happy trading!
Cari dalam skrip untuk "fib"
MTF Deviation - Mtrl_ScientistHi everyone,
There are a lot of possible ways to look at markets and find valid patterns.
This time, I've looked at how shorter time frames deviate from the overall price consensus.
What you're seeing here is a range-bound difference of the lowest time frame from the overall price consensus (baseline), represented as blue line.
When lower time frames agree with the baseline, the difference becomes 0.
Logically, this difference cannot deviate too much from the baseline, and to quantify that, I've added fib-levels based on a deviation percentage that depends on price volatility and can be adjusted in the settings.
How it works:
First of all, you need to switch to the 1min time frame to get access to the lowest time frame data.
Look at how the blue line follows the support/resistance fib levels.
Oversold conditions are usually given by entering the lowest red band, whereas overbought conditions are given by entering the upper red band.
However, there are also extreme cases, where the blue line exceeds the set fib levels. In that case, price will reverse with very high likelihood.
Alternatively you can also ping-pong between two fib levels for frequent small trades.
Note that this indicator doesn't use any security functions to access time frame data. Instead, I found a different way to avoid repainting.
At the moment I'm just playing around with this to see how I can improve it. Feedback is very welcome!

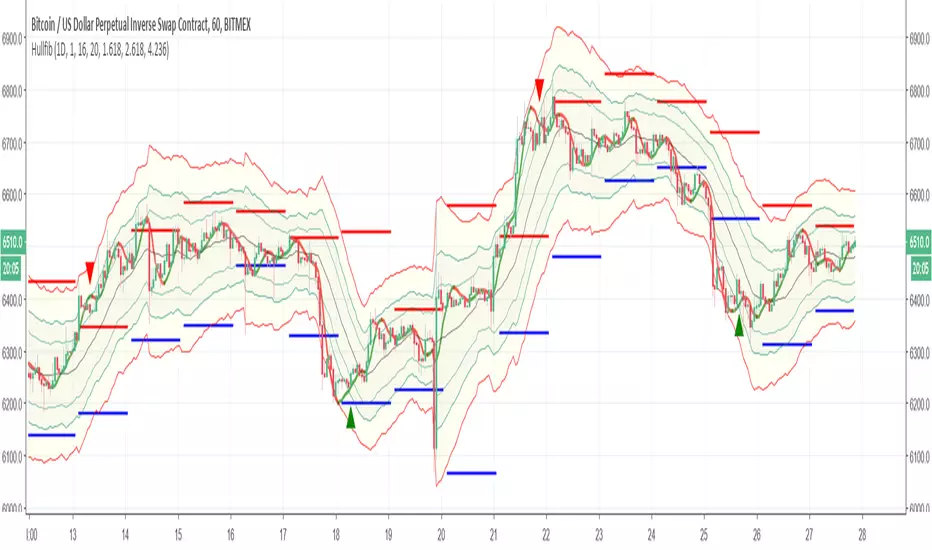
HullfibSo this indicator is just to show a concept
it based on Bollinger type of fibs with regular daily fibs (upper =red,lower= blue) and the signal produce by the Hull moving average
the idea is to compare the regular fibs and the Bollinger type of fibs so it easy in this way to see where the real low and where the real high
the hull moving average can be set to be faster or shorter for the buy signal. since it open code you can add or change what ever you want
have fun
swissknife system all in oneSO how this system work
1. B and S top and button are stoch cross points
2.the area highlighted in blue and red are zone where RSI DMI and ATR are in agreement
3. The candles are based on fibonaci so if the candle are below 10 is low fib and if above 90 its high fib
so how to find best buy points
1. search for B points the fall in blue area =RSI low and D- high
2.sell points =s that fall in red area =high rsi + D+ high
3. the candle based on fib so it easy to see if the points potential buy and sell fall in high or low fib
4. potential buy and sell points can also be found on base of cross of D- and D+ adding adx make it easy
in this version no alert but in next version I try to put something on it :)

B3 AutoEdgeBreak FibonacciHere is the lazy person's Fibonacci retracement drawing machine. Keep the bars in range pretty big, but you can play around and see what it does. If too small, it gets in your way, and If oversized, your retracements will not properly work upward and downward according to action. So, if you notice that it's always retracing the same direction, then lower the first input.
Now on top of the coding being tricky because of massive history in T-view, trading the Fibs is not an easy task either. Experienced Fib traders will probably love my script, and those that are not good at Fibs will love the historical look of it, but feel helpless in real-time. It took me years to learn a reaction pattern to the Fib lines, and the one key piece of my memory: if a price-line test comes and fails in relation to your trade, get out!!! <- Not real advice, just experience talking.
I expect to be upgrading this particular script in the future. Enjoy!

Macros+AMD [NW]Macros + AMD - Daily & Weekly Time-Based Analysis
Multi-timeframe AMD (Accumulation, Manipulation, Distribution) visualization with ICT Macro timing windows for time-based market analysis.
Overview
This indicator visualizes the AMD (Accumulation, Manipulation, Distribution) framework on both daily and weekly timeframes, combined with ICT Macro timing windows. It is designed as an educational tool to help traders study time-based market structure and algorithmic price delivery concepts.
The AMD model is based on the idea that markets move through distinct phases within each trading period:
Accumulation (A) - Initial range formation, liquidity building
Manipulation (M) - False moves to trap traders, liquidity sweeps
Distribution (D) - True directional move, price delivery to targets
What This Indicator Displays
Daily AMD Phases
Displays the intraday AMD cycle based on New York trading hours:
A Phase (Blue): 4:00 AM - 8:35 AM EST — Morning accumulation, Asian/London overlap
M Phase (Red): 8:35 AM - 11:25 AM EST — NY session manipulation, news events
D Phase (Green): 11:25 AM - 4:00 PM EST — Afternoon distribution and price delivery
Weekly AMD Phases
Displays the weekly AMD cycle from Monday to Monday:
A Phase: Monday 00:00 - Tuesday 21:56 EST — Weekly high/low formation begins
M Phase: Tuesday 21:56 - Thursday 02:04 EST — Mid-week reversal zone
D Phase: Thursday 02:04 - Monday 00:00 EST — Weekly price delivery
Inner M Phase Fibs
When enabled, subdivides the M (Manipulation) phase using Fibonacci levels:
0.382 level — Inner accumulation ends
0.500 level — Mid-point of manipulation
0.618 level — Inner distribution begins
This helps identify potential reversal points within the manipulation phase.
ICT Macro Windows
Horizontal lines marking the XX:42 to XX:15 macro periods (33-minute windows):
2:42 - 3:15 AM
3:42 - 4:15 AM (London)
7:42 - 8:15 AM
8:42 - 9:15 AM
9:42 - 10:15 AM (Prime AM session)
10:42 - 11:15 AM
11:42 - 12:15 PM
12:42 - 1:15 PM
1:42 - 2:15 PM
2:42 - 3:15 PM
These windows represent times when algorithmic price delivery is more likely to occur.
How To Use
Understanding the AMD Framework
During the A Phase:
Observe range formation and initial liquidity pools
Note the high and low established during this phase
Wait for manipulation before committing to direction
During the M Phase:
Watch for false breakouts and stop hunts
Look for reversal patterns after liquidity sweeps
The inner fibs (0.382, 0.5, 0.618) can help time entries within this phase
Mid-week (Wednesday) often sees key reversals on weekly AMD
During the D Phase:
This is typically when the true move occurs
Price tends to deliver toward draw on liquidity targets
The direction is often opposite to the manipulation move
Using the Macro Windows
The XX:42 to XX:15 windows are times to pay attention to price action:
These 33-minute periods often see increased algorithmic activity
Look for displacement, fair value gaps, or order blocks forming
The 9:42-10:15 AM window is considered particularly significant for NY session
Weekly Day Labels
Monday/Tuesday: "H/L of Week" — Watch for weekly high or low formation
Wednesday: "Reversal Day" — Mid-week reversal probability increases
Thursday/Friday: "Reversal Day" — Continuation or secondary reversal
Settings Guide
Main Settings
Timezone: Set to your broker's timezone or preferred timezone
Macros On Top: Toggle macro lines above or below AMD boxes
Show All Text Labels: Master toggle for all text (turn off for clean charts on HTF)
Daily/Weekly AMD
Show: Enable/disable the AMD visualization
Opacity: Adjust transparency of the phase boxes (higher = more transparent)
AMD Colors
Customize colors for each phase (A, M, D)
Default: Blue (A), Red (M), Green (D)
Inner M Style
Customize the inner M phase fib lines and text colors
Default: Black lines for clean visibility
Macro Settings
Adjust macro line color and thickness
Toggle individual macro windows on/off
Important Notes
This indicator is for educational purposes and time-based analysis
It does not provide buy/sell signals
Always use in conjunction with proper price action analysis
Past price behavior during these time windows does not guarantee future results
The AMD framework is one lens for viewing market structure — use it as part of a complete methodology
Credits
This indicator is based on concepts taught by ICT (Inner Circle Trader) and the broader Smart Money Concepts community. The AMD framework, macro timing windows, and weekly profile concepts are derived from this educational methodology.
Timeframe Recommendations
Best viewed on 1-minute to 15-minute charts
Text labels automatically hide on 9-minute and higher timeframes for cleaner visualization
Indicator hides completely on 1-hour and higher timeframes
Changelog
v1.0 - Initial release
Daily AMD phases (4am-4pm EST)
Weekly AMD phases (Monday-Monday)
Inner M phase Fibonacci subdivisions
10 ICT Macro timing windows
Full customization options
Automatic 9-day cleanup

RT-Custom Clouds|RSI|HMA|GPIntroduction
The RT-Custom Clouds|RSI|HMA|GP indicator is a multipurpose toolkit that combines custom Ichimoku clouds, custom RSI-based overlays, RSI Top/Bottom signals, Hull Moving Averages and automated Fibonacci Golden Pocket zones into a single indicator. It is designed to give traders flexible ways to view trend, momentum, and key zones on the chart.
This publication walks through each major component of the RT-Custom Clouds|RSI|HMA|GP indicator and how traders commonly use them.
Custom Ichimoku Clouds
The top section of RT Custom Clouds focuses on Ichimoku-style clouds. Traders can choose between different cloud variants and control whether they want the full Ichimoku toolkit or only the cloud itself on the chart.
A single toggle controls the cloud display: Cloud Only (All Versions) - When enabled, only the selected cloud is displayed. Core Ichimoku lines are hidden so traders who prefer a clean cloud view can keep their charts simple. Traders can select between three cloud styles: Josh Olszewicz Cloud (Preferred) - Uses a doubled parameter set inspired by the well-known Ichimoku variant popularized by Josh Olszewicz.
Standard Cloud - Uses the classic Ichimoku settings familiar from most charting platforms.
Custom Cloud - Allows full control over the main Ichimoku inputs:
Custom Conversion Line Length
Custom Base Line Length
Custom Leading Span Length
Custom Displacement
These options let traders move between a standard Ichimoku view, a doubled parameter variant, or a fully customized configuration tuned to their own style.
Custom RSI X's and RSI Bot Signals
The RT-Custom Clouds|RSI|HMA|GP indicator also includes an RSI X overlay that plots RSI information directly onto price candles instead of keeping it in a separate lower pane. This makes it easier to see momentum shifts and extended conditions without constantly looking down at another indicator. RSI Colors
Instead of drawing RSI as a line, the tool places colored X markers on candles to reflect RSI behavior. These markers use an adapted version of the Rainbow Trends color system. To keep candle colors and RSI markers visually distinct, the original Rainbow Trends color code is inverted for RSI. This inversion helps traders quickly distinguish between the underlying trend colors and the RSI-driven overlays: RSI Settings
The RSI section includes a focused set of options to tune how the X markers behave and how the RSI Bot interprets momentum:
RSI "X" Marker Sensitivity - Adjusts how sensitive the X markers are to RSI changes. Higher or lower values will change how often markers appear.
RSI Length - Controls how many candles are used when calculating RSI. The default value is similar to traditional 14-period RSI, but can be adjusted.
RSI Markers On/Off - Toggles the colored X markers on or off.
RSI Top/Bottom Signals On/Off - Toggles the RSI Bot signals that mark potential tops and bottoms.
RSI Overbought On/Off - Enables or disables overbought style X markers.
RSI Oversold On/Off - Enables or disables oversold style X markers.
RSI Bot - Tops And Bottoms
Over time, traders using this tool wanted a way to summarize longer stretches of RSI activity into clear signals. The RSI Top/Bottom Bot does this by watching runs of RSI X markers and waiting for those runs to pause.
Conceptually, the RSI Bot: Monitors when a strong sequence of RSI X markers is printing in one direction.
Waits for a candle where no RSI X marker appears after that run.
Marks that candle as a potential RSI Top or RSI Bottom, since the prior RSI pressure has paused and a reversal may start. These signals can be tied to TradingView alerts using standard alert conditions so traders can monitor major shifts in RSI behavior without watching every bar. Alerts can be set for either RSI Top signals or RSI Bottom signals. Hull Moving Average (HMA)
The RT-Custom Clouds|RSI|HMA|GP indicator also includes a Hull Moving Average component inspired by early users of Rainbow Trends tools who relied on tuned HMAs for trend context. The HMA implementation follows common definitions of the Hull Moving Average and can be configured with user-defined lengths. Many traders using this tool treat the HMA as a secondary trend filter or confirmation layer alongside other Rainbow Trends indicators. For example: Watching whether price is trading above or below a longer HMA to frame bullish or bearish bias.
Studying how price interacts with the HMA during extended trends or range rotations.
HMA Cross Alerts And Divergences
The tool can also draw and alert on HMA cross events and divergence style patterns: HMA Cross Alerts - Alerts can be configured when price or multiple HMAs cross, allowing traders to automate notifications for potential trend shifts.
HMA Divergences - An optional divergence mode looks for conditions similar to RSI divergence style setups, but applied to the HMA logic. These are intended as context layers around trend behavior, not as automatic entry and exit rules.
HMA Settings
The HMA module of this indicator can be tuned to meet each trader's preference.
Plot HMA - On/Off - Toggles the HMA Line on/off.
HMA Alerts - On/Off - Toggles HMA Alerts on/off.
Plot HMA Alerts - On/Off - Toggles HMA Alerts on/off.
Plot Divergences - On/Off - Toggles Divergences on/off so the trader can choose which specific ones they want to display.
HMA Period - Adjusts the period of candles the HMA is calculated off of.
HMA Source - Changes the base calculation of the HMA.
Pivot Lookbacks - Adjusts the candle lookback range for the HMA Divergences.
Max/Min of Lookback Range - Adjusts the min & max lookback range for the HMA Divergences. Fibonacci Golden Pockets
The RT-Custom Clouds|RSI|HMA|GP indicator also includes an automated Fibonacci Golden Pocket module. Instead of manually drawing Fibonacci retracements and marking the Golden Pocket region for each swing, the tool scans the chart and plots these zones for the trader.
The Golden Pocket module can be configured using:
Golden Pocket On/Off - Toggles automatic plotting of golden pocket zones.
Golden Pocket Colors - Controls line and fill appearance so zones can be made more or less prominent.
Lookback Period - Defines how far back the algorithm studies price action when searching for swings and drawing golden pocket zones.
Invert Fibs - Inverts the Golden Pocket measurement.
Extend Lines - Allows for the Fib lines to be plotted further across the chart.
Display Prices/Levels - Toggles plotting of the prices and Fib levels on and off. Some traders prefer to work with both traditional and inverted golden pockets at the same time. This can be done by adding RT Custom Clouds to the chart twice, running one instance with standard golden pocket settings and the second instance with inverted settings.
How Traders Commonly Use The RT-Custom Clouds|RSI|HMA|GP Indicator
Because the RT-Custom Clouds|RSI|HMA|GP indicator offers several tools into a single script, traders often use it as a multipurpose context layer rather than a one-dimensional indicator. Common patterns include: Using custom Ichimoku clouds to frame overall trend and support or resistance zones.
Overlaying RSI X markers and RSI Top/Bottom signals onto price to highlight momentum shifts and exhaustion areas.
Adding HMA and HMA cross alerts as a secondary trend confirmation tool.
Letting the Golden Pocket module continuously plot Fibonacci based zones to study how price reacts around them over time.
In all cases, RT Custom Clouds is designed to provide structured context that can be combined with other Rainbow Trends tools, price action, and volume analysis.
Important Note
The RT-Custom Clouds|RSI|HMA|GP indicator is intended to provide additional context around trend structure, momentum, and potential support or resistance zones. It is not a standalone signal generator and should always be used together with your own analysis, testing, and risk management. Historical examples or past interactions with clouds, RSI markers, HMAs, or golden pockets do not guarantee future results.
🐋 Tight lines and happy trading!

Complete Harmonic PatternOverview:
The ultimate harmonic XABCD pattern identification, prediction, and backtesting system.
Harmonic patterns are among the most accurate of trading signals, yet they're widely underutilized because they can be difficult to spot and tedious to validate. If you've ever come across a pattern and struggled with questions like "are these retracement ratios close enough to the harmonic ratios?" or "what are the Potential Reversal levels and are they confluent with point D?", then this tool is your new best friend. Or, if you've never traded harmonic patterns before, maybe it's time to start. Put away your drawing tools and calculators, relax, and let this indicator do the heavy lifting for you.
- Identification -
An exhaustive search across multiple pivot lengths ensures that even the sneakiest harmonic patterns are identified. Each pattern is evaluated and assigned a score, making it easy to differentiate weak patterns from strong ones. Tooltips under the pattern labels show a detailed breakdown of the pattern's score and retracement ratios (see the Scoring section below for details).
- Prediction -
After a pattern is identified, paths to potential targets are drawn, and Potential Reversal Zone (PRZ) levels are plotted based on the retracement ratios of the harmonic pattern. Targets are customizable by pattern type (e.g. you can specify one set of targets for a Gartley and another for a Bat, etc).
- Backtesting -
A table shows the results of all the patterns found in the chart. Change your target, stop-loss, and % error inputs and observe how it affects your success rate.
//------------------------------------------------------
// Scoring
//------------------------------------------------------
A percentage-based score is calculated from four components:
(1) Retracement % Accuracy - this measures how closely the pattern's retracement ratios match the theoretical values (fibs) defined for a given harmonic pattern. You can change the "Allowed fib ratio error %" in Settings to be more or less inclusive.
(2) PRZ Level Confluence - Potential Reversal Zone levels are projected from retracements of the XA and BC legs. The PRZ Level Confluence component measures the closeness of the closest XA and BC retracement levels, relative to the total height of the PRZ.
(3) Point D / PRZ Confluence - this measures the closeness of point D to either of the closest two PRZ levels (identified in the PRZ Level Confluence component above), relative to the total height of the PRZ. In theory, the closer together these levels are, the higher the probability of a reversal.
(4) Leg Length Symmetry - this measures the ΔX symmetry of each leg. You can change the "Allowed leg length asymmetry %" in settings to be more or less inclusive.
So, a score of 100% would mean that (1) all leg retracements match the theoretical fib ratios exactly (to 16 decimal places), (2) the closest XA and BC PRZ levels are exactly the same, (3) point D is exactly at the confluent PRZ level, and (4) all legs are exactly the same number of bars. While this is theoretically possible, you have better odds of getting struck by lightning twice on a sunny day.
Calculation weights of all four components can be changed in Settings.
//------------------------------------------------------
// Targets
//------------------------------------------------------
A hard-coded set of targets are available to choose from, and can be applied to each pattern type individually:
(1) .618 XA = .618 retracement of leg XA, measured from point D
(2) 1.272 XA = 1.272 retracement of leg XA, measured from point D
(3) 1.618 XA = 1.618 retracement of leg XA, measured from point D
(4) .618 CD = .618 retracement of leg CD, measured from point D
(5) 1.272 CD = 1.272 retracement of leg CD, measured from point D
(6) 1.618 CD = 1.618 retracement of leg CD, measured from point D
(7) A = point A
(8) B = point B
(9) C = point C

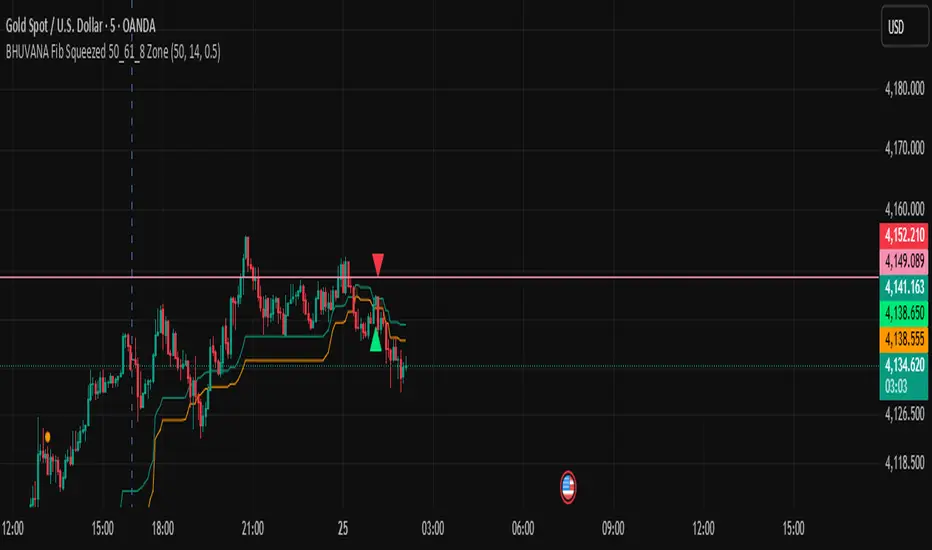
BHUVANA Fibonacci squeezed 50%–61.8% bandThis indicator is designed based on XAUUSD and in the 5 min time frame,When it looks like upstairs it is BUY trend (uptrend),Wjen it looks like downstairs the trend is sell (ie)Down trend)
Swing mapping: Finds the active high/low over a user-defined lookback and computes Fib 50% and Fib 61.8%.
Squeeze detection: Measures the distance between 50% and 61.8%. If the band width is ≤ (ATR × multiplier), the zone is flagged as a Squeeze.
Breakout entries (on close):
Long when price crosses up through 50% while squeezed.
Short when price crosses down through 61.8% while squeezed.
Risk framework: Auto-plots stop lines from the signal bar:
Long SL = swing low; Short SL = swing high.
Visuals: Fib lines (50/61.8) + optional yellow zone highlight during squeeze.
Daily Levels (StevenCharts)The Daily Levels (StevenCharts) indicator is a comprehensive, all-in-one tool designed for intraday traders. It automatically plots all critical daily price levels, including the premarket high/low, previous day's high/low/close, and the current day's developing range (HOD/LOD).
What makes this indicator unique is its dynamic Fibonacci range that adapts to the day's price action and its "smart" labeling system that provides contextual clues (like "Swept" vs. "Broken") and combines labels to reduce chart clutter.
Key Features
Dynamic Reversing Fibs: The Fibonacci levels are drawn based on the current day's High-of-Day (HOD) and Low-of-Day (LOD). The range automatically reverses direction based on which extreme (HOD or LOD) was most recently made, providing relevant pullback targets in real-time.
"Golden Zone" Pullback Alert: The script includes a built-in alert that triggers when price makes a new HOD or LOD and then pulls back to touch the "Golden Zone" (defined between the 0.50 and 0.618 levels), signaling a potential continuation setup.
Smart "Swept" vs. "Broken" Logic: Levels like PDH, PDL, PMH, and PML aren't just static lines. The script intelligently labels them as "Swept" if price wicks past them or "Broken" if price closes and holds beyond them, giving you immediate contextual insight.
Clutter-Free "Combination" Labels: To keep your chart clean, the script automatically combines labels. If the day's high is also the premarket high, the label will read "HOD + PMH" instead of two overlapping labels.
Accurate RTH Previous Close: The script specifically requests the "Regular Trading Hours" (RTH) data to plot the official 4 PM EST previous day close (PDC), avoiding inaccuracies from extended hours data.
Full Level Plotting:
Current Day High-of-Day (HOD) & Low-of-Day (LOD)
Premarket High (PMH) & Low (PML) (locked in at 9:30 AM EST)
Previous Day's High (PDH) & Low (PDL)
Previous Day's Official RTH Close (PDC)
How to Use
This indicator provides a complete framework for intraday analysis.
Identify Key Levels: At the start of the session, all key levels (PDH/L, PMH/L, PDC) are clearly plotted, defining the initial areas of potential support and resistance.
Track the Trend: As the day progresses, watch the dynamic Fibs. If the market is making new highs, the Fibs will be drawn from the HOD down, showing pullback zones. If the market is making new lows, the Fibs will be drawn from the LOD up, showing bounce zones.
Use the Alert: The "Golden Zone Touch" alert is the primary trading setup.
For a Long: Wait for a new HOD to be set. The alert will trigger if the price then pulls back to the Golden Zone, offering a potential entry in the direction of the trend.
For a Short: Wait for a new LOD to be set. The alert will trigger if the price then bounces to the Golden Zone, offering a potential entry for a short.
Monitor Level Breaks: Use the "Swept" and "Broken" labels to confirm moves. A "Broken" level suggests a stronger, more decisive move, while a "Swept" level may indicate a stop hunt or liquidity grab.
Settings
The indicator is fully customizable. You can toggle any of the following features on or off to match your trading style:
Show Fibonacci Levels
Show Previous Day High/Low
Show Previous Day Close
Show Premarket High/Low

كلاستر
Detailed Description – Fibonacci Cluster Zones + OB + FVG (AR34)
This script is an advanced multi-layer confluence system developed under the AR34 Trading Framework, designed to identify high-accuracy reversal zones, liquidity imbalances, institutional footprints, and trend direction using a unified analytic engine.
It combines Fibonacci mathematics, Smart Money Concepts, market structure, and smart trend signals to produce precise, reliable trading zones.
⸻
🔶 1 — Fibonacci Retracement Zones + Custom Smart Levels
The script calculates the highest and lowest prices over a selected lookback period to generate key Fibonacci retracement levels:
• 0.236
• 0.382
• 0.500
• 0.618
• 0.786
• 1.000
You can also add up to three custom Fibonacci levels (0.66, 0.707, 0.88 or any value you want).
✔ Each level is drawn as a horizontal line
✔ Optional label display for every level
✔ Color and activation fully customizable
These levels help identify pullback zones and potential turning points.
⸻
🔶 2 — True Fibonacci Cluster Detection
The script automatically identifies Cluster Zones, which occur when:
1. A Fibonacci level
2. An Order Block
3. A Fair Value Gap
all overlap in the same price range.
When all three conditions align, the script prints a CLUSTER marker in yellow.
These zones represent:
• High-probability reversal areas
• Strong institutional footprints
• Highly reactive price levels
⸻
🔶 3 — Automatic Order Block (OB) Detection
The indicator detects Order Blocks based on structural candle behavior:
• Bearish candle → followed by bullish
• Price interacts with a Fibonacci level
• Area aligns with institutional order flow
When detected, the OB is marked for easy visualization.
⸻
🔶 4 — Fair Value Gap (FVG) Mapping
The script scans for liquidity imbalances using the classic FVG logic:
• low > high
When an FVG exists, it draws a green liquidity box.
This highlights:
• Gaps left by institutional moves
• High-value return zones
• Efficient price retracement levels
⸻
🔶 5 — Fibonacci Extension Projections
The script calculates extension targets using:
• 1.272
• 1.618
• 2.000
These are drawn as dashed teal lines and help forecast:
• Breakout continuation targets
• Wave extension objectives
• Take-profit areas
⸻
🔶 6 — Smart Trend Signal (EMA-200 Engine)
Trend direction is determined using the EMA 200:
• Price above EMA → uptrend
• Price below EMA → downtrend
A green or red signal icon appears only when the trend flips, reducing noise and improving clarity.
This helps detect:
• Trend shifts early
• Cleaner entries and exits
• Trend-based filtering
⸻
🔶 7 — Four-EMA Multi-Trend System
The indicator includes optional visualization of four moving averages:
• EMA 20 → Short-term
• EMA 50 → Medium-term
• EMA 100 → Long-term
• EMA 200 → Major trend
All are fully customizable (length + color + visibility).
⸻
🔶 8 — Dynamic Negative Fibonacci Levels (Green Only)
When enabled, the script calculates deep retracement zones using:
• –0.23
• –0.75
• –1.20
These negative Fibonacci levels are drawn in green and help identify:
• Deep liquidity capture points
• Hidden structural supports
• Potential reversal bottoms
⸻
🔶 9 — Complete User Control
Users maintain full control over:
✔ Enabling/disabling OB detection
✔ Enabling/disabling FVG detection
✔ Activating custom Fibonacci levels
✔ Showing or hiding labels
✔ Selecting timeframe for Fib calculations
✔ Adjusting moving average parameters
✔ Activating dynamic Fibonacci
The script is designed to be flexible, scalable, and suitable for any trading style.
⸻
🎯 Summary
This indicator is a powerful all-in-one analytical system that merges:
✔ Fibonacci Mathematics
✔ Smart Money Concepts (OB + FVG)
✔ Trend-based filtering
✔ Institutional cluster detection
✔ Dynamic extensions + retracements
✔ Multi-EMA trend mapping
شرح السكربت بالتفصيل – Fibonacci Cluster Zones + OB + FVG (AR34)
هذا السكربت هو نظام تحليل احترافي متكامل من تطوير AR34 Framework يجمع بين أقوى أدوات التداول الحديثة في مؤشر واحد، ويهدف إلى كشف مناطق الانعكاس القوية، والتجميع الذكي، والاتجاه العام، باستخدام مزيج علمي من فيبوناتشي + السيولة + الاتجاه.
يعمل هذا المؤشر بأسلوب Confluence Trading بحيث يدمج عدة مدارس مختلفة في طبقة واحدة لتحديد مناطق الانعكاس والارتداد والاختراق بدقة عالية.
⸻
🔶 1 — مناطق فيبوناتشي (Retracement) + الكلاستر الذكي
يقوم المؤشر بحساب أعلى وأدنى سعر خلال عدد محدد من الشموع (Retracement Length) ثم يرسم مستويات فيبوناتشي الكلاسيكية:
• 0.236
• 0.382
• 0.500
• 0.618
• 0.786
• 1.000
مع إمكانية إضافة 3 مستويات خاصة من اختيارك (0.66 – 0.707 – 0.88 وغيرها).
✔️ كل مستوى يتم رسمه بخط مستقل
✔️ يظهر بجانبه رقم المستوى إذا تم تفعيل خيار Show Fib Labels
✔️ يمكن تغيير لونه، قيمته، وتفعيله حسب رغبتك
⸻
🔶 2 — كاشف الكلاستر الحقيقي (Cluster Detection)
الكلاستر يُعتبر أقوى مناطق الارتداد في التحليل الفني.
السكربت يحدد الكلاستر عندما تتداخل 3 عناصر مع مستوى فيبوناتشي:
1. مستوى فيبوناتشي مهم
2. Order Block
3. Fair Value Gap
إذا اجتمعت الثلاثة في نفس المنطقة، يتم رسمها باللون الأصفر وتظهر كلمة CLUSTER.
هذا يعطيك:
• أقوى منطقة انعكاس
• أعلى دقة في تحديد نقاط الدخول
• مناطق ذات سيولة مرتفعة
⸻
🔶 3 — دمج Order Blocks تلقائياً
يكتشف المؤشر الـ OB الحقيقي باستخدام شروط حركة الشموع:
• bearish candle → bullish candle
• السعر لمس مستوى فيبوناتشي
• منطقة محتملة لتجميع المؤسسات
إذا تحققت الشروط يظهر OB باللون الأحمر.
⸻
🔶 4 — دمج Fair Value Gaps (FVG)
يكتشف الفجوات السعرية بين الشمعتين الأولى والثالثة:
• low > high
ويقوم برسم بوكس أخضر حول الفجوة (FVG Zone).
يساعدك على معرفة:
• مناطق اختلال السيولة
• أهداف السعر القادمة
• مناطق “العودة” المحتملة
⸻
🔶 5 — امتدادات فيبوناتشي (Fibonacci Extensions)
يقوم بحساب الامتدادات من مستويات:
• 1.272
• 1.618
• 2.0
ويظهرها بخطوط متقطعة (Teal Color).
هذه المستويات مهمة لتوقع:
• أهداف اختراق
• مناطق TP
• امتداد موجات السعر
⸻
🔶 6 — إشارة الاتجاه الذكية (Smart Trend Engine – EMA200)
يعتمد على EMA 200 لتحديد الاتجاه العام:
• إذا السعر فوق EMA200 → اتجاه صاعد
• إذا السعر تحت EMA200 → اتجاه هابط
ويظهر المؤشر:
🟢 سهم أخضر عند تحول الاتجاه لصعود
🔴 سهم أحمر عند تحول الاتجاه لهبوط
ميزة التحول فقط عند تغيير الاتجاه (No Noise).
⸻
🔶 7 — أربع موفنقات احترافية (EMA 20 – 50 – 100 – 200)
المؤشر يعرض الموفنقات الأربعة الأساسية:
• EMA 20 → اتجاه قصير
• EMA 50 → متوسط
• EMA 100 → طويل
• EMA 200 → الاتجاه الرئيسي
مع إمكانية:
• تغيير اللون
• تغيير الطول
• إخفائها وإظهارها
⸻
🔶 8 — فيبوناتشي الديناميكي (Dynamic Green Fib)
ميزة قوية جداً تظهر فقط عند تفعيلها.
تحسب أعلى وأدنى سعر في Lookback Period ثم ترسم مستويات سلبية:
• –0.23
• –0.75
• –1.20
هذه المستويات تظهر كخطوط خضراء تحت السعر وتستخدم لـ:
• تحديد مناطق الانعكاس المخفية
• رصد الدعم الديناميكي
• اكتشاف القيعان المحتملة
⸻
🔶 9 — المرونة الكاملة للمستخدم
المؤشر يسمح لك التحكم بكل شيء:
✔️ تفعيل/إلغاء الـ OB
✔️ تفعيل/إلغاء الـ FVG
✔️ تفعيل/إلغاء مستويات فيبوناتشي
✔️ إضافة مستويات مخصصة
✔️ اختيار الفريم المستخدم
✔️ تغيير الألوان
✔️ التحكم في الاتجاه والموفنقات
⸻
🎯 الخلاصة
هذا السكربت يعمل كنظام تحليلي متكامل يجمع:
✔️ فيبوناتشي
✔️ السيولة المؤسسية (OB + FVG)
✔️ الاتجاه الذكي
✔️ الكلاستر الاحترافي
✔️ الموفنقات
✔️ فيبوناتشي الديناميكي

Auto Fibonacci Retracement (Labeled Swings, Rounded Prices)This tool automatically detects the latest confirmed swing high and swing low on your chart, using a user-settable pivot length. It then plots standard Fibonacci retracement levels between these confirmed pivots, labeling each retracement line with its percentage and rounded price for instant reference. All levels update only on swing confirmation, ensuring strict non-repainting logic and transparency.
How it works
Swing Detection:
Uses Pine Script’s native ta.pivothigh and ta.pivotlow functions to locate swing pivots after full confirmation, reducing noise and false signals.
Fibonacci Calculation:
Once two confirmed swings are found, the script draws standard Fibonacci retracement levels (0%, 23.6%, 38.2%, 50%, 61.8%, 78.6%, 100%) between these anchors. The levels adapt to both uptrends and downtrends, based on swing position.
Customization and Clarity:
Users can choose which retracement levels to display and adjust colors, line thickness, styles, and label sizes for chart clarity. All price labels are rounded for improved visibility.
Non-Repainting:
All levels are plotted only after a swing is confirmed by the market; nothing redraws retroactively.
How To Use It
Add the indicator to any chart and timeframe.
Select your preferred pivot length:
Smaller values yield more frequent swings, larger values wait for major structure.
Toggle each Fibonacci level you wish to see in the settings.
Adjust line and label appearance to fit your style.
Interpret retracement levels as potential support/resistance zones, awareness for pullbacks, and context for trend direction.
Combine the indicator with your technical, price action, or volume analysis to plan entries, stops, and targets.
What Traders Should Look For
Visual retracement map between confirmed swings:
Fib lines auto-update as new swings are confirmed, keeping your chart relevant.
Price reaction at Fib levels:
Watch for reversals, consolidations, or continuations near labeled percentages and prices.
Trend assessment:
Quickly spot whether market structure is showing shallow or deep retracements by the distance between levels.
Confluence:
Use retracement levels along with other indicators or market structure for more robust trade setups.
Key Features
Strict non-repainting logic (confirmed swings only)
Configurable retracement levels: Enable/disable each Fib line.
Rounded price & percentage labels
Visual customization: Colors, thickness, line style, label size
Automatic detection of direction (uptrend/downtrend pivots)
Disclaimer
This indicator is a technical analysis and educational tool. It does not provide buy/sell signals, nor guarantee future price movements. Please use in conjunction with your trading plan and risk management.

ICT Multi-Timeframe Market Structure Tracker [SwissAlgo]ICT Multi-Timeframe Market Structure Tracker
Tracks the ICT market structure across three core timeframes (1-Week, 1-Day, 1-Hour) simultaneously.
----------------------------------------------------------------------
Why this Indicator?
You know market structure matters, whether you trade stocks, Forex, commodities, or crypto.
You've studied ICT concepts - " Change of Character ", " Break of Structure ", " Premium/discount zones ". You understand that multi-timeframe alignment is where the edge lives.
But here's what's probably happening while you apply the ICT concepts for your trading decisions:
You're manually drawing structural highs and lows across three timeframes
You're calculating Fibonacci retracements by hand for each timeframe
You're switching between weekly, daily, and hourly charts, trying to remember where each pivot was, trying to detect the critical events you're waiting for
By the time you've mapped it all out, the setup is gone. Or worse, you missed that the 1-hour just broke the structure while you were checking the weekly bias.
What about seeing all three timeframes at once instead? You need to know immediately when the price enters a premium or discount zone. You need alerts that fire when structure breaks or character changes - across all timeframes - without babysitting your screen.
----------------------------------------------------------------------
The Indicator, at a Glance
This indicator:
tracks ICT market structure across three core timeframes (1-Week, 1-Day, 1-Hour) simultaneously .
automatically plots Fibonacci retracement levels from your defined structural pivots
monitors price position (during retracements) in real-time
sends consolidated alerts when actionable events occur on any timeframe
The 1-Week View: Mid-Term Trend Bias for lower timeframes
The 1-Day View: Swings nested within the 1-Week Structure
The 1-Hour View: Swings nested within the 1-Day Structure
One glance tells you:
* Current trend direction per timeframe
* Exact Fib zone price is trading right now
* Whether the structure just broke or the character changed
* If you're in a potential long/short setup zone
The indicator helps you reduce chart-hopping, manual calculations, and minimize the missed structural shifts.
----------------------------------------------------------------------
Who is this for?
This tool is built for day traders who understand ICT concepts and need efficient multi-timeframe structure tracking. If you know what a Change of Character is, why 0.382-0.5 retracements matter in uptrends, and how to trade external structure, this indicator eliminates the manual structure tracking so you can focus on confirming and executing your trading tactics.
New to ICT? This indicator assumes foundational knowledge of the Inner Circle Trader methodology developed by Michael J. Huddleston. Before using this tool, familiarize yourself with concepts like market structure breaks, premium/discount arrays, and liquidity engineering. The ICT framework offers a unique perspective on institutional order flow and price action - but this indicator is designed for those already applying these concepts, not learning them for the first time.
Critical Skill Required : You must understand the difference between external structure (key swing highs/lows that define market direction) and internal structure (minor fluctuations within the range).
Selecting incorrect pivots - such as marking internal noise instead of true structural points - will generate false signals and undermine the entire analysis. This indicator tracks structure based on YOUR inputs. If those inputs are wrong, every Fibonacci level, alert, and bias signal will be wrong. Learn to identify clean structural breaks before using this tool.
Trading Experience Matters: This tool tracks structure and fires alerts, but interpreting those signals requires understanding context, confluences, and risk management. If you're early in your trading journey, consider this a professional-grade instrument that becomes powerful once you have the conceptual foundation to use it effectively.
----------------------------------------------------------------------
How It Works
Step 1: Define Your Structure
You, the ICT expert or student, define the structural high and low for each timeframe, with their exact dates. This empowers you to control the analysis.
Based on your entries, the indicator establishes trend direction by timeframe and calculates Fibonacci retracement levels automatically.
* Structural High/Low: Key swing points that define external structure per ICT methodology
* Auto-Validation: Built-in autoscan feature confirms your pivot entries match actual price extremes
* Deterministic Behavior: Date stamps ensure the indicator behaves consistently across all sessions
Step 2: Monitor The Tables
Two tables provide a structural context:
Multi-Timeframe Analysis Table (top-right):
Current close, high, low, and 0.5 Fib for all three timeframes
Trend direction (↑/↓)
Days since structure established (i.e., "age" or maturity)
Current Fibonacci zone
Real-time alerts: Trend changes, breakouts, and trade bias signals
Detailed Fibonacci Table (middle-right):
All nine Fib retracement levels (1.0 to 0.0) for the selected timeframe
Exact price at each level
Percentage distance from current price
Visual marker showing current position
Step 3: Monitor The Chart
Visual elements show structure at a glance:
Fibonacci Retracement Zones: Color-coded bands show premium (red), discount (green), and equilibrium (gray) areas based on trend direction
Structural Lines: Red (high) and green (low) horizontal lines mark your defined pivots with automatic fill showing the current range (based on higher timeframe pivots)
Pivot Dots: Optional small markers highlight potential structural turning points on your current timeframe (reference only - always validate pivots yourself)
Trend Indicator: Top-center banner displays the selected timeframe's current trend
Auto-pivot points
Step 4: Get Alerts and Decide the Way Forward
Set one alert on the 1-hour chart only (if you set the alert on other timeframes, you may get delayed feedback).
You'll receive notifications when ANY of these events occur on ANY timeframe:
* Change of Character (ChoC): Trend reversal confirmed by price breaking the opposite structural level
* Break of Structure (BoS): Continuation confirmed by price breaking the same-direction structural level
* Trade Bias Signals: Price entering key Fibonacci zones (0.382-0.5 for longs in uptrend, 0.5-0.618 for shorts in downtrend, with + and ++ variants for deeper retracements)
* Reversal Warnings: Price entering extreme zones (0.882-1.0 or 0.0-0.118), suggesting potential trend exhaustion and reversal towards the opposite direction
All alerts fire once per bar close with a consolidated message showing which timeframes triggered and what conditions were met.
----------------------------------------------------------------------
Understanding the 3 Timeframes Hierarchy
The three timeframes may be conceived as nested layers of structure:
* 1-Week (Macro Bias) : May help you determine your core directional bias (long/short) in a mid-term perspective. The 1-Week TF may operate as your highest-conviction filter and help you contextualize shorter-term market moves (which may align or misalign with the trend appearing on such a timeframe).
* 1-Day (Swing Structure) : Operates within the weekly range. The daily structure can contradict the weekly structure temporarily (due to retracements, consolidations). This is where you may identify intermediate swing opportunities.
* 1-Hour (Execution Structure) : Operates within the daily range. It may help you identify entry timing and short-term bias. Can show opposite trends during retracements, and some traders look for alignment with higher timeframes as part of their setup criteria.
Example: Weekly uptrend (bullish bias) → Daily pulls back into downtrend (retracement phase) → Hourly shows uptrend resumption (this may be interpreted as an entry signal). All three trends can differ simultaneously, but when all three align (in one direction or another), you may start evaluating your moves.
----------------------------------------------------------------------
Using the Tool effectively
When this indicator signals a potential setup (entering key Fibonacci zones, structure breaks, or bias shifts), treat it as a starting point for deeper analysis, not a direct entry signal.
Before executing, consider using additional tools to refine timing:
Fair Value Gaps (FVG) : Identify imbalances where the price moved too quickly, leaving potential fill zones
Order Blocks : Locate the last opposing candle before a strong move - often institutional entry points
Liquidity Zones : Map where stop losses likely cluster (equal highs/lows, round numbers)
Premium/Discount Confirmation: Verify you're buying at a discount or selling at a premium relative to the current range
Session Timing/Kill Zones : Align entries with high-liquidity sessions (London/New York opens)
This indicator shows you where the structure sits and when it shifts. Your job is to combine that context with precise entry models. The alerts narrow your focus to high-probability zones - then you apply your edge within those zones.
----------------------------------------------------------------------
How to Set Up Alerts
This indicator monitors all three timeframes simultaneously and fires consolidated alerts when any condition triggers. Follow these steps to configure alerts properly:
Step 1: Set Your Chart to the 1-Hour Timeframe
Alerts must be created on the 1-hour chart for optimal timing
Do not use higher timeframes (4H, 1D, 1W) or alerts may be delayed
Lower timeframes (15M, 5M) will work but may generate more frequent notifications
Step 2: Open the Alert Menu
Click the "Alert" button (clock icon) in the top toolbar
Or use keyboard shortcut: Alt+A (Windows) / Option+A (Mac)
Step 3: Configure Alert Settings
Condition: Select "ICT Multi-Timeframe Market Structure Tracker "
Alert Type: Choose "Any alert() function call"
Options: Select "Once Per Bar Close"
Expiration: Set to "Open-ended alert" (no expiration)
Alert Name: Choose a descriptive name (e.g., "BTC Market Structure Alerts")
Step 4: Configure Notifications
Notification Methods: Check your preferred channels (app notification, email, webhook, etc.)
Sound: Optional — choose alert sound if desired
Step 5: Create Alert
Click the "Create" button
Alert is now active and will monitor all three timeframes
Important Notes:
You only need ONE alert setup total — it monitors 1W, 1D, and 1H simultaneously
Alert messages show which timeframe(s) triggered and what conditions were met
Alerts fire once per bar close to avoid mid-bar noise
If you change your structural pivot inputs, the alert continues working with new parameters
Example Alert Message:
BTC Market Structure Alert:
🟢 1D Bullish BoS
📈 1H Long Setup (0.382-0.5)
This tells you the 1-Day broke structure bullishly AND the 1-Hour entered a long setup zone — both events happened on the same bar close.
----------------------------------------------------------------------
Key Features
* Tracks 1-Week, 1-Day, and 1-Hour structure simultaneously
* Automatic Fibonacci retracement calculation (9 levels + extensions up or down, depending on timeframe trend)
* Real-time Change of Character and Break of Structure detection
* Color-coded premium/discount zone visualization
* Multi-condition alerts across all timeframes (single alert setup required)
* Autoscan validation to confirm manual pivot entry accuracy
* Timezone-adjustable for global markets
----------------------------------------------------------------------
Important Notes
* Requires ICT Knowledge: This is not a plug-and-play system. Understanding market structure, liquidity concepts, and Fibonacci confluence is essential for effective use.
* Manual Structure Definition: You define the structural pivots. The indicator tracks and alerts - it doesn't make trading decisions.
* Chart Timeframe: Set alerts on the 1-hour chart for optimal timing across all three monitored timeframes.
----------------------------------------------------------------------
Disclaimer
This indicator is for educational and informational purposes only. It does not constitute financial, investment, or trading advice.
The indicator:
* Makes no guarantees about future market performance
* Cannot predict market movements with certainty
* May generate false indications
* Relies on historical patterns that may not repeat
* Should not be used as the sole basis for trading decisions
Users are responsible for:
* Conducting independent research and analysis
* Understanding the risks of trading
* Making their own investment/divestment decisions
* Managing position sizes and risk exposure appropriately
Trading involves substantial risk and may not be suitable for all investors. Past performance does not guarantee future results. Users should only invest what they can afford to lose and consult qualified professionals before making financial decisions. The indicator’s assumptions may be invalidated by changing market conditions.
By using this tool, users acknowledge these limitations and accept full responsibility for their trading decisions.

CNagda Anchor2EntryCNagda Anchor2Entry Pine Script v6 overlay indicator pulls higher-timeframe (HTF) signal events to define anchor high/low levels and then projects visual entry labels on the lower-timeframe (LTF). It also draws auto-oriented Fibonacci retracement/extension levels for context, but it does not execute orders, stops, or targets—only visual guidance.
Inputs
Key inputs include Lookback Length for HTF scanning and a Signal Timeframe used with request.security to import HTF events onto the active chart.
Entry behavior can be set to “Confirm only” or “Wait candle,” trade side can be restricted to Buy/Sell/Both, and individual strategies (Buy WAIT/S1; Sell REV/S1/S2/S3) can be toggled.
HTF logic
The script defines WAIT/BUY setup and confirmation, SELL reversal on breaking the WAIT BUY low, and several volume/candle-based patterns (Sell S1/S2/S3, Buy S1).
It captures the associated highs/lows at those events with ta.valuewhen and imports them via request.security to form anchors (anc_hi/anc_lo) and “new trigger” booleans that gate label creation on the LTF.
Flip entries
When enabled, “Flip entries” generate contrarian labels based on breaking or confirming HTF anchors: crossing above anc_hi can trigger a flip-to-sell label, and crossing below anc_lo can trigger a flip-to-buy label.
The flip mode supports Immediate (on cross) or Confirm (on sustained break) to control how strict the trigger is.
Fibonacci drawing
User-specified Fib levels are parsed from a string, safely converted to floats, and drawn as dotted horizontal lines only when they fall inside an approximate visible viewport. Orientation (up or down) is decided automatically from pending signal direction and a simple context score (candle bias, trend, and price vs. mid), with efficient redraw/clear guards to avoid clutter.
Dynamic anchors
If HTF anchors are missing or too far from current price (checked with an ATR-based threshold), the script falls back to local swing highs/lows to keep the reference range relevant. This dynamic switch helps Fib levels and labels remain close to current market structure without manual intervention.
Signal labels
Labels are created only on confirmed bars to avoid repainting noise, with one “latest” label kept by deleting the previous one. The script places BUY/SELL labels for WAIT/CONFIRM, direct HTF patterns (Buy S1, Sell S1/S2/S3), and contrarian flip events, offset slightly from highs/lows with clear coloring and configurable sizes.
Visual context
Bars are softly colored (lime tint for bullish, orange tint for bearish) for quick context, and everything renders as an overlay on the price chart. Fib labels include a Δ readout (distance from current close), and line extension length, label sizes, and viewport padding are adjustable.
How to use
Set the Signal Timeframe and Lookback Length to establish which HTF structures and ranges will drive the anchors and entry conditions. Choose entry flow (Wait vs Confirm), enable Flip if contrarian triggers are desired, select the trade side, toggle strategies, and customize Fibonacci levels plus dynamic-anchor fallback for practical on-chart guidance.
Notes
This is a visual decision-support tool; it does not place trades, stops, or targets and should be validated on charts before live use. It is written for Pine Script v6 and relies heavily on request.security for HTF-to-LTF transfer of signals and anchors.

Elliott Wave Rule EngineWhat this tool does
The indicator scans price for two concurrent swing structures—a Small (shorter-degree) and a Large (higher-degree) set—then applies an Elliott/NeoWave rule engine to the most recent 5-swing motive (1-2-3-4-5) or 3-swing corrective (A-B-C). It produces:
Blue lines for Small swings and Orange lines for Large swings.
A rule dashboard (optional) showing PASS/FAIL/WARN for core rules & guidelines.
Buy/Sell labels when (a) a valid motive completes and (b) loop “consensus,” alignment, and scoring gates are satisfied.
Reading the chart
Small swings: thin blue segments, built from your Small settings.
Large swings: thicker orange segments, from your Large settings.
Background tint: faint green when a motive (impulse/diagonal) is valid right now on Small.
Labels (if enabled):
“1…5” or “A-B-C” markers on the latest detected structure.
Buy/Sell label at the last pivot when all gates pass; text may include a score %.
How it works
For both Small and Large degrees the script:
- Loops over all (left, right) combinations you specify (e.g., Small Left = 3..6, Right = 0..0) and calls ta.pivothigh/low.
- Aggregates the results:
- Keeps the most extreme pivot found in the loop (highest high or lowest low) that’s newer than the last accepted swing.
- Gates acceptance by minimum % change versus the last opposite swing (inside the loop) and a post-aggregation filter (Small Minimum swing %, Large Minimum swing %).
- Merges back-to-back same-type swings (HH or LL) by keeping only the more extreme one.
- Keeps only the last N=lookbackWaves swings (default 100).
- Consensus (used for signals) comes from the loop counts:
- sBuyConsensus = small L-count / total-combos (bullish bias)
- sSellConsensus = small H-count / total-combos (bearish bias)
(and the same for Large). This is a data-driven “how many combos agreed” measure.
2) Rule engine (Impulse/Diagonal vs. Corrective)
When there are at least 6 Small swings, the engine tests 1-2-3-4-5:
Hard rules (must pass for an Impulse):
- Wave-2 not > 100% of Wave-1 (no retrace beyond start of W1).
- Wave-3 not the shortest among 1,3,5.
- Wave-4 doesn’t overlap Wave-1 (if it does, structure may be a Diagonal).
- Diagonal eligibility: Rules 1 & 2 pass but Rule 3 fails ⇒ eligible as a Diagonal (
Guidelines (7 checks, count toward a threshold you set):
- W2 retraces a Fib level (within ±fibTol).
- W4 retraces a Fib level (within ±fibTol).
- W3 strongest momentum (speed = |Δprice| / bars).
- Alternation: W2 vs W4 have meaningfully different “sharpness” (price per bar), threshold altSlopeThr.
- Proportion (Price): |W1| and |W3| within propTolP× each other.
- Proportion (Time): W1W3 and W2W4 durations within propTolT×.
- W5 weaker than W3 (momentum divergence proxy).
A Motive is valid if:
- Impulse: all 3 hard rules pass and guideline passes ≥ Min guideline passes.
- Diagonal: diagonal-eligible and guideline passes ≥ Min guideline passes.
- if motive fails, the engine still evaluates ABC as Zigzag and Flat to populate the table:
- Zigzag: B shallower than ~0.618A; C ≈ A or 1.618A (±fibTol).
- Flat: B ≥ ~0.9A; expanded flat if B > 1.0A and C in *A; “running” note if C < A.
3) Signal logic (consensus-gated & scored)
Signals fire only on new Small pivots and only if a Small motive just validated:Direction comes from the motive’s W1 (up = bull, down = bear).
Consensus checks (from the loop):
Use Sell consensus if the last pivot is a High, or Buy consensus if it’s a Low.Require it ≥ Min SMALL loop consensus and ahead of the opposite side by at least Min consensus margin.If you also require Large quality: check the corresponding Large consensus ≥ Min LARGE loop consensus.
Alignment: If Require small/large directional alignment is ON, Small and Large directions must match (or the Large motive must be complete).
Score:
- If Large not required: finalScore = smallConsensus × smallQuality.
- If Large required: finalScore = smallConsensus × smallQuality × largeQuality.
- Need finalScore ≥ Min final score.
When all gates pass, you’ll see “Buy xx%” or “Sell xx%” at the pivot.
Inputs (explained):
- Smaller Wave Swing Detection (Looped)
- Small Left Min / Max (default 3..6): ta.pivot* left widths to scan.
- Small Right Min / Max (default 0..0): right widths to scan (0 = earliest confirmation).
- Small Minimum swing % (post-aggregation) (0.3%): filters out tiny swings after the loop.
- Larger Wave Swing Detection (Looped)
- Large Left Min / Max (100..200) and Right Min/Max (0..0): higher-degree scan (defaults are big; adjust for intraday).
- Large Minimum swing % (post-aggregation) (1.5%).
- Loop Filters (inside the loop)
- Small loop min % change (0.20%): a candidate pivot counts only if move vs. last opposite Small swing ≥ this.
- Large loop min % change (1.50%): same idea for Large.
Rule Engine Tolerances
- Fibonacci tolerance (±%) (0.05 = 5%): closeness to Fib levels.
-Same-degree TIME proportion max (x) (2.00×) and PRICE proportion max (x) (3.00×).
- Alternation slope ratio threshold (0.10): higher = stricter alternation.
- Min guideline passes (0–7) (5): threshold for motive validity.
- Signal Probability (Loop Consensus)
- Min SMALL loop consensus (0.60).
- Min LARGE loop consensus (0.50) (used only if Large validation matters).
- Min consensus margin vs opposite (0.10): e.g., 0.60 vs 0.45 fails (margin 0.15 passes).
Require LARGE 1–5 valid (or diagonal) for signal (off by default).
Min final score (0.20): gate on the composite score.
Annotate label with score % (on).
WARN (orange): guideline not met—pattern can still be valid if total passes ≥ Min guideline passes.
FAQ
Q: Why did I get a diagonal instead of an impulse?
A: Wave-4 overlapped Wave-1 (Rule 3). If Rules 1 & 2 pass and guidelines meet your minimum, it’s eligible as a Diagonal.
Q: Where do Buy/Sell labels come from?
A: Only after a valid Small motive at a new pivot, and only if consensus, alignment, and final score gates pass (per your settings).
Q: It “missed” a wave in hindsight.
A: Pivots require right bars to confirm; extremely tight settings can filter that swing; adjust Small min % or ranges.
Q: Are there repaints?
A: No, It uses standard pivot confirmation; until a pivot is confirmed, recent swings can evolve. After confirmation, lines/labels are stable.
Limitations & disclaimers
Elliott/NeoWave rules are heuristics; markets are messy. Treat outputs as structured context, not certainty.
Consensus is pattern-scan agreement, not probability of profit Not investment advice; always couple with risk management.

Support and Resistance levels from Options DataINTRODUCTION
This script is designed to visualize key support and resistance levels derived from options data on TradingView charts. It overlays lines, labels, and boxes to highlight levels such as Put Walls (gamma support), Call Walls (gamma resistance), Gamma Flip points, Vanna levels, and more.
These levels are intended to help traders identify potential areas of price magnetism, reversal, or breakout based on options market dynamics. All calculations and visualizations are based on user-provided data pasted into the input field, as Pine Script cannot directly fetch external options data due to platform limitations (explained below).
For convenience, my website allows users to interact with a bot that will generate the string for up to 30 tickers at once getting nearly real-time data on demand (data is cached for 15min). With the output string pasted into this indicator, it's a bliss to shuffle through your portfolio and see those levels for each ticker.
The script is open-source under TradingView's terms, allowing users to study, modify, and improve it. It draws inspiration from common options-derived metrics like gamma exposure and vanna, which are widely discussed in financial literature. No external code is copied without rights; all logic is original or based on standard mathematical formulas.
How the Options Levels Are Calculated
The levels displayed by this script are not computed within Pine Script itself—instead, they rely on pre-calculated values provided by the user (via a pasted data string). These values are derived from options chain data fetched from financial APIs (e.g., using libraries like yfinance in Python). Here's a step-by-step overview of how these levels are generally calculated externally before being input into the script:
Fetching Options Data:
Historical and current options chain data for a ticker (e.g., strikes, open interest, volume, implied volatility, expirations) is retrieved for near-term expirations (e.g., up to 90 days).
Current stock price is obtained from recent history.
Gamma Support (Put Wall) and Resistance (Call Wall):
Gamma Calculation: For each option, gamma (the rate of change of delta) is computed using the Black-Scholes formula:
gamma = N'(d1) / (S * sigma * sqrt(T))
where S is the stock price, K is the strike, T is time to expiration (in years), sigma is implied volatility, r is the risk-free rate (e.g., 0.0445), and N'(d1) is the normal probability density function.
Weighted gamma is multiplied by open interest and aggregated by strike.
The Put Wall is the strike below the current price with the highest weighted gamma from puts (acting as support).
The Call Wall is the strike above the current price with the highest weighted gamma from calls (acting as resistance).
Short-term versions focus on strikes closer to the money (e.g., within 10-15% of the price).
Gamma Flip Level:
Net dealer gamma exposure (GEX) is calculated across all strikes:
GEX = sum (gamma * OI * 100 * S^2 * sign * decay)
where sign is +1 for calls/-1 for puts, and decay is 1 / sqrt(T).
The flip point is the price where net GEX changes sign (from positive to negative or vice versa), interpolated between strikes.
Vanna Levels:
Vanna (sensitivity of delta to volatility) is calculated:
vanna = -N'(d1) * d2 / sigma
where d2 = d1 - sigma * sqrt(T).
Weighted by open interest, the highest positive and negative vanna strikes are identified.
Other Levels:
S1/R1: Significant strikes with high combined open interest and volume (80% OI + 20% volume), below/above price for support/resistance.
Implied Move: ATM implied volatility scaled by S * sigma * sqrt(d/365) (e.g., for 7 days).
Call/Put Ratio: Total call contracts divided by put contracts (OI + volume).
IV Percentage: Average ATM implied volatility.
Options Activity Level: Average contracts per unique strike, binned into levels (0-4).
Stop Loss: Dynamically set below the lowest support (e.g., Put Wall, Gamma Flip), adjusted by IV (tighter in low IV).
Fib Target: 1.618 extension from Put Wall to Call Wall range.
Previous day levels are stored for comparison (e.g., to detect Call Wall movement >2.5% for alerts).
Effect as Support and Resistance in Technical Trading
Options levels like gamma walls influence price action due to market maker hedging:
Put Wall (Gamma Support): High put gamma below price creates a "magnet" effect—market makers buy stock as price falls, providing support. Traders might look for bounces here as entry points for longs.
Call Wall (Gamma Resistance): High call gamma above price leads to selling pressure from hedging, acting as resistance. Rejections here could signal trims, sells or even shorts.
Gamma Flip: Where gamma exposure flips sign, often a volatility pivot—crossing it can accelerate moves (bullish above, bearish below).
Vanna Levels: Positive/negative vanna indicate volatility sensitivity; crosses may signal regime shifts.
Implied Move: Shows expected range; prices outside suggest overextension.
S1/R1 and Fib Target: Volume/OI clusters act as classic S/R; Fib extensions project upside targets post-breakout.
In trading, these are not guarantees—combine with TA (e.g., volume, trends). High activity levels imply stronger effects; low CP ratio suggests bearish sentiment. Alerts trigger on proximities/crosses for awareness, not advice.
Limitations of the TradingView Platform for Data Pulling
TradingView's Pine Script is sandboxed for security and performance:
No direct internet access or API calls (e.g., can't fetch yfinance data in-script).
Limited to chart data/symbol info; no real-time options chains.
Inputs are static per load; updates require manual pasting.
Caching isn't persistent across sessions.
This prevents dynamic data pulling, ensuring scripts remain lightweight but requiring external tools for fresh data.
Creative Solution for On-Demand Data Pulling
To overcome these limitations, users can use external tools or scripts (e.g., Python-based) to fetch and compute levels on demand. The tool processes tickers, generates a formatted string (e.g., "TICKER:level1,level2,...;TIMESTAMP:unix;"), and users paste it into the script's input. This keeps data fresh without violating platform rules, as computation happens off-platform. For example, run a local script to query APIs and output the string—adaptable for any ticker.
Script Functionality Breakdown
Inputs: Custom data string (parsed for levels/timestamp); toggles for short-term/previous/Vanna/stop loss; style options (colors, transparency).
Parsing: Extracts levels for the chart symbol; gets timestamp for "updated ago" display.
Drawing: Lines/labels for levels; boxes for gamma zones/implied move; clears old elements on updates.
Info Panel: Top-right summary with metrics (CP ratio, IV, distances, activity); emojis for quick status.
Alerts: Conditions for proximities, crosses, bounces (e.g., 0.5% bounce from Put Wall).
Performance: Uses vars for persistence; efficient for real-time.
This script is educational—test thoroughly. Not financial advice; past performance isn't indicative of future results. Feedback welcome via TradingView comments.

Levels & Flow📌 Overview
Levels & Flow is a visual trading tool that combines daily pivot levels with a dynamic EMA ribbon to help traders identify structure, momentum, and key decision zones in the market.
This script is designed for discretionary traders who rely on clean visual cues for intraday and swing trading strategies.
⚙️ Key Features
Daily Pivot, Support, and Resistance Lines
Automatically plots the daily pivot level based on the previous day’s OHLC data, along with calculated support and resistance levels.
Fibonacci Retracement Levels
Two dashed lines above and below the pivot represent the retracement of the pivot-resistance and pivot-support range, forming the boundaries of the “no-trade zone.”
No-Trade Zone (Shaded Box)
A gray shaded box between the two Fibonacci levels to visually mark a high-chop/low-conviction zone.
Trend-Based Candle Coloring (Current Day Only)
Candles are colored green if the close is above the pivot, red if below (only on the current trading day).
Bullish/Bearish Trend Label
A small table in the bottom-right corner displays “Bullish” or “Bearish” depending on whether price is above or below the pivot.
20-EMA Gradient Ribbon
A stack of 20 EMAs, each smoothed and color-coded from blue to green to reflect short- to long-term trend alignment.
Cumulative EMA with Adaptive Weighting
An intelligent moving average line that adjusts weight distribution among the 20 EMAs based on recent predictive accuracy using a learning rate and lookback period.
🧠 How It Works
📍 Levels
The script calculates daily pivot, resistance, and support levels using standard formulas:
Pivot = (High + Low + Close) / 3
Resistance = (2 × Pivot) – Low
Support = (2 × Pivot) – High
These levels update each day and extend 143 bars to the right.
📏 Fib Lines
Fib Up = Pivot + (Resistance – Pivot) × 0.382
Fib Down = Pivot – (Pivot – Support) × 0.382
These lines form the “no-trade zone” box.
📈 EMA Ribbon
20 EMAs starting from the user-defined Base Length, each incremented by 1
Each EMA is smoothed using the Smoothing Period
Color-coded from blue to green for intuitive visual flow
Filled between EMAs to visualize trend strength and alignment
🧠 Cumulative EMA Learning
Each EMA’s historical error is calculated over a Lookback Period
Lower-error EMAs receive higher weight; weights are normalized to sum to 1
The result is a cumulative EMA that adapts based on historical predictive power
🔧 User Inputs
Input
Base EMA Length: Sets the period for the shortest EMA (default: 20)
Smoothing Period: Smooths all EMAs and the cumulative EMA
Lookback for Learning: Number of bars to evaluate EMA prediction accuracy
Learning Rate: Adjusts how quickly weights shift in favor of more accurate EMAs
✅ How to Use It
Use the pivot level to define directional bias.
Watch for price breakouts above resistance or breakdowns below support to consider entry.
Avoid trading inside the shaded zone, where direction is less reliable.
Use the EMA ribbon gradient to confirm short/long alignment.
The cumulative EMA helps define trend with noise reduction.
🧪 Best For
Intraday traders who want to blend structure with flow
Swing traders needing clean daily levels with dynamic confirmation
Anyone looking to avoid choppy zones and improve visual clarity
⚠️ Disclaimer
This script is for educational and informational purposes only. It does not constitute financial advice or a trading recommendation. Always test scripts in simulation or on demo accounts before live use. Use at your own risk.

BooRSI📘 BooRSI – Multi-Dimensional RSI Framework with Advanced Visual Context
BooRSI is not just another RSI overlay. It is a multi-layered momentum framework that blends traditional RSI dynamics with a set of enhanced visual and structural components to help traders identify market imbalances, momentum shifts, and confluence zones across multiple timeframes. The indicator was designed to assist both discretionary and systematic traders in spotting RSI-based inflection points with greater clarity and context.
🔍 What Makes BooRSI Different?
Unlike standard RSI tools, BooRSI provides a modular visualization layer that lets you:
View RSI in both candle format and classic line mode, making intrabar momentum shifts visible.
Plot dynamic or static Fibonacci retracement levels directly on the RSI scale — useful for identifying confluence between RSI pullbacks and trend continuation zones.
Activate a weekly RSI vs weekly RSI MA crossover highlight, enabling long-term trend filters directly within the intraday or daily RSI window.
Apply subtle gradient band fills to the 30–50–70 zones to enhance zone memory without overwhelming the visual space.
Toggle a custom RSI Moving Average for smoother signal interpretation.
🧠 Underlying Logic & Structure
RSI Calculation: Classic RSI with adjustable OHLC input (default: close). When in “Candle Mode,” it uses RSI(Open), RSI(High), RSI(Low), RSI(Close) to form OHLC candles for intrabar detail.
RSI MA Filter: A secondary SMA (default: 14) smooths RSI values to assist in trend determination.
Fibonacci Mapping: Based on a fixed or dynamic length (default: 55), key Fib levels (38.2%, 50%, 61.8%, etc.) are plotted on the RSI window to map out overreaction or pullback zones.
Multi-Timeframe Context: The system calculates weekly RSI and its moving average, then uses background highlights to show whether the current trend aligns with the higher timeframe momentum direction.
⚙️ Default Settings
Parameter Default Description
RSI Length 14 Base RSI period
RSI MA Length 14 SMA on RSI for trend filtering
Fibonacci Lookback 55 Length for Fibo level projections
Show 30/50/70 Bands True Gradient fill zones for RSI decision zones
Show Fibonacci Levels False Optional – static/dynamic Fib lines on RSI
Candle Mode False Switch between RSI line and RSI OHLC candles
Fibo Style Toggle True Switch between solid, dashed or dotted lines
🎯 Best Use Cases
Momentum Filters: For trend-based strategies, use RSI-MA and HTF background for filter alignment.
Reversal Signals: Use RSI candles to spot strong rejection patterns inside extreme zones.
Mean-Reversion Timing: Combine Fibonacci levels with 30–70 bands to fine-tune entries.
⚠️ Important Note
This is a closed-source indicator due to proprietary RSI candle mapping logic and unique Fibonacci interaction methods. However, this description fully discloses how the tool works and how it adds value beyond a basic RSI implementation.
BooRSI – Çok Katmanlı RSI Çerçevesi
BooRSI, klasik RSI göstergesini birden fazla katmanda zenginleştirerek momentum değişimlerini, aşırı alım/aşırı satım bölgelerini ve farklı zaman dilimi trendlerini daha net görmenizi sağlar:
Çubuk ve Çizgi Modu: RSI’yı hem OHLC mumları hem de klasik çizgi olarak gösterebilir, böylece intrabar hareketleri de izlenebilir.
RSI MA Filtreleme: RSI üzerine uygulanan SMA (varsayılan 14) trend yönünü belirlemenize yardımcı olur.
Fibonacci Seviyeleri: RSI ölçeği üzerinde dinamik veya sabit Fibonacci retracement çizgileri (38.2%, 50%, 61.8% vb.) ekleyerek dönüş ve devam bölgelerini tespit eder.
Haftalık Konteks: Günlük veya daha kısa zaman diliminde, haftalık RSI ve haftalık RSI MA kesişimlerini arka plan rengiyle vurgular.
Gradient 30/50/70 Bantları: Karar bölgelerini boğucu olmayan degradelerle öne çıkarır.
Bu kapalı kaynak gösterge, RSI mum haritalama ve Fib etkileşimindeki özgün mantığı nedeniyle gizlidir; açıklama ise nasıl çalıştığını tam olarak ortaya koyar.

Engulfing Candles with Liquidity SweepOverview
The Engulfing Candles with Liquidity Sweep indicator is designed to highlight high- and low-probability engulfing candle patterns, incorporating liquidity sweep logic for enhanced price action analysis. This script visually marks bullish and bearish engulfing events, differentiating between high-probability and low-probability setups, and plots key Fibonacci levels for each event.
🔶 USAGE
This indicator is ideal for traders seeking to identify potential reversal or continuation points based on engulfing candle patterns and liquidity sweeps. High-probability signals are based on strict engulfing and sweep criteria, while low-probability signals offer additional context for nuanced price action.
• High Probability Engulfing:
Highlights strong bullish or bearish engulfing candles that also sweep the previous candle’s high or low, suggesting a significant shift in market sentiment.
• Low Probability Engulfing:
Marks less strict engulfing patterns where the close remains within the previous candle’s range, providing early signals for potential reversals.
• Fibonacci Levels:
For each detected pattern, the script draws a 50% Fibonacci retracement line, helping traders identify potential retracement or reaction zones.
🔹 SETTINGS
• High Probability Engulfing Settings:
• Customizable colors, line styles, and widths for bullish and bearish fib lines
• Option to show/hide fib lines and pattern markers
• Low Probability Engulfing Settings:
• Separate color and style controls for low-probability signals
• Option to show/hide fib lines and pattern markers
• Alerts:
• Built-in alert conditions for all pattern types, enabling automated notifications
🔶 DETAILS
High Probability Bullish Engulfing:
• Previous candle bearish
• Current candle bullish
• Current low sweeps previous low
• Current close above previous high
High Probability Bearish Engulfing:
• Previous candle bullish
• Current candle bearish
• Current high sweeps previous high
• Current close below previous low
Low Probability Bullish Engulfing:
• Previous candle bearish
• Current candle bullish
• Current low sweeps previous low
• Current close between previous open and high
Low Probability Bearish Engulfing:
• Previous candle bullish
• Current candle bearish
• Current high sweeps previous high
• Current close between previous open and low
🔶 NOTES
• The indicator is fully customizable and can be adapted to various trading styles.
• All signals and levels are plotted directly on the chart for easy reference.
• Alerts can be set for any pattern, supporting both discretionary and automated trading approaches.
Disclaimer:This script is for informational and educational purposes only. It does not constitute financial advice. Use at your own risk.

SMC Entry Signals MTF v2📘 User Guide for the SMC Entry Signals MTF v2 Indicator
🎯 Purpose of the Indicator
This indicator is designed to identify reversal entry points based on Smart Money Concepts (SMC) and candlestick confirmation. It’s especially useful for traders who use:
Imbalance zones, order blocks, breaker blocks
Liquidity grabs
Multi-timeframe confirmation (MTF)
📈 How to Use the Signals on the Chart
✅ LONG Signal (green triangle below the candle):
Conditions:
Price is in a discount zone (below the FIB 50% level)
A bullish engulfing candle appears
A bullish Order Block (OB) or Breaker Block is detected
There’s an upward imbalance
A bullish OB is confirmed on the higher timeframe
➡️ How to act:
Consider entering long on the current or next candle.
Place your stop-loss below the OB or the nearest swing low.
Take profit at the nearest liquidity zone or premium area (above FIB 50%).
🔻 SHORT Signal (red triangle above the candle):
Conditions:
Price is in a premium zone (above FIB 50%)
A bearish engulfing candle appears
A bearish OB or Breaker Block is detected
There’s a downward imbalance
A bearish OB is confirmed on the higher timeframe
➡️ How to act:
Consider short entry after the signal.
Place your stop-loss above the OB or swing high.
Target the discount zone or the next liquidity pocket.
⚙️ Recommended Settings by Trading Style
Trading Style Suggested Settings Notes
Intraday (1–15m) fibLookback = 20–50, obLookback = 5–10, htf_tf = 1H/4H Fast signals. Use Discount/Premium + Engulfing.
Swing/Position (1H–1D) fibLookback = 50–100, obLookback = 10–20, htf_tf = 1D/1W Higher trust in MTF confirmation. Ideal with fundamentals.
Scalping (1m) fibLookback = 10–20, obLookback = 3–5, htf_tf = 15m/1H Remove Breaker and MTF for quick reaction trades.
🧠 Best Practices for Traders
Trend Filtering:
Use EMAs or volume to confirm the current trend.
Take longs only in uptrends, shorts in downtrends.
Liquidity Zones:
Use this indicator after liquidity grabs.
OBs and Breakers often appear right after stop hunts.
Combine with Manual Zones:
This works best when paired with manually drawn OBs and key levels.
Backtest the Signals:
Use Bar Replay mode on TradingView to test past signals.
🧪 Example Trade Setup
Example on BTCUSDT 15m:
Price drops into the discount zone.
A green triangle appears (bullish engulfing + OB + imbalance + HTF OB).
You enter long, stop below the OB, target the premium zone.
🎯 This type of setup often gives a risk/reward ratio of 1:2 or better — profitable even with a 40% win rate.
⏰ Alerts & Automation
Enable alerts:
"SMC Long Entry" — fires when a long signal appears.
"SMC Short Entry" — fires when a short signal appears.
You can integrate this with bots via webhook, like:
TradingConnector, 3Commas, Alertatron, etc.
✅ What This Indicator Gives You
High-probability entries using SMC logic
Customizable filters for entry logic
Multi-timeframe confirmation for stronger setups
Suitable for both intraday and swing trading

DTFX Time based range candle box [Wang Indicators]DTFX Time based range candle box
Overview : This indicator highlights HTF Candles in specified timeframe within boxes and extend them until they are mitigated. Allowing traders to use them as zones from which you could find some turn-around or scalp
How does it works ?
Users can setup up to 8 desired timeframe with the hour/minute of the HTF candle
Be carrefull when you chose the time. You must put something coherent with the timeframe (e.g : you can't put 'minutes' = 45 if your timeframe is '1h')
Everyday, the indicator will draw a box around the specified candle for it timeframe
Once the price close above or bellow this candle in the same timeframe, the Zone become "active"
As long as the price doesn't came back into the zone, the retracements will extends
Once the price came back into the zone (in the current timeframe), it stops the expension
Exemple
Here we have those settings :
timeframe : 1 hour
time : 9am
mitigation : 10%
fibs : visible & dashed
The box highlights the 9am 1H candle (9am to 10am)
We now wait for the price to close in the same timeframe (1h here) above or bellow the price
At 11am we close above - the zone is now "active"'
Now we wait for the price to go back in this zone in the current timeframe (here 5min)
12:40am : we put a low above the 10% of the zone -> we stop the retracements, the zone is considered as "mitigated"
Settings
Hour : The hour of the begiging of the candle
Minute : Combined with hour (default 0)
Timeframe : In whichtimeframe we are looking for the candle
% Mitigation : % of the box in wich the price must go back-in in order to "mitigate" the box and stop the expension of the fibs/box (if settings enabled)
Retracements style : Hidden, dashed, dotted or lines for the fibs
Extend Box : extend the box itself until it get mitigated
Number of unmitigated zones : Max unmitigated zone drawed on the chart PER CONFIG
Timezone : Must be set to reflect your needs. (preferably the chart timezone)
How does it helps users ?
Once a Candle is "active" it can be used as a Zone
Fibonnacis levels (30, 50 and 70%) are displayed (if enabled)
Users can customize their apparence and the boxes as they see fit
The 30 - 50 - 70 levels are possible support/resistance that the price tend to bounce of off
You might find some success looking for an entry inside the zone at a level if price gives further confirmations such as a lower time frame flip.

Fibonacci Circle Zones🟩 The Fibonacci Circle Zones indicator is a technical visualization tool, building upon the concept of traditional Fibonacci circles. It provides configurable options for analyzing geometric relationships between price and time, used to identify potential support and resistance zones derived from circle-based projections. The indicator constructs these Fibonacci circles based on two user-selected anchor points (Point A and Point B), which define the foundational price range and time duration for the geometric analysis.
Key features include multiple mathematical Circle Formulas for radius scaling and several options for defining the circle's center point, enabling exploration of complex, non-linear geometric relationships between price and time distinct from traditional linear Fibonacci analysis. Available formulas incorporate various mathematical constants (π, e, φ variants, Silver Ratio) alongside traditional Fibonacci ratios, facilitating investigation into different scaling hypotheses. Furthermore, selecting the Center point relative to the A-B anchors allows these circular time-price patterns to be constructed and analyzed from different geometric perspectives. Analysis can be further tailored through detailed customization of up to 12 Fibonacci levels, including their mathematical values, colors, and visibility..
📚 THEORY and CONCEPT 📚
Fibonacci circles represent an application of Fibonacci principles within technical analysis, extending beyond typical horizontal price levels by incorporating the dimension of time. These geometric constructions traditionally use numerical proportions, often derived from the Fibonacci sequence, to project potential zones of price-time interaction, such as support or resistance. A theoretical understanding of such geometric tools involves considering several core components: the significance of the chosen geometric origin or center point , the mathematical principles governing the proportional scaling of successive radii, and the fundamental calculation considerations (like chart scale adjustments and base radius definitions) that influence the resulting geometry and ensure its accurate representation.
⨀ Circle Center ⨀
The traditional construction methodology for Fibonacci circles begins with the selection of two significant anchor points on the chart, usually representing a key price swing, such as a swing low (Point A) and a subsequent swing high (Point B), or vice versa. This defined segment establishes the primary vector—representing both the price range and the time duration of that specific market move. From these two points, a base distance or radius is derived (this calculation can vary, sometimes using the vertical price distance, the time duration, or the diagonal distance). A center point for the circles is then typically established, often at the midpoint (time and price) between points A and B, or sometimes anchored directly at point B.
Concentric circles are then projected outwards from this center point. The radii of these successive circles are calculated by multiplying the base distance by key Fibonacci ratios and other standard proportions. The underlying concept posits that markets may exhibit harmonic relationships or cyclical behavior that adheres to these proportions, suggesting these expanding geometric zones could highlight areas where future price movements might decelerate, reverse, or find equilibrium, reflecting a potential proportional resonance with the initial defining swing in both price and time.
The Fibonacci Circle Zones indicator enhances traditional Fibonacci circle construction by offering greater analytical depth and flexibility: it addresses the origin point of the circles: instead of being limited to common definitions like the midpoint or endpoint B, this indicator provides a selection of distinct center point calculations relative to the initial A-B swing. The underlying idea is that the geometric source from which harmonic projections emanate might vary depending on the market structure being analyzed. This flexibility allows for experimentation with different center points (derived algorithmically from the A, B, and midpoint coordinates), facilitating exploration of how price interacts with circular zones anchored from various perspectives within the defining swing.
Potential Center Points Setup : This view shows the anchor points A and B , defined by the user, which form the basis of the calculations. The indicator dynamically calculates various potential Center points ( C through N , and X ) based on the A-B structure, representing different geometric origins available for selection in the settings.
Point X holds particular significance as it represents the calculated midpoint (in both time and price) between A and B. This 'X' point corresponds to the default 'Auto' center setting upon initial application of the indicator and aligns with the centering logic used in TradingView's standard Fibonacci Circle tool, offering a familiar starting point.
The other potential center points allow for exploring circles originating from different geometric anchors relative to the A-B structure. While detailing the precise calculation for each is beyond the scope of this overview, they can be broadly categorized: points C through H are derived from relationships primarily within the A-B time/price range, whereas points I through N represent centers projected beyond point B, extrapolating the A-B geometry. Point J, for example, is calculated as a reflection of the A-X midpoint projected beyond B. This variety provides a rich set of options for analyzing circle patterns originating from historical, midpoint, and extrapolated future anchor perspectives.
Default Settings (Center X, FibCircle) : Using the default Center X (calculated midpoint) with the default FibCircle . Although circles begin plotting only after Point B is established, their curvature shows they are geometrically centered on X. This configuration matches the standard TradingView Fib Circle tool, providing a baseline.
Centering on Endpoint B : Using Point B, the user-defined end of the swing, as the Center . This anchors the circular projections directly to the swing's termination point. Unlike centering on the midpoint (X) or start point (A), this focuses the analysis on geometric expansion originating precisely from the conclusion of the measured A-B move.
Projected Center J : Using the projected Point J as the Center . Its position is calculated based on the A-B swing (conceptually, it represents a forward projection related to the A-X midpoint relationship) and is located chronologically beyond Point B. This type of forward projection often allows complete circles to be visualized as price develops into the corresponding time zone.
Time Symmetry Projection (Center L) : Uses the projected Point L as the Center . It is located at the price level of the start point (A), projected forward in time from B by the full duration of the A-B swing . This perspective focuses analysis on temporal symmetry , exploring geometric expansions from a point representing a full time cycle completion anchored back at the swing's origin price level.
⭕ Circle Formula
Beyond the center point , the expansion of the projected circles is determined by the selected Circle Formula . This setting provides different mathematical methods, or scaling options , for scaling the circle radii. Each option applies a distinct mathematical constant or relationship to the base radius derived from the A-B swing, allowing for exploration of various geometric proportions.
eScaled
Mathematical Basis: Scales the radius by Euler's number ( e ≈ 2.718), the base of natural logarithms. This constant appears frequently in processes involving continuous growth or decay.
Enables investigation of market geometry scaled by e , exploring relationships potentially based on natural exponential growth applied to time-price circles, potentially relevant for analyzing phases of accelerating momentum or volatility expansion.
FibCircle
Mathematical Basis: Scales the radius to align with TradingView’s built-in Fibonacci Circle Tool.
Provides a baseline circle size, potentially emulating scaling used in standard drawing tools, serving as a reference point for comparison with other options.
GoldenFib
Mathematical Basis: Scales the radius by the Golden Ratio (φ ≈ 1.618).
Explores the fundamental Golden Ratio proportion, central to Fibonacci analysis, applied directly to circular time-price geometry, potentially highlighting zones reflecting harmonic expansion or retracement patterns often associated with φ.
GoldenContour
Mathematical Basis: Scales the radius by a factor derived from Golden Ratio geometry (√(1 + φ²) / 2 ≈ 0.951). It represents a specific geometric relationship derived from φ.
Allows analysis using proportions linked to the geometry of the Golden Rectangle, scaled to produce circles very close to the initial base radius. This explores structural relationships often associated with natural balance or proportionality observed in Golden Ratio constructions.
SilverRatio
Mathematical Basis: Scales the radius by the Silver Ratio (1 + √2 ≈ 2.414). The Silver Ratio governs relationships in specific regular polygons and recursive sequences.
Allows exploration using the proportions of the Silver Ratio, offering a significant expansion factor based on another fundamental metallic mean for comparison with φ-based methods.
PhiDecay
Mathematical Basis: Scales the radius by φ raised to the power of -φ (φ⁻ᵠ ≈ 0.53). This unique exponentiation explores a less common, non-linear transformation involving φ.
Explores market geometry scaled by this specific phi-derived factor which is significantly less than 1.0, offering a distinct contractile proportion for analysis, potentially relevant for identifying zones related to consolidation phases or decaying momentum.
PhiSquared
Mathematical Basis: Scales the radius by φ squared, normalized by dividing by 3 (φ² / 3 ≈ 0.873).
Enables investigation of patterns related to the φ² relationship (a key Fibonacci extension concept), visualized at a scale just below 1.0 due to normalization. This scaling explores projections commonly associated with significant trend extension targets in linear Fibonacci analysis, adapted here for circular geometry.
PiScaled
Mathematical Basis: Scales the radius by Pi (π ≈ 3.141).
Explores direct scaling by the fundamental circle constant (π), investigating proportions inherent to circular geometry within the market's time-price structure, potentially highlighting areas related to natural market cycles, rotational symmetry, or full-cycle completions.
PlasticNumber
Mathematical Basis: Scales the radius by the Plastic Number (approx 1.3247), the third metallic mean. Like φ and the Silver Ratio, it is the solution to a specific cubic equation and relates to certain geometric forms.
Introduces another distinct fundamental mathematical constant for geometric exploration, comparing market proportions to those potentially governed by the Plastic Number.
SilverFib
Mathematical Basis: Scales the radius by the reciprocal Golden Ratio (1/φ ≈ 0.618).
Explores proportions directly related to the core 0.618 Fibonacci ratio, fundamental within Fibonacci-based geometric analysis, often significant for identifying primary retracement levels or corrective wave structures within a trend.
Unscaled
Mathematical Basis: No scaling applied.
Provides the base circle defined by points A/B and the Center setting without any additional mathematical scaling, serving as a pure geometric reference based on the A-B structure.
🧪 Advanced Calculation Settings
Two advanced settings allow further refinement of the circle calculations: matching the chart's scale and defining how the base radius is calculated from the A-B swing.
The Chart Scale setting ensures geometric accuracy by aligning circle calculations with the chart's vertical axis display. Price charts can use either a standard (linear) or logarithmic scale, where vertical distances represent price changes differently. The setting offers two options:
Standard : Select this option when the price chart's vertical axis is set to a standard linear scale.
Logarithmic : It is necessary to select this option if the price chart's vertical axis is set to a logarithmic scale. Doing so ensures the indicator adjusts its calculations to maintain correct geometric proportions relative to the visual price action on the log-scaled chart.
The Radius Calc setting determines how the fundamental base radius is derived from the A-B swing, offering two primary options:
Auto : This is the default setting and represents the traditional method for radius calculation. This method bases the radius calculation on the vertical price range of the A-B swing, focusing the geometry on the price amplitude.
Geometric : This setting provides an alternative calculation method, determining the base radius from the diagonal distance between Point A and Point B. It considers both the price change and the time duration relative to the chart's aspect ratio, defining the radius based on the overall magnitude of the A-B price-time vector.
This choice allows the resulting circle geometry to be based either purely on the swing's vertical price range ( Auto ) or on its combined price-time movement ( Geometric ).
🖼️ CHART EXAMPLES 🖼️
Default Behavior (X Center, FibCircle Formula) : This configuration uses the midpoint ( Center X) and the FibCircle scaling Formula , representing the indicator's effective default setup when 'Auto' is selected for both options initially. This is designed to match the output of the standard TradingView Fibonacci Circle drawing tool.
Center B with Unscaled Formula : This example shows the indicator applied to an uptrend with the Center set to Point B and the Circle Formula set to Unscaled . This configuration projects the defined levels (0.236, 0.382, etc.) as arcs originating directly from the swing's termination point (B) without applying any additional mathematical scaling from the formulas.
Visualization with Projected Center J : Here, circles are centered on the projected point J, calculated from the A-B structure but located forward in time from point B. Notice how using this forward-projected origin allows complete inner circles to be drawn once price action develops into that zone, providing a distinct visual representation of the expanding geometric field compared to using earlier anchor points. ( Unscaled formula used in this example).
PhiSquared Scaling from Endpoint B : The PhiSquared scaling Formula applied from the user-defined swing endpoint (Point B). Radii expand based on a normalized relationship with φ² (the square of the Golden Ratio), creating a unique geometric structure and spacing between the circle levels compared to other formulas like Unscaled or GoldenFib .
Centering on Swing Origin (Point A) : Illustrates using Point A, the user-defined start of the swing, as the circle Center . Note the significantly larger scale and wider spacing of the resulting circles. This difference occurs because centering on the swing's origin (A) typically leads to a larger base radius calculation compared to using the midpoint (X) or endpoint (B). ( Unscaled formula used).
Center Point D : Point D, dynamically calculated from the A-B swing, is used as the origin ( Center =D). It is specifically located at the price level of the swing's start point (A) occurring precisely at the time coordinate of the swing's end point (B). This offers a unique perspective, anchoring the geometric expansion to the initial price level at the exact moment the defining swing concludes. ( Unscaled formula shown).
Center Point G : Point G, also dynamically calculated from the A-B swing, is used as the origin ( Center =G). It is located at the price level of the swing's endpoint (B) occurring at the time coordinate of the start point (A). This provides the complementary perspective to Point D, anchoring the geometric expansion to the final price level achieved but originating from the moment the swing began . As observed in the example, using Point G typically results in very wide circle projections due to its position relative to the core A-B action. ( Unscaled formula shown).
Center Point I: Half-Duration Projection : Using the dynamically calculated Point I as the Center . Located at Point B's price level but projected forward in time by half the A-B swing duration , Point I's calculated time coordinate often falls outside the initially visible chart area. As the chart progresses, this origin point will appear, revealing large, sweeping arcs representing geometric expansions based on a half-cycle temporal projection from the swing's endpoint price. ( Unscaled formula shown).
Center Point M : Point M, also dynamically calculated from the A-B swing, serves as the origin ( Center =M). It combines the midpoint price level (derived from X) with a time coordinate projected forward from Point B by the full duration of the A-B swing . This perspective anchors the geometric expansion to the swing's balance price level but originates from the completion point of a full temporal cycle relative to the A-B move. Like other projected centers, using M allows for complete circles to be visualized as price progresses into its time zone. ( SilverFib formula shown).
Geometric Validation & Functionality : Comparing the indicator (red lines), using its default settings ( Center X, FibCircle Formula ), against TradingView's standard Fib Circle tool (green lines/white background). The precise alignment, particularly visible at the 1.50 and 2.00 levels shown, validates the core geometry calculation.
🛠️ CONFIGURATION AND SETTINGS 🛠️
The Fibonacci Circle Zones indicator offers a range of configurable settings to tailor its functionality and visual representation. These options allow customization of the circle origin, scaling method, level visibility, visual appearance, and input points.
Center and Formula
Settings for selecting the circle origin and scaling method.
Center : Dropdown menu to select the origin point for the circles.
Auto : Automatically uses point X (the calculated midpoint between A and B).
Selectable points including start/end (A, B), midpoint (X), plus various points derived from or projected beyond the A-B swing (C-N).
Circle Formula : Dropdown menu to select the mathematical method for scaling circle radii.
Auto : Automatically selects a default formula ('FibCircle' if Center is 'X', 'Unscaled' otherwise).
Includes standard Fibonacci scaling ( FibCircle, GoldenFib ), other mathematical constants ( PiScaled, eScaled ), metallic means ( SilverRatio ), phi transformations ( PhiDecay, PhiSquared ), and others.
Fib Levels
Configuration options for the 12 individual Fibonacci levels.
Advanced Settings
Settings related to core calculation methods.
Radius Calc : Defines how the base radius is calculated (e.g., 'Auto' for vertical price range, 'Geometric' for diagonal price-time distance).
Chart Scale : Aligns circle calculations with the chart's vertical axis setting ('Standard' or 'Logarithmic') for accurate visual proportions.
Visual Settings
Settings controlling the visual display of the indicator elements.
Plots : Dropdown controlling which parts of the calculated circles are displayed ( Upper , All , or Lower ).
Labels : Dropdown controlling the display of the numerical level value labels ( All , Left , Right , or None ).
Setup : Dropdown controlling the visibility of the initial setup graphics ( Show or Hide ).
Info : Dropdown controlling the visibility of the small information table ( Show or Hide ).
Text Size : Adjusts the font size for all text elements displayed by the indicator (Value ranges from 0 to 36).
Line Width : Adjusts the width of the circle plots (1-10).
Time/Price
Inputs for the anchor points defining the base swing.
These settings define the start (Point A) and end (Point B) of the price swing used for all calculations.
Point A (Time, Price) : Input fields for the exact time coordinate and price level of the swing's starting point (A).
Point B (Time, Price) : Input fields for the exact time coordinate and price level of the swing's ending point (B).
Interactive Adjustment : Points A and B can typically be adjusted directly by clicking and dragging their markers on the chart (if 'Setup' is set to 'Show'). Changes update settings automatically.
📝 NOTES 📝
Fibonacci circles begin plotting only once the time corresponding to Point B has passed and is confirmed on the chart. While potential center locations might be visible earlier (as shown in the setup graphic), the final circle calculations require the complete geometry of the A-B swing. This approach ensures that as new price bars form, the circles are accurately rendered based on the finalized A-B relationship and the chosen center and scaling.
The indicator's calculations are anchored to user-defined start (A) and end (B) points on the chart. When switching between charts with significantly different price scales (e.g., from an index at 5,000 to a crypto asset at $0.50), it is typically necessary to adjust these anchor points to ensure the circle elements are correctly positioned and scaled.
⚠️ DISCLAIMER ⚠️
The Fibonacci Circle Zones indicator is a visual analysis tool designed to illustrate Fibonacci relationships through geometric constructions incorporating curved lines, providing a structured framework for identifying potential areas of price interaction. Like all technical and visual indicators, these visual representations may visually align with key price zones in hindsight, reflecting observed price dynamics. It is not intended as a predictive or standalone trading signal indicator.
The indicator calculates levels and projections using user-defined anchor points and Fibonacci ratios. While it aims to align with TradingView’s standard Fibonacci circle tool by employing mathematical and geometric formulas, no guarantee is made that its calculations are identical to TradingView's proprietary methods.
🧠 BEYOND THE CODE 🧠
The Fibonacci Circle Zones indicator, like other xxattaxx indicators , is designed with education and community collaboration in mind. Its open-source nature encourages exploration, experimentation, and the development of new Fibonacci and grid calculation indicators and tools. We hope this indicator serves as a framework and a starting point for future Innovation and discussions.

OnChart - SuiteThe Motivation Behind OnChart Suite
In the dynamic world of trading, the ability to interpret market trends and make timely decisions is paramount. OnChart Suite was developed to empower traders by offering a comprehensive suite of tools that combine advanced analysis with intuitive user experience. The goal is to support traders in navigating complex market environments, helping them refine their strategies and gain a deeper understanding of price movements.
█ Key Features
🤖 ApexAlphaClouds: Identifies potential price rejections or breakthroughs by analyzing dynamic price ranges.
🔢 Matrix Algo: Offers multi-timeframe trend sentiment analysis using key market indicators.
🎯 CandleSniper: Detects key decision points based on phase calculation and Fibonacci levels.
🧲 MagnetZone Horizon: Highlights strategic price zones that can act as smart FVGs.
🟢 NeonZenith: Combines trend analysis with decision points and Fibonacci targets.
█ How These Tools Work Together
OnChart Suite integrates each of these powerful tools to provide traders with a comprehensive analysis framework. By combining the ApexAlphaClouds for price movement intuition, the Matrix Algo for trend sentiment, the CandleSniper for decision points, the MagnetZone Horizon for strategic price zones, and the NeonZenith for trend and target analysis, traders can develop robust trading strategies. This integration ensures that traders have access to multiple perspectives on market conditions, enhancing their ability to make calculated decisions.
█ Detailed Feature Explanations:
--------------🤖 ApexAlphaClouds --------------
How the Tool Can Help Traders
The `ApexAlphaClouds` indicator is designed to assist traders by identifying dynamic price ranges where the market tends to consolidate, which are critical for making informed trading decisions. The tool uses an ML algorithm to analyze high-price data over a set period and determines key levels on the chart, which are visualized as "clouds." These clouds represent potential support and resistance areas, where price action is likely to pause, reverse, or experience increased volatility.
The primary benefit for traders is the ability to identify these key zones in real-time, allowing them to anticipate potential market movements and plan trades accordingly. For example, if a trader sees that price is approaching a cloud boundary, they might expect a reversal or a breakout, depending on the broader market context. This can be particularly useful in range-bound markets or when looking for potential entry and exit points in trending markets.
How Traders Can Use the Indicator
Identifying Support and Resistance:
The clouds plotted by the `ApexAlphaClouds` indicator can be used to identify dynamic support and resistance levels. Traders can watch how the price reacts when it enters these clouds. If the price bounces off a lower cloud, it may suggest support, while a rejection from an upper could indicate resistance.
Trend Reversals and Continuations:
The indicator's middle cloud can help identify potential trend reversals. If price moves through the middle cloud and continues in the same direction, it could indicate a trend continuation. Conversely, if price reverses within the middle cloud, it might signal a potential trend reversal.
Volatility and Breakouts:
The distance between the upper and lower clouds can give traders an idea of market volatility. Narrow clouds suggest low volatility, which may precede a breakout, while wide clouds indicate higher volatility, where prices might oscillate within the range.
Settings Input and Their Effects
’ApexAlphaClouds` (Toggle) -This setting allows the trader to enable or disable the `ApexAlphaClouds` indicator on their chart.
Effect: When enabled, the clouds representing dynamic price ranges will be displayed on the chart. Disabling this will hide the indicator’s outputs.
Target Area Size - This setting determines the number of bars (length) the algorithm considers when collecting high prices for clustering.
Effect: A larger value will make the indicator consider a broader historical range, potentially smoothing out the clouds and identifying longer-term price ranges. A smaller value will focus on more recent price action, which might be useful for short-term trading strategies.
Accuracy - This setting specifies the number of groups that the algorithm will try to identify within the selected data range.
Effect: A higher value increases the number of identified clusters, making the indicator more sensitive to minor fluctuations in price. This can be useful for traders looking to identify multiple potential reversal points. A lower value will focus on the most prominent price clusters, which may be more relevant for long-term analysis.
Maximum Calibration - This setting controls the maximum number of iterations the machine learning algorithm will perform to find the optimal clusters.
Effect: Increasing allows the algorithm more time to refine the clusters, potentially leading to more accurate and stable clouds. However, it may also increase the computation time. Decreasing this value may speed up the process but could result in less accurate clustering.
Wide Range Calibration - This setting determines the maximum number of bars the algorithm will consider when applying the clustering.
Effect: A larger value allows the algorithm to analyse a wider range of historical data, which can help identify significant long-term price ranges. A smaller value will limit the analysis to more recent data, which might be preferable for traders focused on short-term movements.
Smoothing Factor - This setting applies a smoothing function to the clouds, reducing noise and making the price ranges more visually consistent.
Effect :A higher smoothing factor will produce smoother, more consistent clouds, which might be beneficial in volatile markets to avoid false signals. A lower smoothing factor will make the clouds more responsive to recent price changes, which could be useful for scalping or short-term trading strategies.
Usage Scenarios
Scalping:
Traders using short-term strategies might set Accuracy to a smaller value and reduce the Smoothing Factor to make the clouds more responsive to recent price action. This helps in identifying quick reversal points.
Swing Trading:
Swing traders could use a larger Target Area Size and increase Accuracy to identify key price ranges that have held over longer periods. Adjusting Wide Range Calibration to a higher value allows them to consider broader historical trends.
Trend Following:
By observing how price interacts with the clouds, trend-following traders can look for breakouts or breakdowns from the clouds to confirm entry points in the direction of the trend.
Volatility Management:
Traders can monitor the width of the clouds to gauge market volatility and adjust their strategies accordingly, tightening stops in narrow cloud ranges or widening them in broader ranges.
Conclusion
The `ApexAlphaClouds` indicator is a powerful tool for traders looking to analyze price action with a focus on dynamic price ranges. By understanding and utilizing the settings, traders can customize the indicator to fit their specific trading strategies, whether they are scalping, swing trading, or trend following. The key is to adjust the inputs based on the market context and trading goals, using the clouds as a visual guide to anticipate market movements and make informed decisions.
--------------🔢 Matrix Algo --------------
Matrix Algo is a multi-timeframe (MTF) tool designed to provide traders with a comprehensive view of market conditions across different timeframes using a combination of popular technical indicators. The indicator aggregates data from RSI, MACD, and Bollinger Bands across multiple timeframes, presenting this information in a matrix format to help traders make informed decisions based on a complete market overview. This allows traders to quickly assess the overall market sentiment and trend direction without having to manually check each indicator on different timeframes. By offering a bird’s-eye view of the market conditions.
How Traders Can Use Matrix Algo?
Identify Trends and Reversals: By analysing the matrix, traders can identify whether the market is bullish, bearish, or in consolidation across different timeframes.
Confirm Signals: The Matrix Algo can confirm signals from other trading strategies by providing additional context from multiple indicators across several timeframes.
Settings:
Toggle individual timeframes - (Monthly, Weekly, 3D, Daily, 4h, etc.) to include or exclude from the matrix.
Effect: The matrix displays whether the market conditions are favorable (green) or unfavorable (red) for each indicator and timeframe combination. This color-coded information helps traders quickly assess the market situation.
--------------🎯 CandleSniper --------------
Overview:
The CandleSniper indicator is designed to identify potential turning points in the market by combining various technical analysis tools. It leverages a combination of the MACD indicator, advanced phase analysis technique, and Fibonacci levels to highlight moments where price action may be reversing. This helps traders spot divergence opportunities and set potential target levels.
Explanation
MACD Divergence with Phase Analysis:
The indicator leverages the MACD (Moving Average Convergence Divergence) to identify divergences, which can indicate potential reversal points in the market. The MACD is computed using standard short and long lengths, along with a signal line.
An advanced phase analysis technique is employed to measure the difference between price and its moving averages, enabling the identification of cyclical turning points in the market
A potential bullish decision point is identified when the MACD line crosses above the signal line during a cyclical turning point. Conversely, a potential bearish decision point is identified when the MACD line crosses below the signal line during a cyclical turning point.
Fibonacci Levels for Targeting:
The indicator calculates Fibonacci extension levels based on recent price swings to provide target levels for potential price movements.
For a bullish setup, the indicator identifies levels above the current price as potential targets, while for a bearish setup, it identifies levels below the current price.
Fib Filter Line:
The Fib Filter Line is represented in purple for bullish turning points and white for bearish turning points. These lines serve as additional filters to help traders identify stronger, more reliable turning points in the market. Designed for those who prefer a more conservative approach, the Fib Filter Line offers an extra layer of confirmation based on price movements, allowing traders to filter out weaker signals and focus on more significant market shifts.
Inputs and Settings:
lookbackPeriod: Defines the period over which the indicator looks back to calculate the Fibonacci levels. Adjusting this setting can change the sensitivity of the decision points.
Dimmer and DimmerPeriod: These settings control the smoothing applied to the price data before the phase calculation. They help in reducing noise and ensuring that only significant price movements are considered for decision points.
How to Use:
Traders can use the CandleSniper indicator to identify potential decision points by observing the color changes on the bars and the plotted Fibonacci levels:
🟢 Bullish Decision Points:
When the indicator detects a bullish divergence, it highlights the bars in purple and plots potential upward Fibonacci levels as targets.
🔴 Bearish Decision Points:
When a bearish divergence is detected, the indicator highlights the bars in white and plots downward Fibonacci levels as targets.
These decision points can help traders identify when the market might be ready for a reversal or continuation or even use as a start point from where the trader can start his own analysis
Combining with Other Tools
The CandleSniper indicator can be combined with other OnChart tools to create a comprehensive trading framework:
🔢 Matrix Algo:
Use Matrix Algo to assess the overall market sentiment across multiple timeframes, then apply CandleSniper for pinpointing specific entry or exit points.
🤖 ApexAlphaClouds:
Overlay ApexAlphaClouds to visualise dynamic price ranges, using CandleSniper to identify decision points within these ranges.
This combination allows traders to develop a robust trading strategy that considers broader market trends and specific price action signal intuition.
--------------🧲 MagnetZone Horizon --------------
Overview:
The MagnetZone Horizon indicator is a specialized tool designed to identify potential gaps between two significant changes in the Average True Range (ATR). These gaps, calculated dynamically, serve as areas where the price might react, often acting as smart Fair Value Gaps (FVG). By highlighting these zones, traders can gain insights into where the market might find support, resistance, or potential reversal points.
How Traders Can Use This Indicator:
Identifying Smart Fair Value Gaps:
The MagnetZone Horizon indicator helps traders locate gaps between ATR shifts that are likely to act as significant decision points. These gaps can indicate areas where price corrections or consolidations might occur, providing opportunities for strategic entries or exits.
Adaptive Support and Resistance:
The levels calculated by the indicator adjust according to market volatility, offering dynamic support and resistance zones. These zones are particularly useful in identifying potential reversals or continuation patterns.
Volatility-Based Trading:
Since the indicator bases its calculations on ATR, it inherently adjusts to market conditions, allowing traders to align their strategies with the current level of volatility. This adaptability makes it suitable for both trending and range-bound markets.
Settings and Their Impact:
MagnetZone Horizon (Enable/Disable): This toggle allows traders to activate or deactivate the visualization of the MagnetZone Horizon on their charts.
Factor: This setting multiplies the ATR to scale the detected gaps. A higher factor results in broader zones, which might capture more significant market movements, while a lower factor creates tighter zones for more precise analysis.
Factor=5
Factor=7
Division: This setting works in conjunction with the Factor to further refine the gap calculations. Adjusting the Division setting allows traders to fine-tune how sensitive the indicator is to ATR changes, which can help in pinpointing more precise smart FVGs.
Use Cases:
Gap Trading:
Traders can use the identified gaps as potential areas to enter or exit trades, particularly if the price approaches these smart FVGs. The idea is to capitalize on the likelihood that the market will react to these gaps.
Reversal Identification:
The zones marked by the MagnetZone Horizon can indicate potential reversal points, especially in volatile markets where significant ATR changes suggest a shift in market sentiment.
Trend Continuation or Rejection:
By monitoring how the price interacts with these dynamically calculated zones, traders can assess whether a trend is likely to continue or reverse, aiding in more informed trading decisions.
The MagnetZone Horizon indicator is particularly useful for traders looking to identify significant gaps in market activity that are influenced by volatility. These smart FVGs provide a deeper understanding of where the market might react, offering a valuable tool for enhancing trading strategies and adds another strategic piece to the puzzle in the OnChart Suite.
--------------🟢NeonZenith Indicator--------------
Overview:
NeonZenith is a tool designed to provide traders with a better understanding of market trends and potential decision points by utilising multiple elements, including EMAs and Fibonacci levels. This indicator identifies key structures in recent price movements, helping traders recognize potential trend shifts and generate target levels for their trading strategies. Additionally, NeonZenith incorporates elements from the ApexAlphaCloud to enhance the interpretation of market sentiment, particularly regarding price rejections or breakthroughs.
Key Features:
Trend Direction Identification:
NeonZenith uses EMAs to help traders gauge the overall trend direction. By analysing the relationship between different EMAs, the tool highlights potential points where trends may strengthen or reverse, offering decision points for traders to consider in their strategies.
Decision Points:
The tool generates decision points based on EMA interactions, providing traders with crucial levels that may indicate potential market entries or exits. These decision points are derived from the intersection of EMAs, which are known for their reliability in identifying trend shifts.
Fibonacci Target Levels:
Based on the identified price structures, NeonZenith calculates Fibonacci levels that serve as potential target areas. These levels help traders set realistic goals for their trades, whether they are looking to take profits or manage risks effectively.
ApexAlphaCloud Integration:
The tool integrates a middle cloud from the ApexAlphaCloud, which helps traders anticipate potential price rejections or breakthroughs. This cloud provides additional context to the trend analysis, enhancing traders' ability to gauge the market's sentiment and make them think about potential price movements.
Settings:
Left and Right Border Width:
These settings control the lookback period for identifying significant price structures. By adjusting these parameters, traders can fine-tune the sensitivity of the indicator to recent price movements.
Fibonacci Calculation:
The tool calculates Fibonacci levels based on recent lows and highs, offering multiple targets for both long and short positions. These targets include various levels that traders can use to plan their entry, take-profit, and stop-loss orders.
Plotting and Visualization:
NeonZenith provides clear visual cues on the chart, including shapes and labels to mark significant decision points and target areas. These visual elements help traders quickly interpret the information provided by the indicator and apply it to their trading strategies.
How to Use NeonZenith:
Trend Identification:
Use the tool to identify the current trend direction by observing the interaction between the EMAs ,the flag sign and triangle, flag represent general trend changes and the triangle represents minor and inside trend changes.
Fibonacci Levels:
Use the generated Fibonacci levels to set target areas for your trades. These levels can guide you in deciding where to take profits or place stop-loss orders.
Sentiment Gauge:
Utilise the middle cloud from the ApexAlphaCloud to assess potential price rejections or breakthroughs. This feature provides additional insight into the strength of the current trend and helps you anticipate possible market reversals.
Conclusion:
NeonZenith is a versatile and simple tool designed to support traders in understanding market trends, identifying decision points, and setting realistic targets based on Fibonacci levels. Its integration with the ApexAlphaCloud enhances the tool's ability to provide a comprehensive view of market sentiment, making it a valuable addition to any trader's toolkit.
