Fibonacci Time PeriodsThe " Fibonacci Time Periods " indicator uses power exponents of the constant Phi based on your custom time period to generate Fibonacci sequence-based progression on a given chart. This tool can help to anticipate the timing of potential turning points by highlighting Fib time zones where significant price movements may occur.
It is different from other alternatives specifically for the ability to alter the rate of progression .
Most famous regular Fib sequence expands with 1.618^(n+1) rate which produces vast change just after few iterations.
Those ever-expanding big intervals don't allow us to cover the smaller details of the chart which we might find crucial. So, the idea was born to break down the constant Phi to a self-fraction using power exponents. In other words, reducing rate of progression to make the expansion more gradual without losing properties of Fibonacci proportions.
Default settings have a rate of 0.25 which is basically Phi^1/4
That means we expect 4x more lines than in regular sequence to cover missing bits owing to formula: 1.618^(0.25*(n+1))
(Line 0.618 is added to enhance visual orientation and perception of proportions)
How it works:
Exponential rate of progression
First, it works out the difference between your custom start (0) and end (1) period
The result is multiplied by 1.618^rate to get the step
Rest lines are created by iterations. For instance, with default rate of 0.25, the 1st generated line = start + (End-Start)*1.618^0.25* 1 , second line = start + (End-Start)*1.618^0.25* 2 , etc.
If we change the rate to 1 it will produce the regular fib sequence with 1.618^(n+1) rate
Fixed rate of progression:
In this mode, when rate is 0.25, it grows exactly with exponent step of 0.25 so first, second, third, etc generated lines also have the fixed exponent of 0.25. The distance between lines do not expand.
How to use:
Set the start and end dates
Choose the type of progression
Choose your desired rate of progression
Customize the colors to match your chart preferences.
Observe the generated Fibonacci time intervals and use them to identify potential market movements and reactions.
Cari dalam skrip untuk "fib"
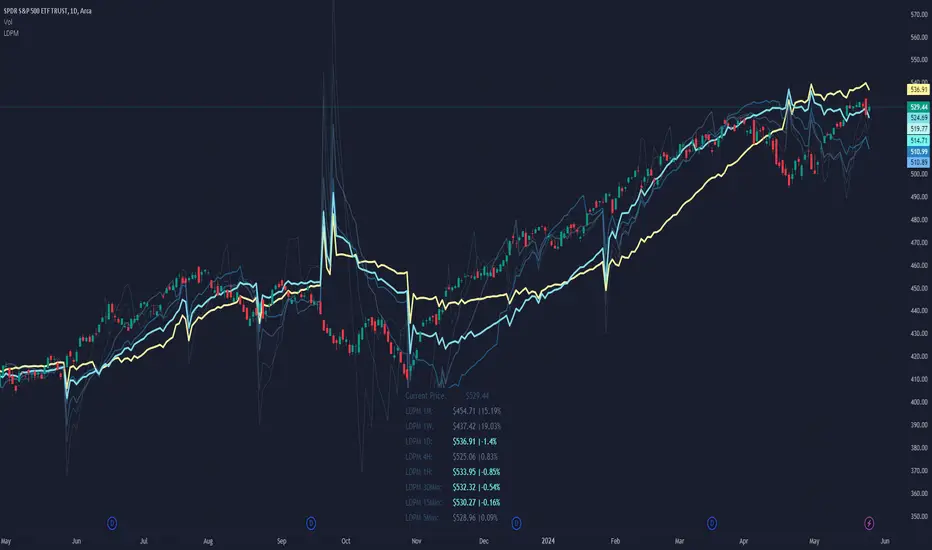
Liquidity Dependent Price Movement AlgorithmLiquidity-Dependent Price Movement (LDPM) is a metric designed to directly measure liquidity on a equity in real time, and to translate those measurements into signals to provide insights into where the anticipate price-direction is headed.
Liquidity can be characterized as a way of measuring how smoothly things are running in the market. When things are running smoothly – such as when there is good agreement as to the price of an asset, then things are considered liquid. Conversely, when things are not running smoothly, just as when the bid or the ask do not agree with each other, then things are considered not liquid. These different states have different outcome liklihoods.
In a liquid environment, a stock can trade a lot of shares without moving the price. On the other hand, when a stock is not liquid, even small volumes can move the price substantially.
It is therefore helpful to know when a stock is liquid to the upside or to the downside, or even, when a stock is not liquid to the upside or the downside. These data have statistical associations with future price movement and volatility.
The use of LDPM is straightforward:
If the price is above LDPM: bullish outlooks.
If the price is below LDPM: bearish outlooks.
There are a few key differences about LDPM as compared to other indicators, namely that timeframe matters . That means, LDPM will tailor its output to the timeframe selected. The advantage of this is that it allows LDPM to be "tailored" to the specific timeframe as desired, without having to do any conversions or adaptations mentally.
Key Settings and Configurations:
Setting - Smoothing Type of LDPM :
Default: KF.
LDPM can be smoothened if desired. There are 5 different types of smoothing available:
EMA : Exponential Smoothing
SMA : Simple Smoothing
WMA : Weighted Smoothing
RMA : Modified Smoothing
KF : Kellman Smoothing
The default is "KF" for Kellman Smoothing.
Setting - Include LDPM-Granular :
Default: Off.
LDPM-Granular is the more "raw" form of LDPM that displays the candle-specific result, rather than the smoothened result. This can be toggled on or off, if desired. LDPM granular is helpful for looking at candle-specific
Setting - Place LDPM Standard :
Default: Off.
An additional, single, LDPM line can be placed via this toggle. Settings for this LDPM can be configured directly below toggle.
Setting - Place LDPM-Fib :
Default: On.
LDPM-Fib is a default setting for displaying 5 LDPMs (LDPM-13, LDPM-21, LDPM-34, LDPM-55, and LDPM-89) whose lookbacks are spaced via the Fib sequence. Useful for those who enjoy a static relationship between the different "layers" of LDPM.
Setting - Place LDPM-Reference :
Default: Off.
Since LDPM is time-interval dependent, there may be times when a higher-order timeframe is desired to act as a reference. For instance, suppose you want to go long if the 1-Hour LDPM experiences a bullish crossover, but you want to scalp shorts on the 15-minute timeframe until then. Then you could place the chart on the 15-minute interval for your scalping, and then place a 1-Hour reference LDPM that will show you when the 1-Hour LDPM and price experience a crossover.
Note: The reference must be a higher-order timeframe. So if your chart is on the 15-minute, you can only reference timeframes greater than 15.
Setting - LDPM Box Creation :
Default: On.
Instead of implementing a reference LDPM, it is possible to display the other timeframes in a data table with conditional coloring for if the overall LDPM-Price relationship is bullish or bearish.
Why Chose LDPM
There are no other Liquidity-measuring indicators available to the retail investor. Measuring liquidity often requires the use of expensive data and high-throughput computing to be used in real-time. Neither of these requirements apply to utilizing LDPM.
Additionally, the data are supportive that LDPM provides statistically significant, price-direction-correct outlooks.
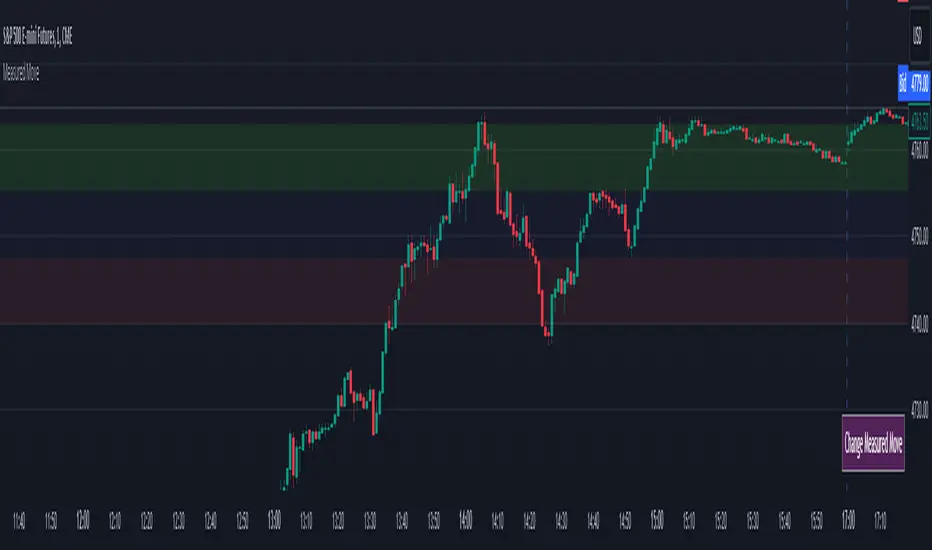
Measured MoveThis indicator was made for those who look to profit on “Measured Moves.”
Upon opening the settings one will need to set the time to begin (Start Time in settings) the colored background of the potential move areas, and the high (First Price Level in settings) and low (Second Price Level in settings) prices for the measured area for the measured move.
After those are selected they can be easily moved on the chart. I created a table for the user to tap with the pointer to highlight the setting lines for easy adjustment.
Measured moves are used by some algo’s and some traders to determine the take profit levels. They are moves from a particular pattern conclusion to a distance equal to that distance in the desired direction.
This is an image of the measured move which occurred on Dec 13th, 2023 at about 1pm on the ES 1m chart:
The center area in lightly shaded blue is the measured area. The green and red would be the same distance and would equate to the measured move distance.
This example shows the same day – the second move up was a measured move by some traders:
www.tradingview.com
Again, the same day on the way down. This one didn’t quite complete the move:
Again, same day on the way back up – almost perfect:
And, finally, the same day for the last move up:
This indicator will require the user to know what to look for in creating the measured movement. The script is quite simple – but, can be effective in assisting a user to know potential profit targets.
I conducted several searches for “measured move” and found no other indicators that provide this functionality. I understand that one could use fibs to do the same thing – but, I didn’t want to have to alter the fib settings (which I use for actual fibs) to perform this functionality.
Please comment with any questions/suggestions/etc.
Fibonacci compressionThis script will search x-bars back, if it can find a triangle formation that meets certain Fibonacci ratios.
Based on the trend-based fib extension tool from the first high to the first low and then the 2nd high (in a bullish structure, inverse for bearish), we can predict the take profit levels.
The main target is the 0.618, first take profit is at the 0.236. In a strong trend, one can aim for the 1 fib ratio.
Once the 3 points are known, the script will already plot the take profit levels. It is better to wait until the full pattern develops with a 2nd lower high and a 2nd higher low.
The way I use it, is closing 20% at TP1, 80% of the remainder at TP2 and final close out at TP3.
Stop loss is the red line which will show up after a full pattern is formed.
Plot out the profit levels with the trend based fib extension tool, because once there's a break-out of the pattern, the script won't show the compression any more. (or use the replay button to go back in time to plot it again)
The volume label will appear once there's a divergence between the low and higher low or the high and lower high. It is based on my cumulative volume script. It only works well on timeframes above 4 hour, but volume in favor of a short, doesn't always guarantee a good short setup, so don't take it for granted.
It has around a 30 - 33% chance of hitting your TP2, so make sure the risk to reward is at least 3.
Happy trading!

Harmonic Pattern Detection, Prediction, and Backtesting ToolOverview:
The ultimate harmonic XABCD pattern identification, prediction, and backtesting system.
Harmonic patterns are among the most accurate of trading signals, yet they're widely underutilized because they can be difficult to spot and tedious to validate. If you've ever come across a pattern and struggled with questions like "are these retracement ratios close enough to the harmonic ratios?" or "what are the Potential Reversal levels and are they confluent with point D?", then this tool is your new best friend. Or, if you've never traded harmonic patterns before, maybe it's time to start. Put away your drawing tools and calculators, relax, and let this indicator do the heavy lifting for you.
- Identification -
An exhaustive search across multiple pivot lengths ensures that even the sneakiest harmonic patterns are identified. Each pattern is evaluated and assigned a score, making it easy to differentiate weak patterns from strong ones. Tooltips under the pattern labels show a detailed breakdown of the pattern's score and retracement ratios (see the Scoring section below for details).
- Prediction -
After a pattern is identified, paths to potential targets are drawn, and Potential Reversal Zone (PRZ) levels are plotted based on the retracement ratios of the harmonic pattern. Targets are customizable by pattern type (e.g. you can specify one set of targets for a Gartley and another for a Bat, etc).
- Backtesting -
A table shows the results of all the patterns found in the chart. Change your target, stop-loss, and % error inputs and observe how it affects your success rate.
//------------------------------------------------------
// Scoring
//------------------------------------------------------
A percentage-based score is calculated from four components:
(1) Retracement % Accuracy - this measures how closely the pattern's retracement ratios match the theoretical values (fibs) defined for a given harmonic pattern. You can change the "Allowed fib ratio error %" in Settings to be more or less inclusive.
(2) PRZ Level Confluence - Potential Reversal Zone levels are projected from retracements of the XA and BC legs. The PRZ Level Confluence component measures the closeness of the closest XA and BC retracement levels, relative to the total height of the PRZ.
(3) Point D / PRZ Confluence - this measures the closeness of point D to either of the closest two PRZ levels (identified in the PRZ Level Confluence component above), relative to the total height of the PRZ. In theory, the closer together these levels are, the higher the probability of a reversal.
(4) Leg Length Symmetry - this measures the ΔX symmetry of each leg. You can change the "Allowed leg length asymmetry %" in settings to be more or less inclusive.
So, a score of 100% would mean that (1) all leg retracements match the theoretical fib ratios exactly (to 16 decimal places), (2) the closest XA and BC PRZ levels are exactly the same, (3) point D is exactly at the confluent PRZ level, and (4) all legs are exactly the same number of bars. While this is theoretically possible, you have better odds of getting struck by lightning twice on a sunny day.
Calculation weights of all four components can be changed in Settings.
//------------------------------------------------------
// Targets
//------------------------------------------------------
A hard-coded set of targets are available to choose from, and can be applied to each pattern type individually:
(1) .618 XA = .618 retracement of leg XA, measured from point D
(2) 1.272 XA = 1.272 retracement of leg XA, measured from point D
(3) 1.618 XA = 1.618 retracement of leg XA, measured from point D
(4) .618 CD = .618 retracement of leg CD, measured from point D
(5) 1.272 CD = 1.272 retracement of leg CD, measured from point D
(6) 1.618 CD = 1.618 retracement of leg CD, measured from point D
(7) A = point A
(8) B = point B
(9) C = point C
//------------------------------------------------------
// Stops
//------------------------------------------------------
Stop-loss levels are also user-defined, in one of three ways:
(1) % beyond the furthest PRZ level (below the PRZ level for bullish patterns, and above for bearish)
(2) % beyond point D
(3) % of distance to Target 1, beyond point D. This method allows for a proper Risk:Reward approach by defining your potential losses as a percentage of the potential gains. This is the default.
//------------------------------------------------------
// Results Table / Backtesting Statistics
//------------------------------------------------------
To properly assess the effectiveness of a specific pattern type, a time limit is enforced for a completed pattern to reach the targets or the stop level. When this time limit expires, the pattern has "timed out", and is no longer considered in the Success Rate statistics. During the time limit period, if price reaches Target 1 before reaching the Stop level, the pattern is considered successful. Conversely, if price reaches the Stop level before reaching Target 1, the pattern is considered a failure. The time limit can be changed in Settings, and is defined in terms of the total pattern length (point X to point D). It is set to 1.5 by default.
Increasing the time limit value will give you more realistic Success Rate values, but will less accurately represent the success rate of the harmonic patterns (i.e. the more time that elapses after a pattern completes, the less likely it is that the price action is related to that pattern).
//------------------------------------------------------
// Coming soon...
//------------------------------------------------------
I have a handful of other features in development, including:
(1) Drawing incomplete patterns as they develop. This will allow you more time to plan entries and stops, or potentially trade reversals from point C to point D PRZ levels.
(2) Support for the Shark and Cypher patterns
(3) Alerts
Please report any bugs, runtime errors, other issues or enhancement suggestions.
I also welcome any feedback from experienced harmonic pattern traders, especially regarding your strategy for setting targets and stop-losses.
@reees

Market Structure Break & Order Block by EmreKbThis indicator shows the market structure break (msb) and order blocks (ob). Msb occurs after the breakout old high when the price make lower lows or occurs after the breakout old low when the price make higher highs. OB occurs after the msb, ob is the last bullish candle before high if msb is bearish but if the msb is bullish then ob is the last bearish candle before low.
Zigzag Lenght - A number for the zigzag calculation
Show Zigzag - Show/Hide Zigzag lines
Fib Factor - Fib level for the breakout confirmation. For example if new high larger than old high to low fib 1+fib_factor when the down trend then it's a breakout.

Saty ATR LevelsThis indicator uses the previous period close and +/- 1 ATR to display significant day, multiday, swing, and position trading levels including:
- Trigger clouds for possibly going long/short @ 23.6 fib
- Mid-range level at 61.8 fib
- Full range level at +/- 1 ATR (from previous close)
- Extension level at 161.8 fib
Additionally, a convenient info table is provided that shows trend, range utilization, and numerical long/short values.
This indicator is most beneficial when you combine it with price, volume, and trend analysis. For educational content please check out the indicator website at atrlevels.com.
I am constantly improving this indicator, please use this one if you want to continue to get new features, bug fixes, and support.

MTF Vegas tunnel & pivots A script made to simplify trend identification, major and minor pivot but also bollinger band based signal
It is composed of a suite of indicators tuned to match my trading style. Feel free to tune settings.
Multi timeframe vegas tunnel
As you know, vegas tunnel are composed of 3 ema (144, 169, 233) which you can tune length in the parameters. Those are used to identify possible support & resistance zone.
Having support & resistance allow you to easily identify the trend. But what is even better is to be able to always have an global view of the market
without having to switch time frame. This is why vegas tunnel are displayed from 1m to Daily (1m, 5m, 15m, H1, H4 & D).
This is to be able to identify trend/support/resistance on a given timeframe while keeping an eye on the upper timeframe
Major and minor pivot:
This part is based on benchch Major and Minor Fib points
It will highlight high and low if no new high or low has been established for a given period of time.
Super useful to find high and low to draw fib retracement to find your trade entry point, SL, PTP and TP
BB% Signal:
Last but not least BB signal. This is based on the TV indicator BB% indicator but adding signal on chart when crossing up or down 0.8 & 0.2.
It allow you to potentially find weakness in the current movement and should alarm you that it might be time to find an entry or get out of your current trade.

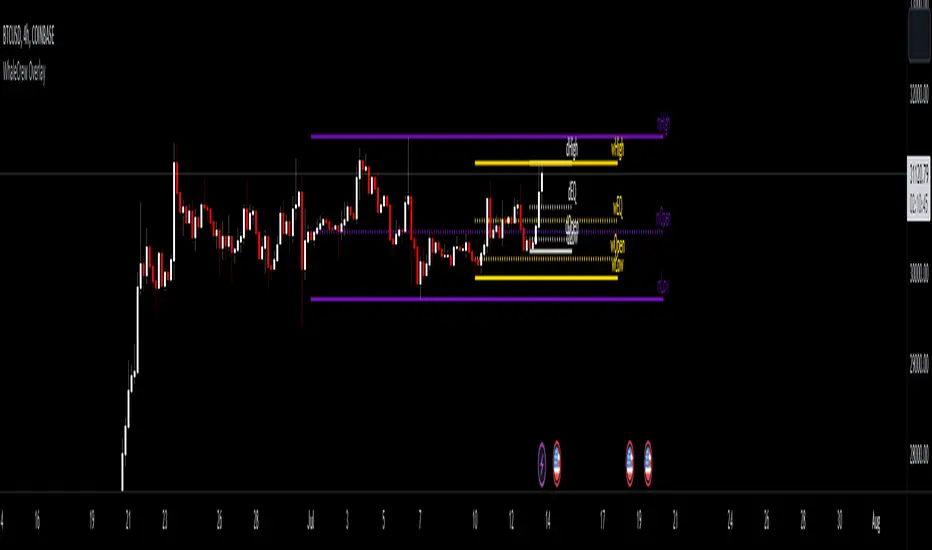
WhaleCrew OverlayThis overlay is all about looking for confluence, and this is achieved by combining the power of Support/Resistance trading and Moving Averages.
Features
Support and Resistance
Trend Visualization
Fib Ribbons
Moving Average System
Intraday Tools
Support and Resistance
This involves Daily Levels (High, Low, Open, and Range Center), Weekly Levels (Open, High and Low), as well as the Monthly/Quarterly/Yearly Open.
Automatically having these support/resistance levels on your chart no matter what timeframe you're on is a big advantage, they can be used as confluence levels for potential trades.
Trend Visualization
Our trend component visualizes the current trend using two moving averages. There are multiple inbuilt modes that should be picked based on your trading style.
Use this indicator as confluence and don't rely solely on it.
Fib Ribbons
Our Fib Ribbons are a bundle of multiple EMAs with custom timeframe built-in. Unlike EMA Ribbons our EMA lengths are only based on Fibonacci Numbers.
The numbers of EMAs is four by default (fastest: 8, slowest: 34), but EMA 5 & 55 can be manually enabled.
The ribbons will act as support in an uptrend and as resistance in a downtrend. A ribbon cross often indicates a potential trend change.
Moving Average System
Build a system around 2 custom moving averages for more confluence (supports custom timeframes and many moving average types).
The moving averages can be used for generating signals whenever they cross, or as possible support/resistance.
Intraday Tools
We also support intraday tools like VWAP (Volume-Weighted-Average Price) and TWAP (Time-Weighted-Average-Price).
They differ from normal moving averages by taking volume/time into account and will act as potential support/resistance (commonly used by big market participants).
Usage
You should look for price levels where moving averages and support/resistance are lined up for confluence.
Closely monitor price action near important price levels for potential trade setups:
Consolidation right below resistance is considered bullish
Consolidation right at support might be considered bearish
Watch out for rejections and retests (also counts for moving averages)
Access to this indicator can be obtained through our website.
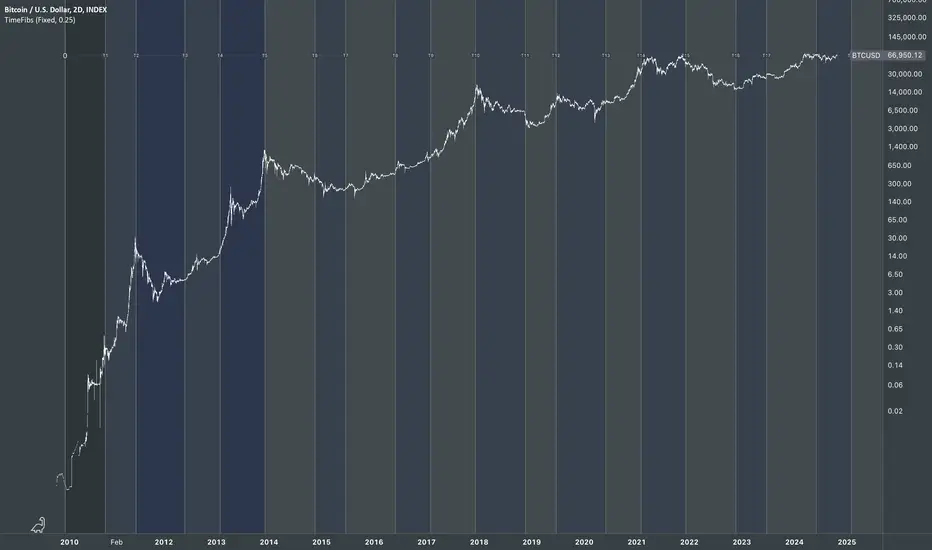
Universal logarithmic growth curves, with support and resistanceLogarithmic regression is used to model data where growth or decay accelerates rapidly at first and then slows over time. This model is for the long term series data (such as 10 years time span).
The user can consider entering the market when the price below 25% or 5% confidence and consider take profit when the price goes above 75% or 95% confidence line.
This script is:
- Designed to be usable in all tickers. (not only for bitcoin now!)
- Logarithmic regression and shows support-resistance level
- Shape of lines are all linear adjustable
- Height difference of levels and zones are customizable
- Support and resistance levels are highlighted
Input panel:
- Steps of drawing: Won't change it unless there are display problems.
- Resistance, support, other level color: self-explanatory.
- Stdev multipliers: A constant variable to adjust regression boundaries.
- Fib level N: Base on the relative position of top line and base line. If you don't want all fib levels, you might set all fib levels = 0.5.
- Linear lift up: vertically lift up the whole set of lines. By linear multiplication.
- Curvature constant: It is the base value of the exponential transform before converting it back to the chart and plotting it. A bigger base value will make a more upward curvy line.
FAQ:
Q: How to use it?
A: Click "Fx" in your chart then search this script to get it into your chart. Then right click the price axis, then select "Logarithmic" scale to show the curves probably.
Q: Why release this script?
A: - This script is intended to to fix the current issues of bitcoins growth curve script, and to provide a better version of the logarithmic curve, which is not only for bitcoin , but for all kinds of tickers.
- In the public library there is a hardcoded logarithmic growth curve by @quantadelic . But unfortunately that curve was hardcoded by his manual inputs, which makes the curve stop updating its value since 2019 the date he publish that code. Many users of that script love using it but they realize it was stop updating, many users out there based on @quantadelic version of "bitcoin logarithmic growth curves" and they tried their best to update the coordinates with their own hardcode input values. Eventually, a lot of redundant hardcoded "Bitcoin growth curve" scripts was born in the public library. Which is not a good thing.
Q: What about looking at the regression result with a log scale price axis?
A: You can use this script that I published in a year ago. This script display the result in a log scale price axis.

Support Resistance Zones using confluence & Std. DeviationOverview:
This indicator takes (interactive) input from the user for support and resistance levels and plots important zones considering the other confluence levels in the indicator.
Working of indicator:
This indicator takes six input of Support/resistance level form the user
It has following 32 confluence levels
a.4 Recent positive Divergence levels (DN1, DN2, DN3, DN4)
b.4 recent negative divergence levels (DP1, DP2, DP3, DP4)
d.5 Fibonacci levels (Fib0, Fib236, Fib5, Fib618, Fib786)
e. 7 Pivot levels (P, PR1, PR2, PR3, PS1, PS2, PS3)
f.4 EMAs (E20, E200, E100, E50)
g. ATH, ATL, Weekly High, Weekly Low, two days ago high, two days ago low, previous day high , previous day low
The code checks nearest ‘n’ CONFLUENCE for each level (“Number of confluences to check”) in the indicator, after getting the nearest confluence it calculates the standard deviation of those levels WITH RESPECT TO THE MANUAL INPUT LEVELS.
If the Std. Deviation is less than the input value (“Minimum standard deviation” option) then the zone is displayed on the chart.
How to use:
Add the indicator on the chart select your important support and resistance levels.
Set standard deviation, if the confluence is less than the input standard deviation then you will see those zones on the chart.
You can display all divergence levels; you can display all fib levels. All confluences can be displayed by using the setting of the indicator
How to read the indicator values:
The zone will show all the confluence it has in its zone,
Example:
Table details:
The table shows the maximum and minimum deviation out of all six levels .To see at least one zone you have to make sure that Input value Std. Deviation must be greater than Min Std. Deviation of the table
Sources & refences :
Big thank to www.pinecoders.com and kodify.net
Standard deviation :
www.investopedia.com
function to find 'k' closest elements :
www.techiedelight.com
Interactive support resistance :
Divergence for many indicators:
Auto fib level by DGT:
www.tradingview.com

+ Donchian ChannelsThis version of Donchian Channels uses two source options so that one can create a channel using highs and lows rather than one or the other or closes. My thinking was that this would create a more accurate portrayal of price action (or at least contain the greatest scope of it) as seen through the lens of a Donchian Channel. This was actually part of the genesis of my idea around my Ultimate Moving Average.
Besides the single top and bottom plot for the DC's extremities, I've enabled the ability to create outer bands with a variable width that the user can adjust to their preference. I think it's quite nice. I use it in the DC in my other non-overlay indicators.
Besides this additional functionality, the indicator has options to plot lines between the basis and the upper and lower bands, so, basically, splitting the upper and lower channel in half.
There is no magic number to the lookback. I chose 233 as default because it's a fibonacci sequence number and I'm more interested in using the DC like a very long period bias indicator, and the longer lookback gives a much wider window (because highs and lows are so spread apart) with which other faster indicators (supertrend, shorter period moving averages, etc.) can work without making the screen a clutter.
The color of the basis may also be made relevant to higher timeframe information. What I mean by this is that you can set it so that the basis of the current timeframe is colored based on the candle close of the higher timeframe of your choosing. If you're looking at an hourly chart, and you set the color to Daily, the basis will be colored based on the candle close (above or below the basis) of the previous day. If the previous daily close was above the basis, that positive color will be reflected in the basis, even if the current hourly candle closes are below the hourly basis. This could potentially be useful for setting a higher timeframe directional bias and reacting off price crossing the lower timeframe basis (or whatever your trigger for entering a trade might be). This is also optional in my Ultimate Moving Average indicator.
You can also set the entire indicator to whatever time frame you want if you want to see where the actual basis, or other levels are on that higher timeframe.
Further additions include fibonacci retracement levels. These are calculated off the high and the low of the Donchian Channels themselves.
You will see that there are only three retracement levels (.786, .705, .382), one of which is not a fib level, but what some people call the 'OTE,' or optimal trade entry. If you want more info on the OTE just web search it. So, why no .618 or .236? Reason being that the .618 overlaps the .382, and the .236 is extremely close to the .786. This sounds confusing, but the retracement levels I'm using are derived from the high and low, so it was unnecessary to have all five levels from each. I could have just calculated from the high, or just from the low, and used all the levels, but I chose to just calculate three levels from the high and three from the low because that gives a sort of mirror image balance, and that appeals to me, and the utility of the indicator is the same.
The plot lines are all colored, and I've filled certain zones between them. There is a center zone filled between both .382 levels, and an upper and lower zone filled between the .786 and either the high or the low.
If you like the colored zones, but don't like the plots because they cause screen compression, turn off the plots under the "style" tab.
There are alerts for candle closes across every line.
I should state that, regarding the fibs, obviously the length of the Channels is going to affect to what levels price retraces to. A shorter lookback means you will see more changes in highs and lows, and therefore retraces are often going to be full retraces within the bands unless price is trending hard. A longer lookback means you will see smaller retraces. Using this in conjunction with key high timeframe levels and/or a moving average can give great confidence in a trade entry. Additionally, if you have a short bias it may help in finding levels or entering a trade on a pullback. It could also be good for trade targets. But again, the lookback you choose for this indicator is going to dictate its use in the system you're building or already have. A 9 EMA and a 200 EMA, while fundamentally the same, are going to be used somewhat differently while doing your chart analysis.
Additional images below.
Same image as main, but with supertrend and my +UMA to help with chart analysis.
Image with the fib stuff turned on.
Zoomed out image with the same.
Shorter lookback period.
Zoomed in image of shorter lookback.

PROFIT INDICATORFirst let me tell you which indicators have been used in this script so that you have the confidence while taking the trade:
(a) Bollinger Band with 20 SMA Inside it - Currently it is off, you can turn it on from settings.
(b) HMA 33, I have added the option of using two HMA's simultaneously. You can use HMA, EMA, SMA as per your settings and it would be color trending.
(c) VWAP- you can turn it on from settings
(d) CPR- you can turn it on from settings
(e) EMA's 20, 50, 200. Currently off, you can turn it on from settings.
(d) SMA's 50 and 200. Currently off, yu can turn it on from settings, if you want to use 20 SMA you can use bollinger band basis that is 20 period SMA.
(f) Trend bar at bottom on the basis of 50 EMA.
(g) Half Trend
(h) Trend strength Detector
(d) EMA 50 high and low to show the pac channel. I am not using this however as per request I have added this. Currently, it is trun on and you can turn it off from settings.
(f) Auto Fib levels
Please use a stick note for few days and mention imp notes before taking trade to check if all the conditions are matching to take the trade.
Buy Condition:-
1. Bolling band should be widely open.
2. Check the support and resistance from CPR. Candle should close above support in green.
3. Check the trend bar at bottom, it should be green, if it is grey in colour dont enter in trade.
4. Candle should be closing above EMA 50 and its upto you if you need additional confirmation, you can use EMA 20, 50, 200 and SMA 50 and 200, this is optional.
5. You can use VWAP as support or resistance and you can turn it on from settings.
6. Trending HMA of 33 should be in green for buy.
7. Half trend Indicator should give buy signal.
8. Trend Strength Indicator for checking the strength of the trend, if the arrow is big upside, you can go for buy.
9. Exit from buy trade when it start showing very small arrow which means trend is about to change.
10.Exit buy trade at 61.8 Fib level
Sell Condition:-
1. Bolling band should be widely open.
2. Check the support and resistance from CPR. Candle should close below resistance in red.
3. Check the trend bar at bottom, it should be red, if it is grey in colour dont enter in trade.
4. Candle should be closing below EMA 50 and its upto you if you need additional confirmation, you can use EMA 20, 50, 200 and SMA 50 and 200, this is optional.
5. You can use VWAP as support or resistance and you can turn it on from settings.
6. Trending HMA of 33 should be in red for sell.
7. Half trend Indicator should give sell signal.
8. Trend Strength Indicator for checking the strength of the trend, if the arrow is big downside, you can go for sell.
9. Exit from sell trade when down arrows start showing very small in size which means trend is about to change.
10.Exit sell trade at 61.8 Fib level

Linear Regression & RSI Multi-Function Screener with Table-LabelHi fellow traders..
Happy to share a Linear Regression & RSI Multi-Function Custom Screener with Table-Labels...
The Screener scans for Linear Regression 2-SD Breakouts and RSI OB/OS levels for the coded tickers and gives Summary alerts
Uses Tables (dynamica resizing) for the scanner output instead of standard labels!
This Screener cum indicator collection has two distinct objectives..
1. Attempt re-entry into trending trades.
2. Attempt Counter trend trades using linear regression , RSI and Zigzag.
Briefly about the Screener functions..
a. It uses TABLES as Labels a FIRST for any Screener on TV.
b. Tables dynamically resize based on criteria..
c. Alerts for breakouts of the UPPER and the LOWER regression channels.(2 SD)
d. In addition to LinReg it also Screens RSI for OB/OS levels so a multifunction Screener.
e. Of course has the standard summary Alerts and programmable format for Custom functions.
f. Uses only the inbuilt Auto Fib and Lin Reg code for the screener.(No proprietary stuff)
g. The auto Zigzag code is derived(Auto fib).
Question what are all these doing in a single screener ??
ZigZag is very useful in determining Trend Up or Down from one Pivot to another.
So Once you have a firm view of the Current Trend for your chosen timeframe and ticker…
We can consider few possible trading scenarios..
a. Re-entry in an Up Trend - Combination of OS Rsi And a Lower Channel breach followed by a re-entry back into the regression channel CAN be used as an effective re-entry.
b. Similarily one can join a Down Trend on OB Rsi and Upper Channel line breach followed by re-entry into the regression channel.
If ZigZag signals a range-bound market, bound within channel lines then the Upper breakout can be used to Sell and vice-versa!
In short many possibilities for using these functions together with Scanner and Alerts.
This facilitates timely PROFITABLE Trending and Counter trend opportunities across multiple tickers.
You must give a thorough READ to the various available tutorials on ZigZag / Regression and Fib retracements before attempting counter trend trades using these tools!!
A small TIP – Markets are sideways or consolidating 70% of the time!!
Acknowledgements: - Thanks a lot DGTRD for the Auto ZigZag code and also for the eagerness to help wherever possible..Respect!!
Disclaimer: The Alerts and Screener are just few tools among many and not any kind of Buy/Sell recommendations. Unless you have sufficient trading experience please consult a Financial advisor before investing real money.
*The alerts are set for crossovers however for viewing tickers trading above or below the channel use code in line 343 and 344 after setting up the Alerts!
** RSI alerts are disabled by default to avoid clutter, but if needed one can activate code lines 441,442,444 and 445
Wish you all, Happy Profitable Trading!

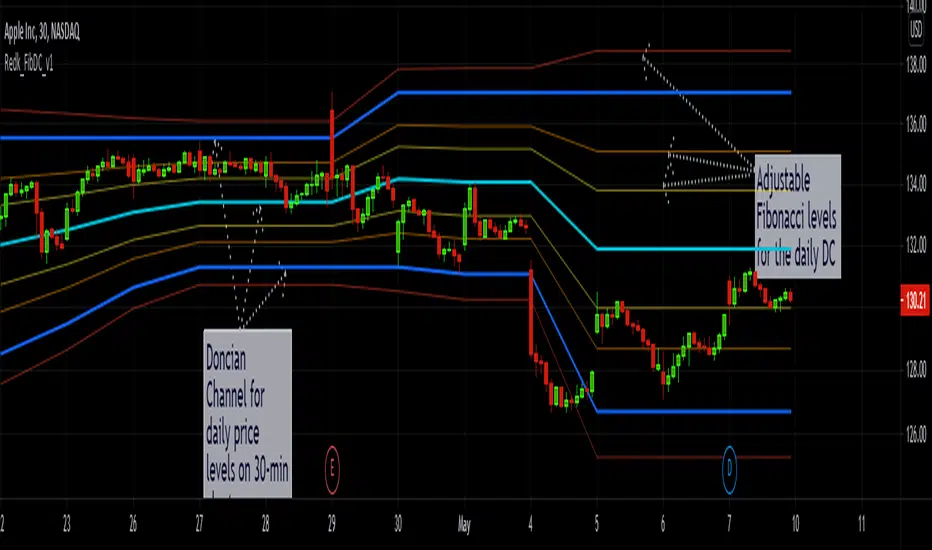
RedK_Fibonacci on Doncian (RedK_FibDC_v1)this is a quick script that gives the ability to plot a simple Doncian Channel with optional Fibonacci levels calculated against the DC channel breadth.
a Doncian channel is simply a channel that represents the highest high and lowest low of the price for a certain period (number of bars) -- the concept of watching these extreme values is the basis of many other technical indicators in chart analysis.
A script like this may come useful for setting entry and exit levels and can be used to plot the DC & Fib levels for a higher resolution than the chart - in the example, we're looking at the DC & its Fib levels for the daily resolution on a 30-min chart.
there are 3 adjustable levels that are set by default to 0.368, 0.618, and 1.272 -- and they can be set to any other levels we need to monitor - not necessarily Fib-based at all - say to determine a possible breakout or breakdown... etc
this script makes use of the "resolution" and "inline / group" features (powers) of Pine :)
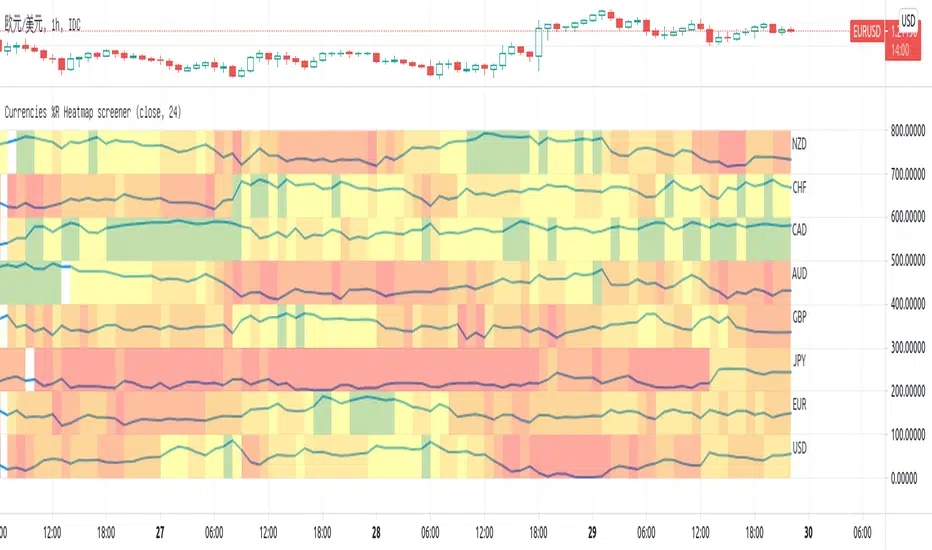
Currencies %R Heatmap screenerThis script is for Forex combinations of the following currencies: USD, EUR, GBP, JPY, CHF, AUD, NZD, CAD
- It uses security function to get 28 currency pairs, so that it may cost a few seconds to paint.
- It calculates %R of currencies and paint with fib color mentioned on my other script Williams %R Color Map
- Normally fib more currency stronger, and fib less the currency weaker. If too big or too small, considering trend change.
I always put on 3 charts with 1h, 5h ,1D to have a quick view.
Automatic Fibonacci Retracements [MS]Automatic Fibonacci Retracement Level indicator for any time frame, any asset.
Simple to use, just add to your chart and set the size of retracements you want to see.
Fib levels keep drawing in real time until the next low or high is found to start drawing the next fib.
Settings Include
• Fib size
• Show prices
• Draw low-to-high or high-to-low
• Toggle fib levels
Use the link below or PM us to obtain access to this indicator.

A Fibonacci Moving Averages Ribbon Using One PlotThe following script aims to visually reproduce a Fibonacci moving averages ribbon by only using one plot function, the period of the moving average is determined by a number of the Fibonacci sequence. This trick is made possible by computing the value of a moving average at time t with a period determined by a periodic Fibonacci sequence and using plot.style_circles as plot style.
Settings
From Fibonacci Number: Determine the n th Fibonacci number to be used as the lowest moving average period
To Fibonacci Number: Determine the n th Fibonacci number to be used as the highest moving average period, capped at 19 to avoid errors. If you still have errors lower the value.
Src : input series of the moving average.
Details
The first thing we must do is to compute a periodic (repeating) linear sequence n from the number in From Fibonacci Number to the number in To Fibonacci Number , then we get the n th Fibonacci number from the previous sequence using Binet's formula.
To get the moving average we first compute the fib period momentum of the cumulative sum of Src , where fib is the current number of our periodic Fibonnacci sequence, we then divide the result by fib .
If we zoom in we can indeed see that there is only one point per bar.
However, zooming out and using a different color for each point allows us to get something visually similar to a ribbon. Adding more plots would create a visually more accurate result.
This trick is not the most useful in the world, but let's imagine you want to plot a massive ribbon consisting of 1000 moving averages with periods that can be determined by a specific sequence, using this trick would allow you to have the effect of 1000 plots while keeping your script relatively efficient, altho ribbons consisting of lots of moving averages are rarely easy to visualize.

BTC 1D Alerts V1This script contains a variety of key indicator for bitcoin all-in-one and they can be activated individually in the menu. These are meant to be used on the 1D chart for Bitcoin.
1457 Day Moving Average: the bottom of the bitcoin price and arguably the rock bottom price target.
Ichimoku Cloud: a common useful indicator for bitcoin support and resistance.
350ma fibs (21 8 5 3 2 and 1.6) : Signify the tops of each logarthmic rise in bitcoin price. They are generally curving higher over the long term. For halvening #3, the predicted market crash would be after hitting the 350ma x3 fib. Also the 350 ma / 111 ma cross signifies bull market top within about 3 days as well. Using the combination of the 350ma fibs and the 350/111 crosses, reasonably identify when market top is about to occur.
50,120,200 ma: Common moving averages that bitcoin retests during bull market runs. Also, the 50/200 golden and death crosses.
1D EMA Superguppy Ribbons: green = bull market, gray is indeterminate, red = bear market. Very high specificity indicator of bull runs, especially for bitcoin. You can change to 3D candle for even more specificity for a bull market start. Use the 1W for even more specificity. 1D Superguppy is recommended for decisionmaking.
1W EMA21: a very good moving average programmed to be shown on both the daily and weekly candle time. Bitcoin commonly corrects to this repeatedly during past bull runs. Acts as support during bull run and resistance during a bear market.
Steps to identifying a bull market:
1. 50/200 golden cross
2. 1D EMA superguppy green
3. 3D EMA superguppy green (if you prefer more certainty than step 2).
4. Hitting the 1W EMA21 and bouncing off during the bull run signifies corrections.
Once a bull market is identified,
Additional recommended buying and selling techniques:
Indicators:
- Fiblines - to determine retracements from peaks (such as all time high or recent highs)
- Stochastic RSI - 1d, 3d, and 1W SRSI are great time to buy, especially the 1W SRSI which comes much less frequently.
- volumen consolidado - for multi exchange volumes compiled into a single line. I prefer buying on the lowest volume days which generally coincide with dips.
- MACD - somewhat dubious utility but many algorithms are programmed to buy or sell based on this.
Check out the Alerts for golden crosses and 350ma Fib crosses which are invaluable for long term buying planning.
I left this open source so that all the formulas can be understood and verified. Much of it hacked together from other sources but all indicators that are fundamental to bitcoin. I apologize in advance for not attributing all the articles and references... but then again I am making no money off of this anyway.

EdgeAnalysisGroup: FibTrendsBased on EdgeAnalysisGroup: Fib MA's > The bar color logic is simple. If the closing of a price crosses under a fib then a red bar will appear. If the closing price crosses above a fib then a green bar will appear.

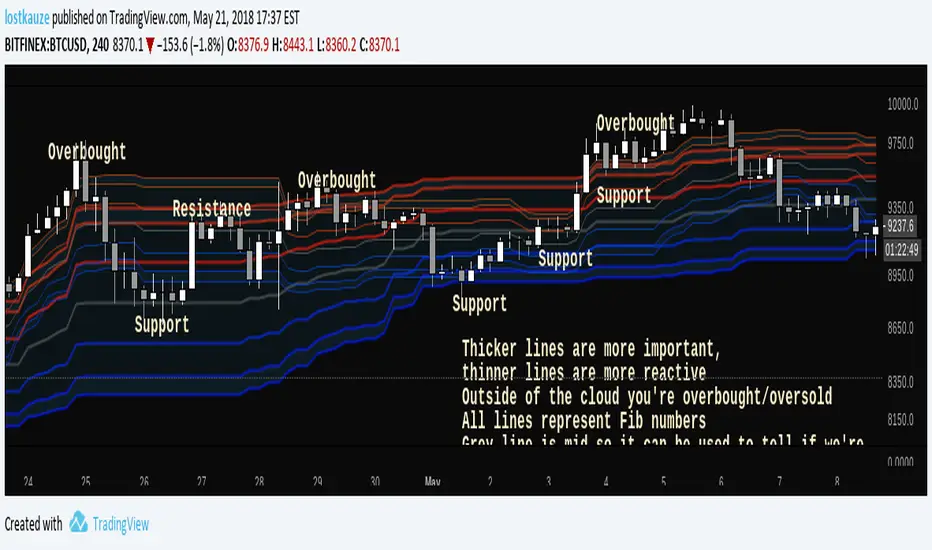
Fibonacci CloudInspired by Ichimoku Fibonacci Hybrid , this indicator is for those who don't mind a lot of lines. All lines represent Fib ratios: thicker lines are fibs for a longer period, while thinner lines are fibs for a shorter period.
- Dynamic S/R
- Overbought/Oversold zones
- Trend indicator
- Customisable periods
- Fast/Slow crossovers
See what works for you!
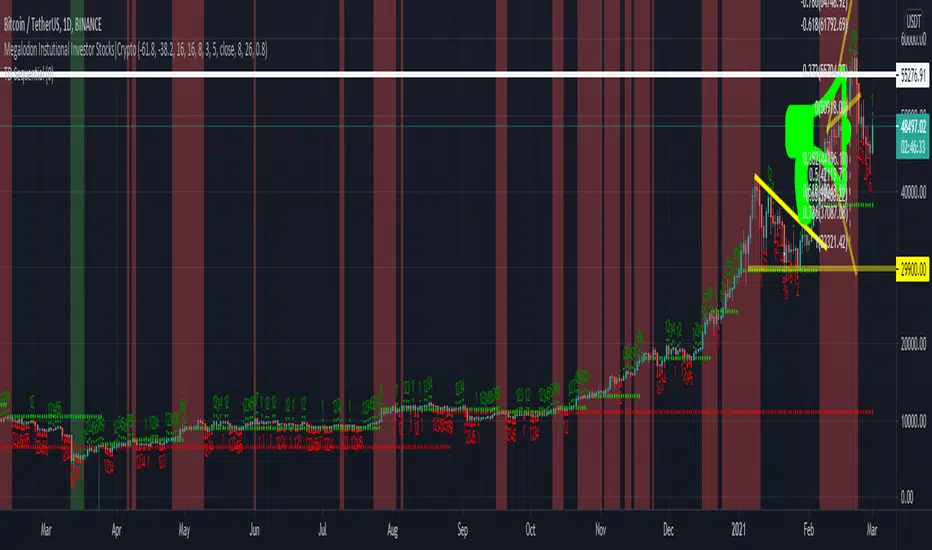
iPyra◬_theMegalodonTHEMEGALODON
theMegalodon looks for the institutional finger prints, the whales or the big boys.
theMegalodon is really simple to use.
theMegalodon combines the 8 different unique indicators, that each have almost perfect success rate.
theMegalodon works with any kind of market state, any kind of trading, and any kind of asset.
theMegalodon has more features than any other indicator in the market: Out of 9 working indicators, we have 3 momentum, 3 price and 3 volume indicators showing you the best signals.
--------------------------------------
theMegalodon is designed for us, the small fishes in the ocean, the millennials, the college students. This will basically makes us the new Megalodons(whale hunters).
All you have to do is:
1- Look for green or red arrows.
2- Look for orange or red candles.
3- Repeat
--------------------------------------
TECHNICAL DETAILS
Some boring info that you don't necessarily need to know.
1- Draws fibonacci retracement (s)' levels depending on your preferred look back period (Default: 365 and 120)
i) Can draw 2 fibs on the same chart. Can reverse the fib levels. Even, add an additional fib level to look for.
ii) Automatic fill function for a Reload Zone inside of a Reload Zone. *61.8% levels to 100% levels or 0% levels
2- Changes the color of the candle when strong buy(orange) or strong sell(red). Draws arrows on the chart for long and short positions.
i) Analyses and Combines
a) Price
b) Momentum
c) Volume
3- Prints out the indicators that are either giving Short or Long signs on the right corner.
4- The closer the unclebo indicator(click enable UncleBo) gets to the All time high, the better buy it is.
i) Same with the other way around. The closer it gets to the 0, the better sell it is.
5- Draws Bollinger Bands on the chart and shows where to buy or sell
6-The indicator is designed to be used in Daily time frame for the best calls to short or long.
--------------------------------------------------
iPyra◬
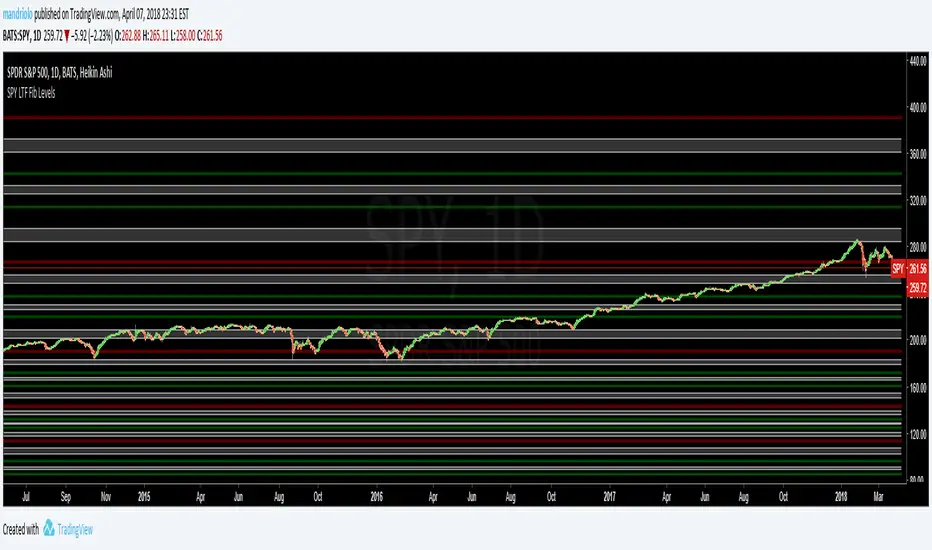
Enlighten others
SPY LongerTimeFrame (LTF) - Maroon, Green, White (SPY)This is a Longer Time Frame Fib level indicator. It shows where the market is looking to go and where it has been. When the market get above one level ( white bar, for example) look for price action to continue to the next level. If it breaks below the white bar look for it to go the next level below for support. I will also publish levels inside these levels for those looking to see them on smaller time frames. I hope it will impress! It is great for having targets. It helps in knowing why the market may continue in a direction. For example: When the price action has already moved up, why does it keep going up, because it hasn't reached targeted fib level yet. Same reason price action may move lower. It is looking for its fib level support.