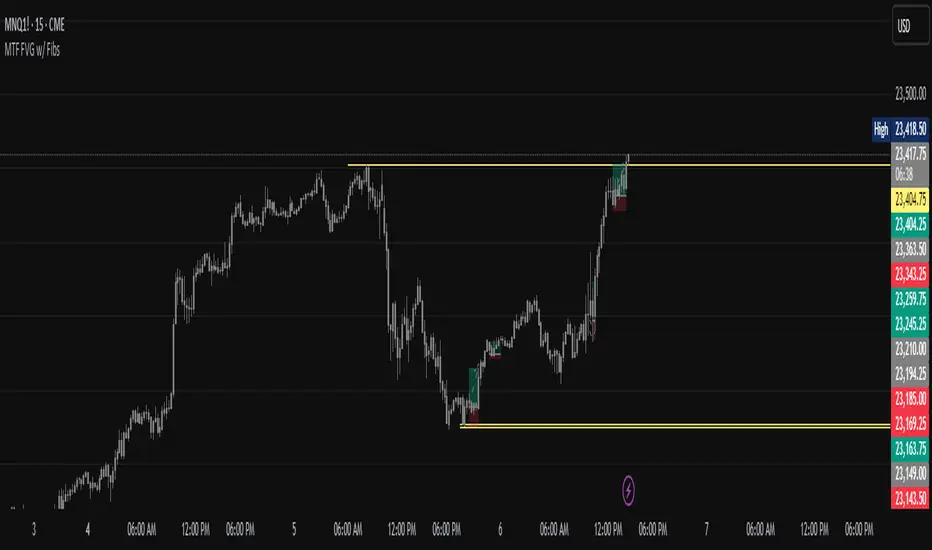
Dr. Fib - FGBAB - Open Range Breakout for Indexes v2.0 *** EXCLUSIVELY FOR INDEXES ***
This Open Range Breakout Indicator (ORB) helps your discretionary trading when looking for breakouts on the 15 mins range; and you can use it on small time frames to time your entries with more precision.
This indicator helps your discretionary trading by allowing visual settings that helps discretionary trades to make faster decisions.
It will provide you will the following on-screen information:
- ORB HIGH and LOW: The Open Range Breakout set by the input parameters, for example the first 15 mins RTH Open from 9:30 to 6:45.-
- ORB MID: The ORB mid point for reference, generally the price tends to return and bounce from the 50% ORB.
Reward to Risk posible targets for LONG and SHORT trades: This will provide target value references, it is based on the ORB Risk from high to low, you have 1:1, 2:1, 3:1 and 4:1 possible targets in both directions.
Reference table:
The reference table is a visual setting for you to have at first sight important information before considering getting into the trade:
- ORB HIGH and LOW.
- Risk in points.
- Risk in USD.
- Amount of contracts considering the MaxRisk input parameter you select.
- The current LIVE R:R based on the entry, if price is abobe ORB High it will simulate a LONG position is price is below the ORB Low it will simulate a SHORT position,
- The LIVE profit simulation based on the above.
- MaxRunUP, the highest equity the trade simulation has produced.
Direction: The current trade direction simulation based on the ORB HIGH or ORB LOW.
This new version (2.0) will provide historical ORB's and Target in the chart so you can use for future references and past performance analysis.
Keep in mind this indicator is a "gauge" a visual help for discretionary traders that like to trade Open Range Breakout strategy.
It will reset the ORB at RTH Close and build a new ORB at next RTH calendar day based in the ORB time you have selected by the input parameters.
Please feel free to use in your own trading at your own discretion.
Cari dalam skrip untuk "fib"

Dr. Fib - FGBAB - Open Range Breakout for Stocks V1.0This Open Range Breakout Indicator (ORB) helps your discretionary trading when looking for breakouts on the 15 mins range.
This indicator helps your discretionary trading by allowing visual settings that helps discretionary trades to make faster decisions.
It will provide you will the following on-screen information:
- ORB HIGH and LOW: The Open Range Breakout set by the input parameters, for example the first 15 mins RTH Open from 9:30 to 6:45.-
- ORB MID: The ORB mid point for reference, generally the price tends to return and bounce from the 50% ORB.
Reward to Risk posible targets for LONG and SHORT trades: This will provide target value references, it is based on the ORB Risk from high to low, you have 1:1, 2:1, 3:1 and 4:1 possible targets in both directions.
Reference table:
The reference table is a visual setting for you to have at first sight important information before considering getting into the trade:
- ORB HIGH and LOW.
- Risk in points.
- Risk in USD.
- Amount of shares considering the MaxRisk input parameter you select.
- The current LIVE R:R based on the entry, if price is abobe ORB High it will simulate a LONG position is price is below the ORB Low it will simulate a SHORT position,
- The LIVE profit simulation based on the above.
- MaxRunUP, the highest equity the trade simulation has produced.
Direction: The current trade direction simulation based on the ORB HIGH or ORB LOW.
Keep in mind this indicator is a "gauge" a visual help for discretionary traders that like to trade Open Range Breakout strategy.
It will reset the ORB at RTH Close and build a new ORB at next calendar day based in the ORB time you have selected by the input parameters.
Please feel free to use in your own trading at your discretion.

Confluence Indicator: Fib, MACD, SMA 50/200This is a scalping indicator best used on the 1hour and 15min charts

TargetsLevels. ATR fib magic. Works on any index or stock. Must have extended hours turned on.
Generally breaking above/below blue lines can indicate a target of above or below levels.

MJBFX-Strategy (Futures Optimized)The MJBFX-Strategy is a complete market mapping tool designed to give traders a clear view of liquidity, session dynamics, and premium/discount levels. It loads automatically on any chart, fully optimized for futures and forex trading.
🔑 Key Features
Asian Session Range
Highlights the previous Asian session with a shaded box
Fixed until London open for precise reference
VWAP from Asian Session
Plots the VWAP of the previous Asian session
Dynamic fair value benchmark for intraday trading
Liquidity Sweeps (Optimized)
Detects sweeps of the Asian session high/low
Shown only on 30m, 1h, and 4h charts to reduce noise
Clean, minimal labels for clarity
Automatic Fibonacci Zone
Draws a shaded retracement zone (38.2%–61.8%) of the Asian range
Transparent fill makes it easy to read price action
Killzones
Highlights London (07:00–10:00) and New York (13:00–16:00) killzones
Semi-opaque shading to keep charts clean
Auto Trade Box (Risk/Reward)
On sweep confirmation, plots a 2R target box
Auto stop loss and take profit levels based on futures tick size
🎯 Why Use It?
The MJBFX-Strategy removes the need for manual drawing.It automatically maps:
Session highs and lows
Liquidity sweeps
VWAP and fib retracement zones
Key killzones
Perfect for session-based intraday trading in both futures and forex.
⚡ No manual settings required.Just load it onto your chart for an instant institutional view of the market.

Level System DTWelcome to Level System This is a automated Tradeing Level system that uses Divergence Fibs TMC Pivots and Fractal calculations to gives traders support and resistance levels on all time frames... This has been built by DrZayas and DrTrade.. There will be future updates Please Enjoy and let us know if you have any issues

Auto Fib Extension with alert (golden rentry zone)Ideal for:
Traders who want an objective, auto-updating Fibonacci framework to identify potential continuation, or reaction zones after significant highs. The “Golden zone” highlights an area of particular interest for bounces, reactions, or consolidations. Once, price renters the Golden zone, 40% of the time, it will lead to 1.68 and 2.68 levels, making 80 to 200% once all time high is broken!!
This script automatically detects major swing points (all-time high and following swing low) using the last 1 year or 6 months of data, then draws Fibonacci retracement and extension levels from the all-time high (ATH) down to the lowest low after that high.
What it does:
Detects All-Time High (ATH) within your chosen lookback window (default: 1 year, falls back to 6 months if insufficient bars).
Finds the lowest low after ATH within the lookback period (ensures swing low always comes after swing high).
Plots Fibonacci retracement levels (0, 0.236, 0.382, 0.5, 0.618, 0.786, 1) from ATH to the swing low.
Issues an alert if price enters the Golden zone (between 0.236 and 0.382).

Quantum Dip Hunter | AlphaNattQuantum Dip Hunter | AlphaNatt
🎯 Overview
The Quantum Dip Hunter is an advanced technical indicator designed to identify high-probability buying opportunities when price temporarily dips below dynamic support levels. Unlike simple oversold indicators, this system uses a sophisticated quality scoring algorithm to filter out low-quality dips and highlight only the best entry points.
"Buy the dip" - but only the right dips. Not all dips are created equal.
⚡ Key Features
5 Detection Methods: Choose from Dynamic, Fibonacci, Volatility, Volume Profile, or Hybrid modes
Quality Scoring System: Each dip is scored from 0-100% based on multiple factors
Smart Filtering: Only signals above your quality threshold are displayed
Visual Effects: Glow, Pulse, and Wave animations for the support line
Risk Management: Automatic stop-loss and take-profit calculations
Real-time Statistics: Live dashboard showing current market conditions
📊 How It Works
The indicator calculates a dynamic support line using your selected method
When price dips below this line, it evaluates the dip quality
Quality score is calculated based on: trend alignment (30%), volume (20%), RSI (20%), momentum (15%), and dip depth (15%)
If the score exceeds your minimum threshold, a buy signal arrow appears
Stop-loss and take-profit levels are automatically calculated and displayed
🚀 Detection Methods Explained
Dynamic Support
Adapts to recent price action
Best for: Trending markets
Uses ATR-adjusted lowest points
Fibonacci Support
Based on 61.8% and 78.6% retracement levels
Best for: Pullbacks in strong trends
Automatically switches between fib levels
Volatility Support
Uses Bollinger Band methodology
Best for: Range-bound markets
Adapts to changing volatility
Volume Profile Support
Finds high-volume price levels
Best for: Identifying institutional support
Updates dynamically as volume accumulates
Hybrid Mode
Combines all methods for maximum accuracy
Best for: All market conditions
Takes the most conservative support level
⚙️ Key Settings
Dip Detection Engine
Detection Method: Choose your preferred support calculation
Sensitivity: Higher = more sensitive to price movements (0.5-3.0)
Lookback Period: How far back to analyze (20-200 bars)
Dip Depth %: Minimum dip size to consider (0.5-10%)
Quality Filters
Trend Filter: Only buy dips in uptrends when enabled
Minimum Dip Score: Quality threshold for signals (0-100%)
Trend Strength: Required trend score when filter is on
📈 Trading Strategies
Conservative Approach
Use Dynamic method with Trend Filter ON
Set minimum score to 80%
Risk:Reward ratio of 2:1 or higher
Best for: Swing trading
Aggressive Approach
Use Hybrid method with Trend Filter OFF
Set minimum score to 60%
Risk:Reward ratio of 1:1
Best for: Day trading
Scalping Setup
Use Volatility method
Set sensitivity to 2.0+
Focus on Target 1 only
Best for: Quick trades
🎨 Visual Customization
Color Themes:
Neon: Bright cyan/magenta for dark backgrounds
Ocean: Cool blues and teals
Solar: Warm yellows and oranges
Matrix: Classic green terminal look
Gradient: Smooth color transitions
Line Styles:
Solid: Clean, simple line
Glow: Adds depth with glow effect
Pulse: Animated breathing effect
Wave: Oscillating wave pattern
💡 Pro Tips
Start with the Trend Filter ON to avoid catching falling knives
Higher quality scores (80%+) have better win rates but fewer signals
Use Volume Profile method near major support/resistance levels
Combine with your favorite momentum indicator for confirmation
The pulse animation can help draw attention to key levels
⚠️ Important Notes
This indicator identifies potential entries, not guaranteed profits
Always use proper risk management
Works best on liquid instruments with good volume
Backtest your settings before live trading
Not financial advice - use at your own risk
📊 Statistics Panel
The live statistics panel shows:
Current detection method
Support level value
Trend direction
Distance from support
Current signal status
🤝 Support
Created by AlphaNatt
For questions or suggestions, please comment below!
Happy dip hunting! 🎯
Not financial advice, always do your own research

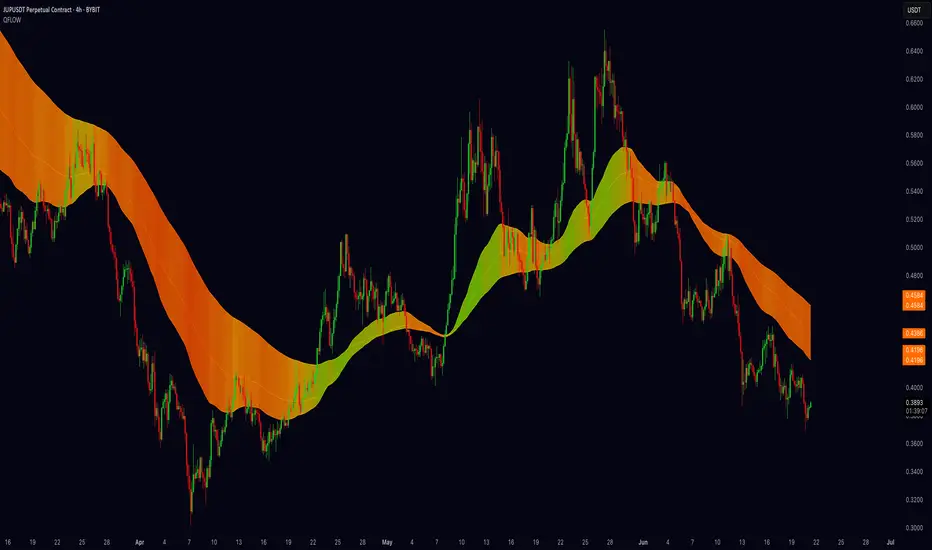
Quantum Fibonacci Flow
Quantum Fib Ribbon (QFLOW)
📖 How It Works
A three-band ribbon built from Fibonacci-scaled moving averages, filled and colored to reflect current momentum strength and direction.
Green when bullish flow is strong, red when bearish flow dominates, and orange in between to highlight slowing momentum.
⚙️ Key Controls
* Base Length: Adjusts the ribbon’s overall lookback.
* Ribbon Opacity: How solid or translucent the fill appears.
* Momentum Scale & Exponent: Fine-tune how sensitively the ribbon reacts to price speed versus volatility.
* Override Threshold: Determines at what momentum level the ribbon “snaps” to full green or red.
🚨 Over-Extension Logic
When price extends significantly above or below the ribbon, it often signals exhaustion.
The first return to the ribbon after such an extension frequently acts as strong support or resistance — offering high-probability trade setups.
🔺 Optional Trade Signals
Enable the over-extension alert to mark these key areas:
* A green triangle shows price extended below the ribbon, then retested → potential long.
* A red triangle shows price extended above, then retested → potential short.
🎯 How to Trade
• Breakout-Retest Setup: Watch for over-extended price moves. The first comeback to the ribbon often marks key levels of interest for a reversal or continuation.
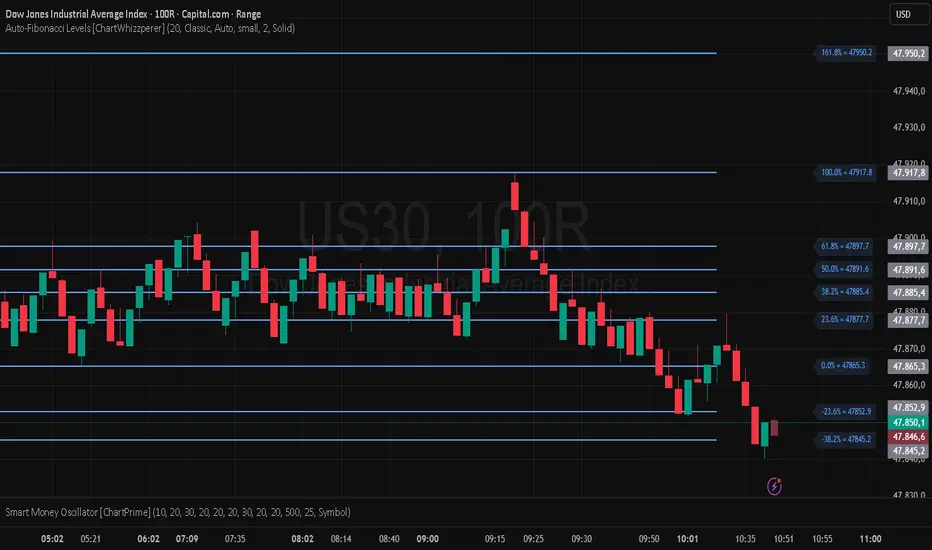
Auto-Fibonacci Levels [ChartWhizzperer]Auto-Fibonacci Levels
Discover one of the most elegant and flexible Fibonacci indicators for TradingView – fully automatic, tastefully understated, and built entirely in Pine Script V6.
Key Features:
- Automatically detects the most recent swing high and swing low.
- Plots Fibonacci retracement levels and extensions (including 161.8%, 261.8%) perfectly aligned
to the prevailing trend.
- Distinctive, dashed lines with crystal-clear price labels right at the price scale
for maximum clarity.
- Line length and label offset are fully customisable for your charting preference.
- Absolutely no repainting: Only confirmed swings are used for reliable signals.
- Parameter: "Swing Detection Length"
The “Swing Detection Length” parameter determines how many bars must appear to the left and right of a potential high or low for it to be recognised as a significant swing point.
- Higher values make the script less sensitive (only major turning points are detected).
- Lower values make it more responsive to minor fluctuations (more fibs, more signals).
For best results, adjust this setting according to your preferred timeframe and trading style.
Pro Tip:
Fibonacci levels refresh automatically whenever a new swing is confirmed.
Ideal for price action enthusiasts and Fibonacci purists alike.
Licence:
// Licence: CC BY-NC-SA 4.0 – Non-commercial use only, attribution required.
// © ChartWhizzperer
Volume VA with POC Based Percent DeviationsThis is a slightly different take on my previous version that plotted fibonacci retracement levels based on the POC to value area high/low.
This indicator is also based on the volume value area that plots developing POC, VAH, and VAL as well as historical levels. However, instead of plotting fib levels, this script automatically projects percentage deviation levels from the current POC. This can help identify potential overextensions, target areas, or mean-reversion setups.
Knowing where price is and the change in price relative to areas of interest can help identify true value and market imbalances. Hence the name VALUE AREA :)
The percent deviation levels are dynamically plotted in relation to the developing POC. As POC shifts so do the % levels.
Gradient Value Area Fill: Instead of a static color, the Value Area is filled with a dynamic gradient. The adjustable color and transparency shift is based on the current price's distance from the POC, giving you an intuitive feel for where price is relative to the POC.
Enjoy!
"May the fourth leaf bring you extra luck!" 🍀

SPX Weekly Expected Moves# SPX Weekly Expected Moves Indicator
A professional Pine Script indicator for TradingView that displays weekly expected move levels for SPX based on real options data, with integrated Fibonacci retracement analysis and intelligent alerting system.
## Overview
This indicator helps options and equity traders visualize weekly expected move ranges for the S&P 500 Index (SPX) by plotting historical and current week expected move boundaries derived from weekly options pricing. Unlike theoretical volatility calculations, this indicator uses actual market-based expected move data that you provide from options platforms.
## Key Features
### 📈 **Expected Move Visualization**
- **Historical Lines**: Display past weeks' expected moves with configurable history (10, 26, or 52 weeks)
- **Current Week Focus**: Highlighted current week with extended lines to present time
- **Friday Close Reference**: Orange baseline showing the previous Friday's close price
- **Timeframe Independent**: Works consistently across all chart timeframes (1m to 1D)
### 🎯 **Fibonacci Integration**
- **Five Fibonacci Levels**: 23.6%, 38.2%, 50%, 61.8%, 76.4% between Friday close and expected move boundaries
- **Color-Coded Levels**:
- Red: 23.6% & 76.4% (outer levels)
- Blue: 38.2% & 61.8% (golden ratio levels)
- Black: 50% (midpoint - most critical level)
- **Current Week Only**: Fibonacci levels shown only for active trading week to reduce clutter
### 📊 **Real-Time Information Table**
- **Current SPX Price**: Live market price
- **Expected Move**: ±EM value for current week
- **Previous Close**: Friday close price (baseline for calculations)
- **100% EM Levels**: Exact upper and lower boundary prices
- **Current Location**: Real-time position within the EM structure (e.g., "Above 38.2% Fib (upper zone)")
### 🚨 **Intelligent Alert System**
- **Zone-Aware Alerts**: Separate alerts for upper and lower zones
- **Key Level Breaches**: Alerts for 23.6% and 76.4% Fibonacci level crossings
- **Bar Close Based**: Alerts trigger on confirmed bar closes, not tick-by-tick
- **Customizable**: Enable/disable alerts through settings
## How It Works
### Data Input Method
The indicator uses a **manual data entry approach** where you input actual expected move values obtained from options platforms:
```pinescript
// Add entries using the options expiration Friday date
map.put(expected_moves, 20250613, 91.244) // Week ending June 13, 2025
map.put(expected_moves, 20250620, 95.150) // Week ending June 20, 2025
```
### Weekly Structure
- **Monday 9:30 AM ET**: Week begins
- **Friday 4:00 PM ET**: Week ends
- **Lines Extend**: From Monday open to Friday close (historical) or current time + 5 bars (current week)
- **Timezone Handling**: Uses "America/New_York" for proper DST handling
### Calculation Logic
1. **Base Price**: Previous Friday's SPX close price
2. **Expected Move**: Market-derived ±EM value from weekly options
3. **Upper Boundary**: Friday Close + Expected Move
4. **Lower Boundary**: Friday Close - Expected Move
5. **Fibonacci Levels**: Proportional levels between Friday close and EM boundaries
## Setup Instructions
### 1. Data Collection
Obtain weekly expected move values from options platforms such as:
- **ThinkOrSwim**: Use thinkBack feature to look up weekly expected moves
- **Tastyworks**: Check weekly options expected move data
- **CBOE**: Reference SPX weekly options data
- **Manual Calculation**: (ATM Call Premium + ATM Put Premium) × 0.85
### 2. Data Entry
After each Friday close, update the indicator with the next week's expected move:
```pinescript
// Example: On Friday June 7, 2025, add data for week ending June 13
map.put(expected_moves, 20250613, 91.244) // Actual EM value from your platform
```
### 3. Configuration
Customize the indicator through the settings panel:
#### Visual Settings
- **Show Current Week EM**: Toggle current week display
- **Show Past Weeks**: Toggle historical weeks display
- **Max Weeks History**: Choose 10, 26, or 52 weeks of history
- **Show Fibonacci Levels**: Toggle Fibonacci retracement levels
- **Label Controls**: Customize which labels to display
#### Colors
- **Current Week EM**: Default yellow for active week
- **Past Weeks EM**: Default gray for historical weeks
- **Friday Close**: Default orange for baseline
- **Fibonacci Levels**: Customizable colors for each level type
#### Alerts
- **Enable EM Breach Alerts**: Master toggle for all alerts
- **Specific Alerts**: Four alert types for Fibonacci level breaches
## Trading Applications
### Options Trading
- **Straddle/Strangle Positioning**: Visualize breakeven levels for neutral strategies
- **Directional Plays**: Assess probability of reaching target levels
- **Earnings Plays**: Compare actual vs. expected move outcomes
### Equity Trading
- **Support/Resistance**: Use EM boundaries and Fibonacci levels as key levels
- **Breakout Trading**: Monitor for moves beyond expected ranges
- **Mean Reversion**: Look for reversals at extreme Fibonacci levels
### Risk Management
- **Position Sizing**: Gauge likely price ranges for the week
- **Stop Placement**: Use Fibonacci levels for logical stop locations
- **Profit Targets**: Set targets based on EM structure probabilities
## Technical Implementation
### Performance Features
- **Memory Managed**: Configurable history limits prevent memory issues
- **Timeframe Independent**: Uses timestamp-based calculations for consistency
- **Object Management**: Automatic cleanup of drawing objects prevents duplicates
- **Error Handling**: Robust bounds checking and NA value handling
### Pine Script Best Practices
- **v6 Compliance**: Uses latest Pine Script version features
- **User Defined Types**: Structured data management with WeeklyEM type
- **Efficient Drawing**: Smart line/label creation and deletion
- **Professional Standards**: Clean code organization and comprehensive documentation
## Customization Guide
### Adding New Weeks
```pinescript
// Add after market close each Friday
map.put(expected_moves, YYYYMMDD, EM_VALUE)
```
### Color Schemes
Customize colors for different trading styles:
- **Dark Theme**: Use bright colors for visibility
- **Light Theme**: Use contrasting dark colors
- **Minimalist**: Use single color with transparency
### Label Management
Control label density:
- **Show Current Week Labels Only**: Reduce clutter for active trading
- **Show All Labels**: Full information for analysis
- **Selective Display**: Choose specific label types
## Troubleshooting
### Common Issues
1. **No Lines Appearing**: Check that expected move data is entered for current/recent weeks
2. **Wrong Time Display**: Ensure "America/New_York" timezone is properly handled
3. **Duplicate Lines**: Restart indicator if drawing objects appear duplicated
4. **Missing Fibonacci Levels**: Verify "Show Fibonacci Levels" is enabled
### Data Validation
- **Expected Move Format**: Use positive numbers (e.g., 91.244, not ±91.244)
- **Date Format**: Use YYYYMMDD format (e.g., 20250613)
- **Reasonable Values**: Verify EM values are realistic (typically 50-200 for SPX)
## Version History
### Current Version
- **Pine Script v6**: Latest version compatibility
- **Fibonacci Integration**: Five-level retracement analysis
- **Zone-Aware Alerts**: Upper/lower zone differentiation
- **Dynamic Line Management**: Smart current week extension
- **Professional UI**: Comprehensive information table
### Future Enhancements
- **Multiple Symbols**: Extend beyond SPX to other indices
- **Automated Data**: Integration with options data APIs
- **Statistical Analysis**: Success rate tracking for EM predictions
- **Additional Levels**: Custom percentage levels beyond Fibonacci
## License & Usage
This indicator is designed for educational and trading purposes. Users are responsible for:
- **Data Accuracy**: Ensuring correct expected move values
- **Risk Management**: Proper position sizing and risk controls
- **Market Understanding**: Comprehending options-based expected move concepts
## Support
For questions, issues, or feature requests related to this indicator, please refer to the code comments and documentation within the Pine Script file.
---
**Disclaimer**: This indicator is for informational purposes only. Trading involves substantial risk of loss and is not suitable for all investors. Past performance does not guarantee future results.

Hot Zones Indicator [ChartPrime]Hot Zones (Basic) is a precision-engineered confluence detection system that identifies statistically significant price reaction zones by mapping retracement levels enriched with structural, volumetric, and momentum-based overlays. In contrast to static Fibonacci tools, this system dynamically synchronizes a custom volume-weighted average price inspired overlay and localized oscillator signals to produce probabilistically favorable “hot zones” that respond to real-time market structure.
These zones are visually enhanced when multiple dimensions of market confluence align—such as volume-weighted price agreement, structural symmetry, and volatility-based momentum extremes—allowing for immediate prioritization of high-probability reaction areas.
Core Concept
The system autonomously detects impulse-correction phases within the price series using directional breakout logic and multi-bar structural analysis. Once a valid trend leg is established, standard retracement levels are plotted along the vector. These levels are continuously evaluated against live price interaction, volume alignment, and momentum state.
Swing Initialization Logic
Automated Structural Anchoring: Swing points are detected using fractal pivot analysis and breakout validation. The tool anchors retracement vectors to recent directional legs with the highest structural integrity.
Volume-Weighted Price Confluence
Two VWAP-derived overlays are applied:
Anchored Volume Level: Derived from the origin of the leg, reflecting the volume-weighted cost basis of major participants over the structural phase.
Internal VWAP: Triggered on intermediate pullbacks, mapping localized institutional activity through recursive anchoring logic.
When either curve aligns with a retracement level under live market conditions, the level is flagged as a high-confluence reaction zone.
Momentum & Volatility Filtering
A proprietary oscillator—optimized for mean deviation and multi-resolution smoothing—is integrated to quantify local volatility states and directional momentum.
The oscillator feeds into two distinct signal regimes:
Directional Crossovers: When a significant momentum shift occurs within a mapped levels, the zone is annotated accordingly with a directional labeling "⬆" or "⬇".
Momentum Extremes: OB/OS thresholds are used to detect compression or exhaustion states, enhancing zone validity under directional stress.
These signals are visually merged into the zone rendering, enabling contextual clarity at a glance.
Customization & Advanced Features
Individual fib levels can be toggled or styled per user preference.
Aesthetic properties (color, line width) are fully configurable.
An optional “Hacker Zone” region—highlighting retracement areas statistically associated with institutional accumulation also known as Golden Pocket — is available for advanced users.
Conclusion
Hot Zones by ChartPrime represents a multi-dimensional confluence engine, transforming traditional retracement mapping into a reactive, data-driven framework. By integrating structure, volume flow, and momentum analytics into a unified interface, it enhances discretionary and systematic trading decisions alike. Whether trading trend continuations, reversals, or liquidity anomalies, Hot Zones enables actionable clarity at structurally significant levels.

time-specific standard devs [keypoems]Time-Specific Net Change Percentage Standard Deviations Extensions
A candlestick is the story of how price moved during a single period: it opens, explores a high and a low, and finally closes.
The indicator asks one question:
“By what percentage did price change from open to close?”
That single percentage value – called the net-change % – is the raw material for everything that follows.
Why net-change % matters
If you collect that percentage for thousands of finished candles (daily candles, 1-hour, 4-hour – whatever you close) you get a probability distribution: most candles move only a little, a few move a lot. When you plot those percentages you get the familiar bell-curve. From any bell-curve you can read two key statistics:
Mean – the “typical” net-change.
Standard Deviation (σ) – how far a candle normally wanders from that mean.
A well-known property of a bell-curve is that ≈68 % of all observations stay between –1 σ and +1 σ, and ≈95 % stay within ±2 σ.
For traders that translates into a probabilistic map of where an unfinished candle is likely to close.
What the indicator draws
Open-anchored levels
Every box is centred on the candle’s open price.
The indicator draws boxes that mark +σ, +½ σ, –½ σ, –σ … as selected in the Inputs.
Time-specific calculation
Instead of mixing all 1-hour candles together, the script isolates only the 09:00-10:00 New-York hour (or any other slot you are at that moment) and builds a bell-curve from that subset.
The result is a set of expectations truly tailored to that exact hour’s behaviour.
Generic and Specific Std Dev Box
Indicator computes both generic levels – the classic “all candles aggregated” standard deviations, and specific levels – the refined, hour-by-hour (or 4-hour-by-4-hour, etc.) deviations.
The indicator shows Boxes that represent both aggregated values and "per period" standard deviation projection levels.
Mirrored levels (optional)
Negative σ levels are drawn automatically so you have symmetrical upside & downside projections.
Math behind the scenes
For each chosen higher-timeframe (HTF):
Collect the last N net-change % values (user-defined look-back, default 5 000 candles).
Compute:
μ = mean(net-change %)
σ = stdev(net-change %)
Project prices:
LevelPrice = Open × (1 + k × σ)
where k is 0 , ±0.5 , ±1 , ±1.5 … as enabled in the inputs.
Because everything is done in percentage space the technique adapts automatically to instruments that trade at very different absolute prices (equities, futures, crypto, FX).
How to read it in real time
When a developing candle races straight into +1 σ with plenty of time left, statistics say “68 % of the time it will finish back inside the box.”
A tag of +2 σ is an even rarer event (~5 % probability) – a natural place to look for exhaustion or take-profit cues.
Conversely, if price refuses to reverse at +1 σ and instead sticks above that edge, it is signalling an unusually strong session and may warrant trend-continuation tactics.
Key Inputs
Higher Timeframe Choose 5m to H8 reference frame
Show levels for last X periods
Look-back length Sample size for σ
StdDev Fibs Fib1 … Fib9 toggles & values: Decide which σ multiples to plot
Mirror levels Draw matching negative projections
Extend boxes Keep boxes visible beyond their candle
Best-practice usage
Combine with structure – treat σ edges as context, not automatic entry.
Mind the sample size – if you choose extremely narrow windows (e.g., Sunday 18:00-19:00 futures open) make sure your look-back still captures hundreds of cases.
Disclaimer
Trading involves risk. The author and this indicator simply display historical probability ranges; they do not assure profits or prevent losses. Always perform your own due diligence and, if necessary, consult a licensed financial professional before dealing in any financial instrument.

BK AK-Scope🔭 Introducing BK AK-Scope — Target Locked. Signal Acquired. 🔭
After building five precision weapons for traders, I’m proud to unveil the sixth.
BK AK-Scope — the eye of the arsenal.
This is not just an indicator. It’s an intelligence system for volatility, signal clarity, and rate-of-change dynamics — forged for elite vision in any market terrain.
🧠 Why “Scope”? And Why “AK”?
Every shooter knows: you can’t hit what you can’t see.
The Scope brings range, clarity, and target distinction. It filters motion from noise. Purpose from panic.
“AK” continues to honor the man who trained my sight — my mentor, A.K.
His discipline taught me to wait for alignment. To move with reason, not emotion.
His vision lives in every code line here.
🔬 What Is BK AK-Scope?
A Triple-Tier TSI Correlation Engine, fused with adaptive opacity logic, a volatility scoring system, and real-time signal clarity. It’s momentum dissected — by speed, depth, and rate of change.
Built to serve traders who:
Need visual hierarchy between fast, mid, and slow TSI responses.
Want adaptive fills that pulse with volatility — not static zones.
Require a volatility scoring overlay that reads the battlefield in real time.
⚙️ Core Systems: How BK AK-Scope Works
✅ Fast/Mid/Slow TSI →
Three layers of correlation: like scopes with zoom levels.
You track micro moves, mid swings, and macro flow simultaneously.
✅ Rate-of-Change Adaptive Opacity →
Momentum fills fade or flash based on speed — giving you movement density at a glance.
Bull vs. Bear zones adapt to strength. You feel the market’s pulse.
✅ Volatility Score Intelligence →
Custom algorithm measuring:
Range expansion
Rate-of-change differentials
ATR dynamics
Standard deviation pressure
All combined into a score from 0–100 with live icons:
🔥 = Extreme Heat (70+)
🧊 = Cold Zone (<30)
⚠️ = ROC Warning
• = Neutral drift
✅ Auto-Detect Volatility Modes →
Scalp = <15min
Swing = intraday/hourly
Macro = daily/weekly
Or override manually with total control.
🎯 How To Use BK AK-Scope
🔹 Trend Continuation → When all three TSI layers align in direction + volatility score climbs, ride with the trend.
🔹 Early Reversals → Opposing TSI + rapid opacity change + volatility shift = sniper reversal zone.
🔹 Consolidation Filter → Neutral fills + score < 30 = stay out, wait for signal surge.
🔹 Signal Confluence → Pair with:
• Gann fans or angles
• Fib time/price clusters
• Elliott Wave structure
• Harmonics or divergence
To isolate entry perfection.
🛡️ Why This Indicator Changes the Game
It's not just momentum. It’s TSI with depth hierarchy.
It’s not just color. It’s real-time strength visualization.
It’s not just volatility. It’s rate-weighted market intelligence.
This is market optics for the advanced trader — built for vision, clarity, and discipline.
🙏 Final Thoughts
🔹 In honor of A.K., my mentor. The man who taught me to see what others miss.
🔹 Inspired by the power of vision — because execution without clarity is chaos.
🔹 Powered by faith — because Gd alone gives sight beyond the visible.
“He gives sight to the blind and wisdom to the humble.” — Psalms 146
Every tool I build is a prayer in code — that it helps someone trade with clarity, integrity, and precision.
⚡ Zoom In. Focus Deep. Trade Clean.
BK AK-Scope — Lock on the target. See what others don’t.
🔫 Clarity is power. 🔫
Gd bless. 🙏

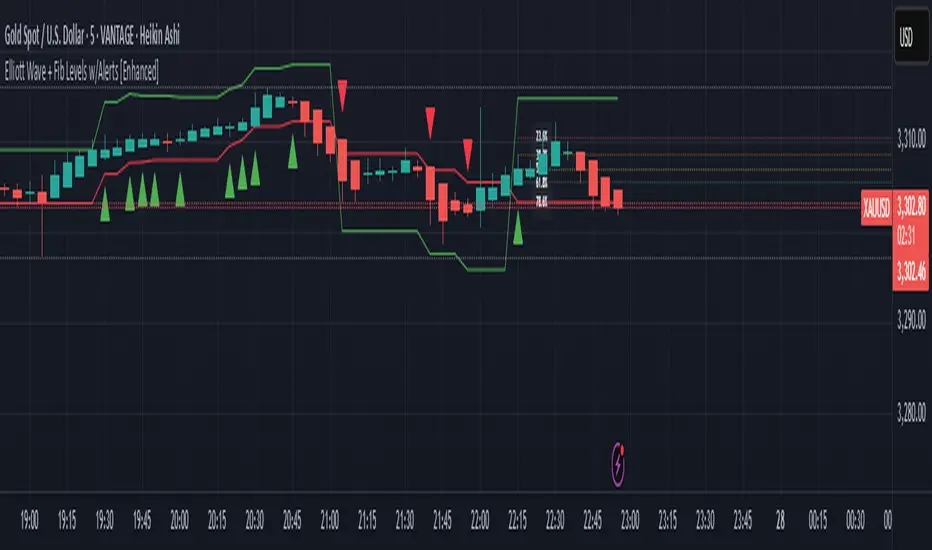
Elliott Wave + Fib Levels w/Alerts [Enhanced]Elliott Wave + Fibonacci Levels with Alerts
This powerful TradingView indicator combines Elliott Wave detection with customizable Fibonacci retracement levels to help identify key price zones and potential trade opportunities. It automatically detects bullish and bearish waves based on recent highs and lows, with an optional EMA filter to improve trend accuracy.
Key features include:
Dynamic detection of Elliott Waves based on configurable wave length.
Visualization of Fibonacci retracement levels on detected waves, with customizable percentage levels and optional labels for clarity.
ATR-based automatic calculation of stop loss and take profit levels with adjustable multipliers.
Real-time alerts triggered on new wave formations, indicating bullish or bearish setups with precise entry price details.
Clean plotting of entry signals, stop loss, and take profit zones directly on the chart.
User-friendly input controls to tailor the indicator to your trading style, including options to toggle EMA filtering, Fibonacci level display, and alert activation.
Ideal for traders looking to combine classic wave analysis with Fibonacci support/resistance levels and actionable trade alerts, this indicator streamlines technical analysis and trade management in one easy-to-use tool.
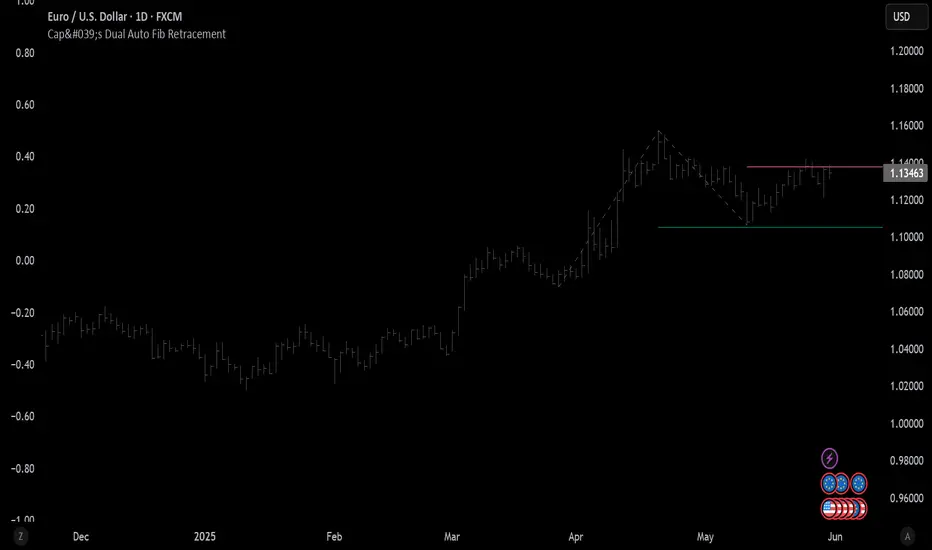
Cap's Dual Auto Fib RetracementThis will draw both a bullish retracement and a bearish retracement. It's defaulted to just show the 0.618 level as I feel like this is the "make or break" level.
- A close below the bullish 0.618 retracement would be considered very bearish.
- A close above the bearish 0.618 would be considered very bullish.
(You can still configure whichever levels you want, however.)
This script was removed by TradingView last time it was published. I couldn't find another script that would provide both bearish/bullish retracements, so I'm assuming this is "original" enough. Maybe it was removed because the description wasn't long enough, so...
Detailed Description:
This indicator automatically plots Fibonacci retracement levels based on zigzag pivot points for both bullish (low-to-high) and bearish (high-to-low) price movements. It identifies key pivot points using a customizable deviation multiplier and depth setting, then draws Fibonacci levels (0, 0.236, 0.382, 0.5, 0.618, 0.786, 1) with user-defined visibility and colors for each level.
Features:
Deviation: Adjusts sensitivity for detecting pivots (default: 2).
Depth: Sets minimum bars for pivot calculation (default: 10).
Extend Lines: Option to extend lines left, right, or both.
Show Prices/Levels: Toggle price and level labels, with options for value or percentage display.
Labels Position: Choose left or right label placement.
Background Transparency: Customize fill transparency between levels.
Alerts: Triggers when price crosses any Fibonacci level.
Usage: Apply to any chart to visualize potential support/resistance zones. Adjust settings to suit your trading style. Requires sufficient data; use lower timeframes or reduce depth if pivots are not detected.
Note: This is a technical analysis tool and does not provide trading signals or financial advice. Always conduct your own research.
Fibonacci & Volume Bell CurveBell Curve + Fibonacci Retracement
This custom indicator combines Fibonacci retracement levels with volume-weighted statistics (VWAP Bell Curve) to provide high-probability trading signals.
Indicator Components:
Fibonacci Retracement
Key Level Used:
Cyan (61.8%) – Golden Ratio: Most significant for identifying potential reversals.
Volume-Weighted Bell Curve (VWAP Bands)
White Line – VWAP (Volume Weighted Average Price).
Orange Bands (±2σ) – Represent two standard deviations above and below VWAP. Indicates the range where approximately 95% of volume-weighted price action occurs.
Trading Strategies:
Support & Resistance Trading
Fibonacci levels act as dynamic support/resistance.
The 61.8% level is especially effective for spotting reversal opportunities.
VWAP Mean Reversion
When price moves outside the ±2σ orange bands, expect a reversion back to the white VWAP line.
High-probability trades occur when price is extended to extremes.
Confluence Trading (High-Probability Setups). Strongest signals occur when Fibonacci levels align with VWAP bands. Look for overlap between Fib levels and VWAP support/resistance zones.
Pro Tips for Best Results:
Volume Confirmation: Look for increased volume at key levels for stronger signals.
Timeframes: Effective on all timeframes; higher timeframes offer more reliable signals.
Market Context: Always consider overall market direction and news events.
Multiple Touches: Levels become more valid when tested multiple times.
My settings:
Fibonacci Settings
Lookback Period: 50
Swing Detection Sensitivity: 5
Show Fibonacci Labels: ✅ Enabled
Bell Curve (VWAP Bands) Settings
Bell Curve Period: 100
VWAP Source: (H + L + C) / 3 (typical price)
Show Bell Curve Bands: ✅ Enabled
Confidence Levels: 2 Standard Deviations (±2σ)
Visual Settings
Fibonacci Line Width: 2
Bell Curve Line Width: 2
Extend Lines Right: ✅ Enabled
Fibonacci Levels
61.8% – ✅ Enabled, Color: Bright Blue
Other levels are disabled
VWAP & Bell Curve Bands
VWAP (White Line) – ✅ Enabled
Upper 1 SD – ✅ Enabled, Color: Gray
Lower 1 SD – ✅ Enabled, Color: Gray
Upper 2 SD – ✅ Enabled, Color: Orange-Red (with transparency)
Lower 2 SD – ✅ Enabled, Color: Orange-Red (with transparency)

VWAP Fibonacci S&R with Bell CurveThis indicator is a sophisticated trading tool that combines three powerful technical analysis concepts to identify high-probability trading opportunities. Let me break down how it works:
Core Components:
1. VWAP (Volume Weighted Average Price)
Calculates the average price weighted by volume over a specified period
Acts as a dynamic support/resistance level that institutions often use
Can reset daily, weekly, or monthly depending on your trading timeframe
The yellow line on your chart represents the current VWAP
2. Bell Curve Probability Analysis
Measures how far the current price deviates from the VWAP in statistical terms
Calculates a Z-score (standard deviations away from the mean)
Creates probability bands around the VWAP based on price volatility
The theory: extreme deviations from VWAP tend to revert back to the mean
3. Fibonacci Retracement Levels
Uses recent highs and lows to calculate key Fibonacci levels (38.2%, 50%, 61.8%)
These levels often act as support and resistance zones
Combined with VWAP analysis for confluence trading
How the Signals Work:
BUY Signals (Green arrows below candles)
Generated when either condition is met:
Mean Reversion Buy: Price is below VWAP + high probability of reversion + extreme statistical deviation
Fibonacci Support Buy: Price is above VWAP + near key Fibonacci support levels (38.2% or 50%)
SELL Signals (Red arrows above candles)
Generated when either condition is met:
Mean Reversion Sell: Price is above VWAP + high probability of reversion + extreme statistical deviation
Fibonacci Resistance Sell: Price is below VWAP + near key Fibonacci resistance levels (61.8% or 50%)
Visual Elements
Yellow Line: Main VWAP
Blue Bands: Probability zones based on standard deviation
Orange/White/Purple Lines: Key Fibonacci levels (38.2%, 50%, 61.8%)
Yellow Background: High probability mean reversion zones
⚠ Symbol: Extreme deviation warning (Z-score > 2.5)
The Information Table
Shows real-time statistics:
VWAP: Current VWAP value
Distance: How far price is from VWAP (percentage)
Z-Score: Statistical measure of deviation (>2 is significant)
Reversion %: Probability of mean reversion
Fib 50%: Key Fibonacci midpoint level
Status: Current signal state
Trading Logic
The indicator works on the principle that:
Extreme deviations from VWAP are unsustainable and tend to revert
Fibonacci levels provide natural support/resistance zones
Volume confirmation ensures the move has institutional backing
Statistical probability helps time entries when odds are favorable
Best Use Cases
Scalping: Quick mean reversion trades when price gets too far from VWAP
Swing Trading: Using Fibonacci levels with VWAP for longer-term positions
Risk Management: Avoiding trades when probability is low
Confluence Trading: Waiting for multiple signals to align

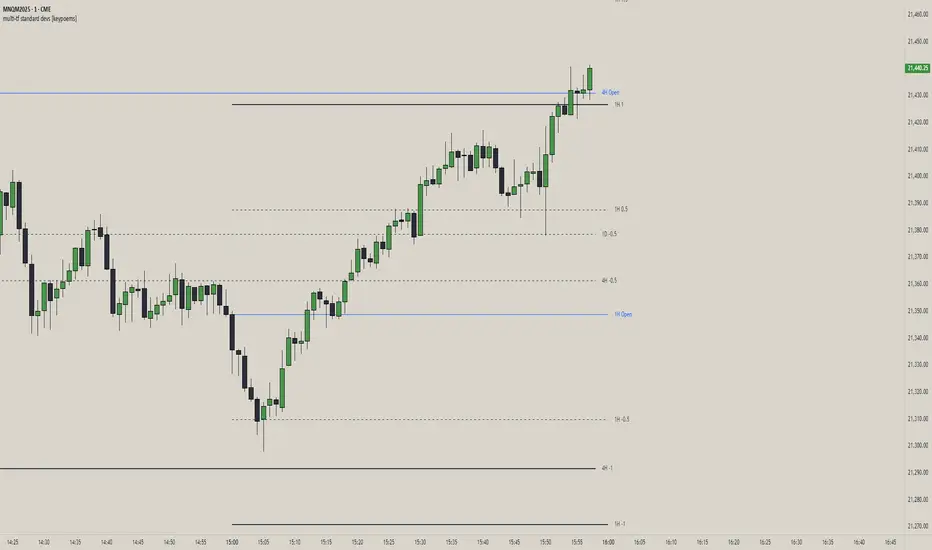
multi-tf standard devs [keypoems]Multi-Timeframe Standard Deviations Levels
A visual map of “how far is too far” across any three higher time-frames.
1. What it does
This script plots dynamic price “rails” built from standard deviation (StDev)—the same math that underpins the bell curve—on up to three higher-time-frames (HTFs) at once.
• It measures the volatility of intraday open-to-close increments, reaching back as far as 5000 bars (≈ 20 years on daily data).
• Each HTF can be extended to the next session or truncated at session close for tidy dashboards.
• Lines can be mirrored so you see symmetric positive/negative bands, and optional background fills shade the “probability cone.”
Because ≈ 68 % of moves live inside ±1 StDev, ≈ 95 % inside ±2, and ≈ 99.7 % inside ±3, the plot instantly shows when price is statistically stretched or compressed.
3. Key settings
Higher Time-Frame #1-3 Turn each HTF on/off, pick the interval (anything from 1 min to 1 year), and decide whether lines should extend into the next period.
Show levels for last X days Keep your chart clean by limiting how many historical sessions are displayed (1-50).
Based on last X periods Length of the StDev sample. Long look-backs (e.g. 5 000) iron-out day-to-day noise; short look-backs make the bands flex with recent volatility.
Fib Settings Toggle each multiple, line thickness/style/colour, label size, whether to print the numeric level, the live price, the HTF label, and whether to tint the background (choose your own opacity).
4. Under-the-hood notes
StDev is calculated on (close – open) / open rather than absolute prices, making the band width scale-agnostic.
Watch for tests of ±1:
Momentum traders ride the breakout with a target at the next band.
Mean-reversion traders wait for the first stall candle and trade back to zero line or VWAP.
Bottom line: Multi-Timeframe Standard-Deviations turns raw volatility math into an intuitive “price terrain map,” helping you instantly judge whether a move is ordinary, stretched, or extreme—across the time-frames that matter to you.
Original code by fadizeidan and stats by NQStats's ProbableChris.
Swing Point Indicator🔍 How does it work?
He looks at a candle and compares it with a number of candles to the left and right.
If that candle is the highest of that group, then it is a swing high.
If that candle is the lowest, then it is a swing low.
📈 What do you use it for?
Reading market structure:
You can easily see higher highs / higher lows (bullish structure)
Or lower highs / lower lows (bearish structure)
Determining BOS & CHoCH:
If a new swing low breaks below the previous one → Break of Structure (BOS)
If you go from HH/HL to LH/LL → Change of Character (CHoCH)
Finding entry and exit points:
You know where to expect price reactions (at swing points)
Good for pullback entries or stop loss placement
Drawing smart zones:
You can draw from swing high to swing low for Fibs, order blocks or S&D zones
*** Translated with www.DeepL.com (free version) ***

Apex Edge - MTF Confluence PanelApex Edge – MTF Confluence Panel
Description:
The Apex Edge – MTF Confluence Panel is a powerful multi-timeframe analysis tool built to streamline trade decision-making by aggregating key confluences across three user-defined timeframes. The panel visually presents the state of five core market signals—Trend, Momentum, Sweep, Structure, and Trap—alongside a unified Score column that summarizes directional bias with clarity.
Traders can customize the number of bullish/bearish conditions required to trigger a score signal, allowing the tool to be tailored for both conservative and aggressive trading styles. This script is designed for those who value a clean, structured, and objective approach to identifying market alignment—whether scalping or swing trading.
How it Works:
Across each of the three selected timeframes, the panel evaluates:
Trend: Based on a user-configurable Hull Moving Average (HMA), the script compares price relative to trend to determine bullish, bearish, or neutral bias.
Momentum: Uses OBV (On-Balance Volume) with volume spike detection to identify bursts of strong buying or selling pressure.
Sweep: Detects potential liquidity grabs by identifying price rejections beyond prior swing highs/lows. A break below a previous low with reversal signals bullish intent (and vice versa for bearish).
Structure: Uses dynamic pivot-based logic to identify market structure breaks (BOS) beyond recent confirmed swing levels.
Trap: Flags potential false moves by measuring RSI overbought/oversold signal clusters combined with minimal price movement—highlighting exhaustion or deceptive breaks.
Score: A weighted consensus of the above components. The number of required confluences to trigger a score (default: 3) can be set by the user via input, offering flexibility in signal sensitivity.
Why It’s Useful for Traders:
Quick Decision-Making: The color-coded panel provides instant visual feedback on whether confluences align across timeframes—ideal for fast-paced environments like scalping or high-volatility news sessions.
Multi-Timeframe Confidence: Helps eliminate guesswork by confirming whether higher and lower timeframe conditions support your trade idea.
Customizability: Adjustable confluence threshold means traders can fine-tune how sensitive the system is—more signals for faster entries, stricter confluence for higher conviction trades.
Built-In Alerts: Automated alerts for score alignment, trap detection, and liquidity sweeps allow traders to stay informed even when away from the screen.
Strategic Edge: Supports directional bias confirmation and trade filtering with logic designed to mimic professional decision-making workflows.
Features:
Clean, real-time confluence table across three user-selected timeframes
Configurable score sensitivity via “Minimum Confluences for Score” input
Cell-based colour coding for at-a-glance trade direction
Built-in alerts for score alignment, traps, and sweep triggers
Note - This Indicator works great in sync with Apex Edge - Session Sweep Pro
Useful levels for TP = previous session high/low boxes or fib levels.
⚠️ Disclaimer:
This script is for informational and educational purposes only and should not be considered financial advice. Always perform your own due diligence and practice proper risk management when trading.
