Custom Pattern DetectionOverview
Chart Patterns is a major tool for many traders. Pattern formation at specific location on the chart is used for investment/trading decisions.
This indicator is designed in a way to allow investors/traders to define patterns of their choice based on certain input parameters and then detect defined pattern on the chart.
Investors/traders can use their own creativity to create and detect patterns.
This indicator works in 2 modes
Create Pattern: One can define a pattern and verify sample pattern formation visually
Detect Pattern: Detect and mark patterns on the chart
Settings
Create Custom Pattern:
Show Custom Pattern – This will mark the pattern lines on the chart so that one can verify how pattern appears based on the input’s parameters provided for lines XA, AB, BC, CD, DE, EF
Offset – Used while pattern creation. Offset is horizonal distance between 2 lines.
XA Points – Used to draw XA line when sample pattern is drawn. XA points can be a negative or position number.
XA line is drawn based on Offset and XA Points. E.g. Offset = 5 and XA Points = -20. In this line would be drawn from last candle high to high – 20 (these are y1 and y2 points of a line). While drawing line distance of 5 candles would be placed between 2 line points (these are x1 and x2 points of a line). In XA line X forms start point and A forms end point of the line.
Line AB – Line AB is drawn from point X. To derive the end point of AB, average Fib% is derived based on From Fib% and To Fib% parameters. Finally end point is derived by applying Fib Retracement on Line XA based on average Fib%.
Line AB to Line EF – These points are derived as explained in Line AB.
The indicator can be used to define/create patterns up to 6 legs/lines. The line would be named as XA -> AB -> BC -> CD -> DE -> EF.
If one wish to create pattern consisting 3 legs then it can be achieved by unchecking/deselecting Line CD, DE and EF or by checking only Line AB and BC.
Based on the parameters above indicator draws a sample pattern after last candle/bar on the chart. Sample pattern helps to visually see how pattern will appear on the chart.
Pattern Identification
Indicator derive the swing high/low points based on the Pivot lookback and use as reference points while detecting patterns.
Use of From Fib% and To Fib% - While detecting pattern, retracement price points are derived for From Fib% and To Fib%. Price points between from Fib% and To Fib% are treated as valid retracement points.
How to configure and use indicator for detecting patterns
Sample Pattern 1
Sample Pattern 2
Sample Pattern 3
Sample Pattern 4
Cari dalam skrip untuk "fib"

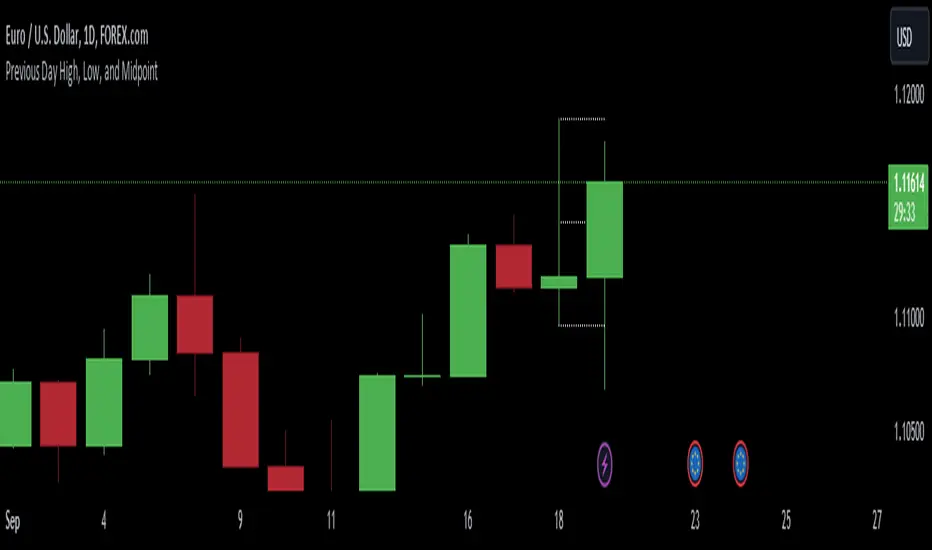
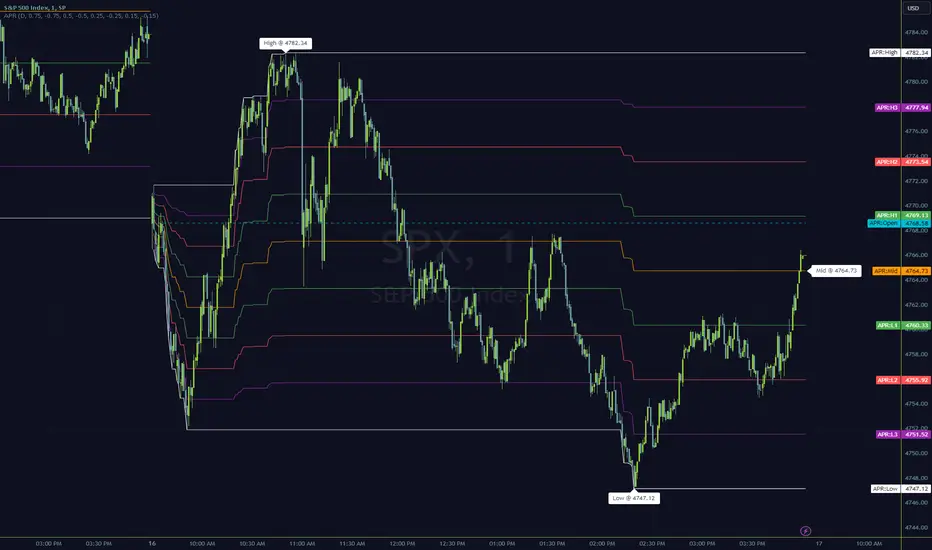
Previous Day High, Low, and Midpointshows yesterdays high low and midpoint elimainating the need to use the fib tool every day
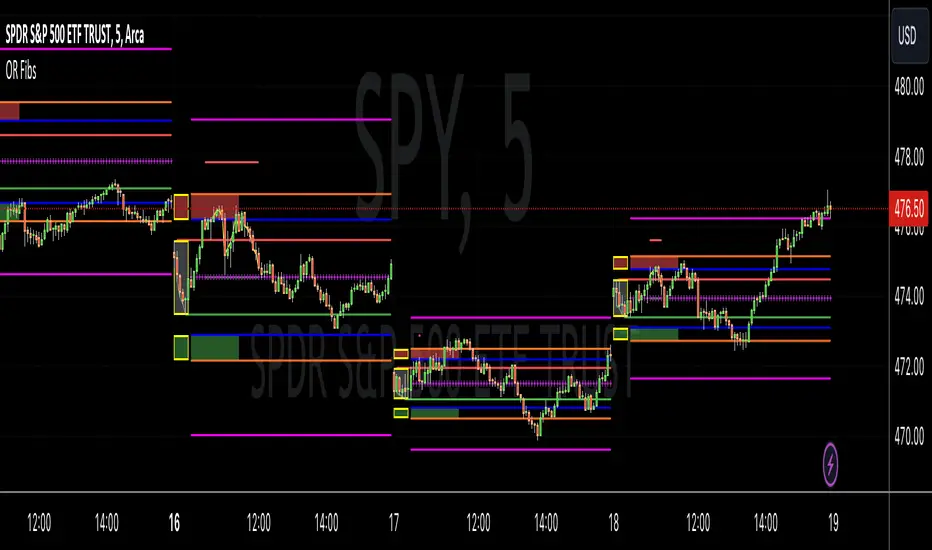
ORB - Alerts, VWAP and MACD Checks, Extended Fib Levels
ORB Range Alerter with Shading, VWAP Check, MACD Check, and Extended Fibonacci Levels for TP – Fully Customizable
This indicator is designed to give you a comprehensive analysis of the Opening Range Breakout (ORB) combined with advanced conditions based on VWAP and MACD indicators, along with Extended Fibonacci Levels for both long and short TP positions.
Key Features:
Opening Range Breakout (ORB):
Defines the opening range at the market open (9:30 AM by default) based on your chart timeframe and shades it for visibility.
The high and low of the first candle after the open are plotted on the chart, creating a breakout range that traders can use to identify potential long or short positions.
VWAP Condition (Optional):
This indicator includes the option to enforce the VWAP (Volume-Weighted Average Price) as a condition for entering trades.
- Longs will only trigger if the price is above VWAP (when enabled).
- Shorts will only trigger if the price is below VWAP (when enabled).
Customizable : You can enable or disable the VWAP condition through a simple checkbox in the indicator’s settings.
MACD Condition (Optional):
Includes an optional MACD (Moving Average Convergence Divergence) condition.
- Longs will only trigger if the MACD line is above 0 and the signal line, providing confirmation of bullish momentum.
- Shorts will only trigger if the MACD line is below 0 and the signal line, indicating bearish momentum.
Customizable : You can enable or disable the MACD condition through a checkbox in the indicator’s settings, allowing you to trade with or without the MACD confirmation.
Fibonacci Extensions for Profit Targets:
Automatically calculates Fibonacci extension levels based on the ORB range for TP levels.
These levels provide key areas for potential profit-taking or reversal points.
Fibonacci extensions are plotted only after a confirmed breakout, either long or short.
The extensions include 127.2%, 161.8%, 200%, 261.8%, 423.6%, and 685.4%, offering a comprehensive set of targets for different trading strategies.
Shading of ORB Range:
The ORB high and low are visually emphasized on the chart with a shaded area for easy identification.
The shading is semi-transparent to help keep your chart clean and easy to read.
Customizable Timeframe:
The ORB range is defined based on the time of day (default is 9:30 AM to 4:00 PM), but you can adjust the timeframe to suit different trading sessions or markets.
Alerts for Breakouts:
Built-in alerts notify you when price crosses above or below the ORB high or low, along with the optional VWAP and MACD conditions.
Alerts can be used to create automated notifications or even execute automated trades based on your chosen settings.
How to Use:
Long Trade Example: When the price crosses above the ORB high, VWAP is above the price, and MACD shows bullish momentum (if these conditions are enabled), a potential long entry is triggered. You can use the Fibonacci extensions for profit targets.
Short Trade Example: When the price crosses below the ORB low, VWAP is below the price, and MACD confirms bearish momentum (if these conditions are enabled), a short entry is triggered. Fibonacci levels for the short position can guide your exit strategy.
Flexibility: You can enable or disable both VWAP and MACD conditions based on your trading style. This flexibility allows the indicator to adapt to different market conditions and strategies.
Customization Options:
Enable/Disable VWAP Condition: Decide if you want to include VWAP as a trade filter.
Enable/Disable MACD Condition: Choose whether to require MACD as confirmation for trade entries.
Adjust ORB Timeframe: Customize the time range for defining the ORB based on the market you're trading.
Fibonacci Extensions: Visualize key profit targets using Fibonacci extensions, which are automatically calculated and displayed after a breakout.

Horizontal Lines 0.5, BY ROSHAN SINGHThis indicator identify support and resistance to trade in 1min time frame, based of fib 0.5 level, on 15 min time frame find major high and low means major swing, low will be our start level and high will be our end level input in setting, substract high and end level and now divide answer with 2 till the daily volatility of a index or stock, if saying about nifty suppose nifty daily travel minimum for 65 pts then interval will be 65 input in settings, now all horizontals lines means support and level will be plotted on chart, buy on support, sell on resistance

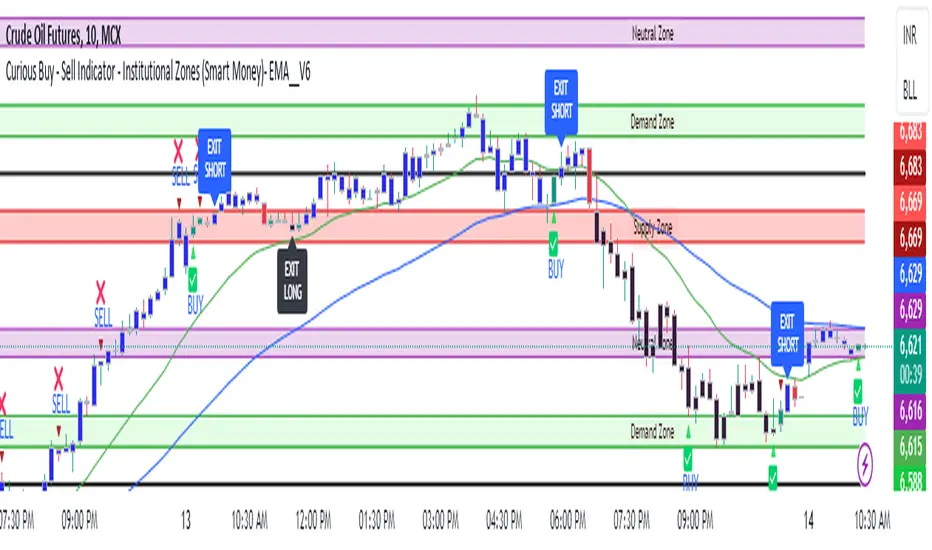
Curious Buy - Sell Indicator - Institutional Zones (Smart Money)How the Script Works:
1. The Scripts identifies Institutional Demand , Supply & Neutral Zones with FIBS on the scripts with Rectangle BOX with labels in advance. User can insert desired start and end value to plot institutional zones
2. Script generates BUY - SELL signals shape based on candle stick formation in live market and labels with BUY - SELL image for easy identification
3. Script gives pop message EXIT SHORT once Buy spotted and candle close above the buy signal and same way EXIT LONG once Sell spotted and candle close below the buy signal
4. Scripts identifies the candle closing above the BUY - SELL signals Eg - If buy spotted the candle closing above the BUY signal with display with BLUE color Candle same way for sell signal the candle closing below the sell signal candle with display with BLACK color candle.
5. Script spots fake signals which are not valid and can be ignored by the end user
6. Three EMA's 20,50,200 has implemented to identify the strength of the market
7. Scripts identifies OPEN = LOW & OPEN = HIGH candle stick to spot the Institutional BUY - SELL activity
8. The script provides visual clues on the chart to help users identify potential trading opportunities.
9. The script provides visual clues on the chart to help users identity potential trading opportunities in live market
10. The looks and parameters of the script can be modified by end user to customize and adapt to different strategy.
11. With the script user can check higher time frame DAILY \ WEEKLY BUY - SELL signals to plan intraday trades and plan safe BUY - SELL positions.
How Users Can Make Profit Using This Script:
1. Identify potential BUY - LONG opportunities: When a valid BUY is detected and condition is met, it is suggested to opening BUY position with stoploss below the BUY signal spotted candle.
Safe users can execute BUY position once BLUE COLOR candle is formed, Wait for pull back to reduce the stoploss
2. Identify potential SELL - SHORT opportunities: When a valid SELL is detected and condition is met, it suggests a potential opening SELL positions with stoploss above the BUY signal spotted candle. Safe users can execute SELL position once BLACK COLOR candle is formed, Wait for pull back to reduce the stoploss.
3. Script generated BUY - SELL signal met target with the Institutional zone. Eg if BUY spotted at demand zone target will be neutral zone & Supply zone.
4. Script designed for user to spot high probability trades when BUY SIGNAL SPOTTED at the Institutional Demand zone same way SELL SIGNAL SPOTTED AT INSTITUTIONAL supply zone.
5. Combine with additional analysis: Users can utilize this script as a tool in their overall trading strategy. They can combine the signals with fundament analysis , market sentiment to make more informed trading decision
6.Set risk management measures: It is important for users to implement proper risk management strategies when trading based on the scripts signals. To avoid potential losses user once spotted BUY - SELL execute the long or short position. Ensure to place the stoploss to avoid potential losses and place the target. Once your trade is moving in your favor
can trial your stoploss to cost and protect the profits.
Anchored Auto Fibonacci Retracement with Alerts [ImaWrknMan]SYNOPSIS
Automatically generates a Fibonacci Retracement anchored to the candle of your choosing. As price moves further away from the anchor point, the fib levels automatically adjust to represent the entirety of the move.
BULLISH VS. BEARISH
It automatically detects if the Fibonacci Retracement should be drawn from the low or high of the anchored candle by considering the candles that follow (if they produce new highs, it will use the anchored candle low; if they produce new lows, it will use the anchored candle high).
MITIGATION
If the Fibonacci levels are fully retraced (i.e., price pulls back beyond the originating price), the levels will remain on the chart but it will no longer adjust as new candles form - it will become static.
OPTIONS
The following options are offered:
Extend Retracement Levels
The Fibonacci Retracement levels will extend beyond the last candle into the future. These extensions are visually represented using dashed lines.
Retracement Levels
Twelve levels are supported. The default levels mirror those used by the standard Fibonacci Retracement tool. Select only the levels you want to see on the chart. Line color can also be customized to your liking. You can optionally define an alert condition and alert message for each level (see "Alerts" below).
ALERTS
To receive an alert when price retraces into a level, check the "Alert" box to the right of that level. You can optionally define the text to display in the alert by entering it in the text box to the right of the alert checkbox. Levels with alerts will be marked on the chart with a "bell" symbol. Once you've selected the alerts you want to receive and (optionally) the text for each alert, create an Alert for the indicator.
NOTE: You do NOT need to create a separate Alert for each level.
Limitations
Alerts can only be defined for levels that fall between 0 and 1.
Once an alert is created, its settings are fixed. Any changes to the settings after the Alert is created will have no effect on the existing Alert. In this case, the Alert should be recreated.
Alert notifications will only be generated for visible levels.
Other Alerts
Alert on expansion - Use this alert option if you want to be notified when price moves further from the anchored price, causing the retracement levels to adjust. This is useful if you have Limit orders at current levels and you want to cancel or move them when the levels change.
"Alert on mitigation" - Use this alert option if you want to be notified when the Fibonacci Retracement has been fully retraced.
The code for this indicator was inspired by the Fibonacci Toolkit by LuxAlgo

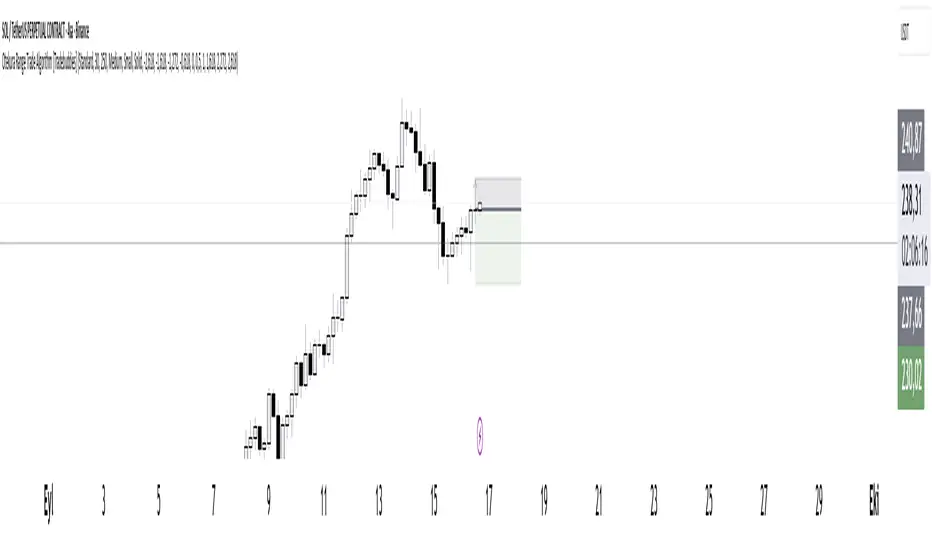
Preday Price ChannelPreday Price Channel Indicator
This indicator is designed to help traders easily observe and capitalize on key price levels and their implications on market trends. It displays the previous day's high and low prices, as well as lines representing Fibonacci ratios between these prices. When a high or low is double-broken (retested and broken again), the indicator confirms a trend change and fills the channel with orange or navy color to visually indicate this shift.
Before a large directionality appears in the market, a breakout of the previous day's high or low must occur in that direction. As long as the previous day's low is maintained, an uptrend persists, and as long as the previous day's high is maintained, a downtrend persists.
In the crypto market, the significance of the previous day's high or low is often underemphasized and less known. This simple indicator was created to help traders observe the powerful influence of the previous day's high and low, and to potentially use it to their advantage in trading.
Wishing you successful trading with this tool.
Options
Day Open: Check this box to display the current day's opening price on the chart. The opening price of the day often remains intact and is one of the simplest and most powerful indicators of whether the day's trend is upward or downward.
Preday Open: Check this box to display the previous day's opening price on the chart. The previous day's opening price often exhibits a strong tendency for retests.
Preday High and Low: Check this box to display the previous day's high and low prices on the chart. These levels are critical for determining potential breakout points.
FIB On: Check this box to display the Fibonacci ratios between the previous day's high and low prices. This feature helps identify potential support and resistance levels within this range.
Day Mid On: Check this box to display the midpoint of the preday's price range on the chart. This serves as a reference point for trend changes.
Day Trend Color On: Check this box to enable color-coding for uptrends and downtrends based on the previous day's high and low prices.
When the previous day's high is breached, the trend value is set to 2, and an orange shaded area is filled in.
When the previous day's low is breached, the trend value is set to -2, and a navy shaded area is filled in.
When a high or low is double-broken (retested and broken again), the indicator confirms the trend change, filling the channel with orange for an uptrend and navy for a downtrend to make it easy for users to recognize the trend change.
These trend values and colors remain as long as the midpoint of the previous day's price range is not violated, indicating the trend is still valid.
If, during a downtrend (trend value of -2), the low price crosses above the previous day's midpoint, the trend value changes to 1, indicating a potential issue in the downtrend, and a light orange color is displayed.
Conversely, if, during an uptrend (trend value of 2), the high price crosses below the previous day's midpoint, the trend value changes to -1, signaling a potential issue in the uptrend, and a light navy color is displayed.
This comprehensive set of features allows traders to make informed decisions by clearly observing key price levels and their implications on market trends.

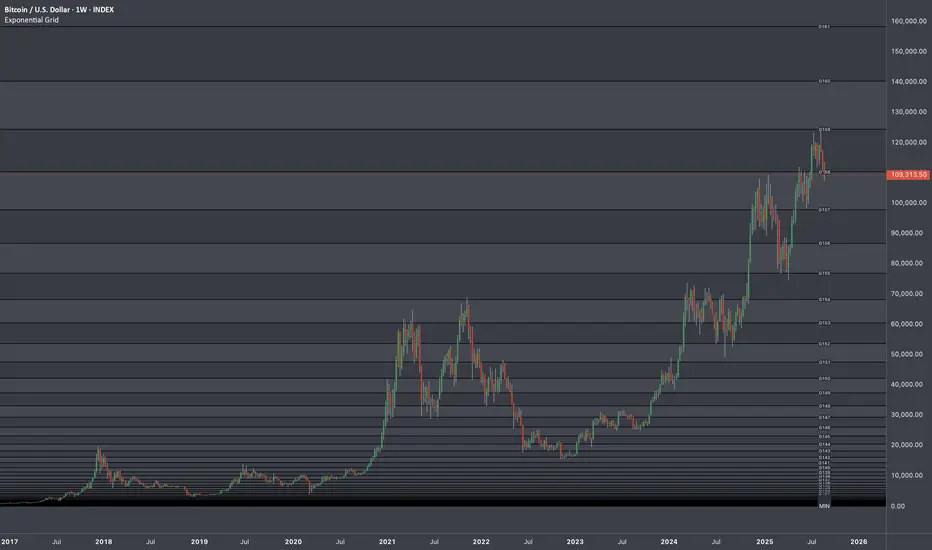
Exponential Grid [Phi, Pi, Euler]If you disagree with one of the EMH principles that price is too random, then by definition you must agree that historic price has deterministic function to a scenario ahead.
I personally believe that constants like phi, pi and e can mimic exponential growth of the price.
In this script, first grid is based on the Lowest price multiplied with self fraction of the constant.
For example:
If you are familiar with fib ratio 1.272, then you must know that it is 1.618 to the power of 0.5.
With default settings of exponent step 0.25
First grid = Lowest price x phi^0.25
Second grid = Lowest price x phi^0.25x2
Third grid = Lowest price x phi^0.25x3 and so on
The script will automatically find the lowest price and update the grid values.
Or you can set up your custom Lowest price manually if you feel like the All Time Low level loses its relevance value after long period.
There are 64 grids including Lowest price level. And it wasn't by a chance. Pine Script has a limitation of max 64 plots. Number of grids shown in the chart depends on the highest price. Once price breaks above ATH a couple of next grids will be plotted automatically. In most cases if everything is plotted, the chart appears squeezed and you'll need to zoom in to see it. Therefore, I adjusted it relatively to the scale of the chart for the comfort.
In some cases 64 plots aren't enough to cover the whole chart. For example, let's take a look at NVIDIA chart:
Since the price has started with 0.0333, it is way too small to cover all with default settings.
We are left with 2 choices:
Either Enable "Round"
OR increase Exponent Step (from 0.25 to 0.5 in the particular example below)
If you set constant to pi or e which is a bigger number than phi, expect the gaps to be bigger. To reduce it to a more gradual way of expansion you can decrease Exponent Step.
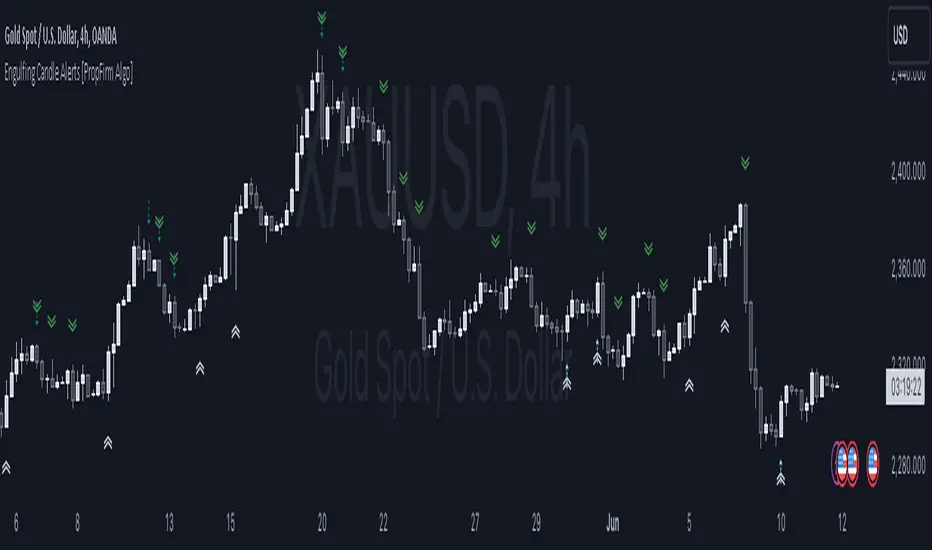
Engulfing Pattern Alerts By PropFirm AlgoWe have now decided to make this indicator to support the trading community! If you find yourself struggling to identify bullish engulfing and bearish engulfing candles, this one is for you.
Release Notes:
Initial release with robust detection of bullish and bearish engulfing patterns.
Added trend and volume filters for enhanced pattern accuracy.
Custom alerts for real-time notifications of potential trading opportunities.
Appendix 1 - Example Case of Use For Educational Study.
Appendix 2 - Technical description which focuses on explaining the functionality of the script, how the code works, and how it can be used by traders, providing further immediate insight value.
Appendix 1:
This indicator will provide you with Two types Bullish and Bearish Engulfing Alerts.
The Regular Bullish and Bearish Engulfing Candle's Shown As
Bullish Engulfing ︽
Bearish Engulfing ︾
And the Filtered Bullish and Bearish Engulfing Candle Shown As
Filtered Bullish Engulfing ⇡
Filtered Bearish Engulfing ⇣
You can also change the Alert Symbol to any text, symbol or emoji of choice in the Setting Style Panel . This allows you to customize the alert symbol style to your liking, Example....
Using the power of artificial intelligence, we coded this indicator based on technical descriptions to perfect this simple problem.
Use this tool together with different strategies as a confirmation to your trading bias.
Use Supply and Demand Zones together with the Engulfing Pattern Alerts
First, Verify if the bullish engulfing candle is at the end of a dying trend.
Secondly, Check if it’s at a major 1-hour, 4-hour, or daily support and resistance zone.
Then wait for the retest, then enter a position.
DON’T USE THE ENGULFING ALERT AS A POINT OF ENTRY, OR WHILE MARKETS ARE CONSOLIDATING nor in the middle of an active trend.
Now for the second most used method:
Use The Fibonacci together with the Engulfing Pattern Alerts
First, Identify an impulse candle that creates a new trend in the market.
Then Draw out your Fibonacci tool from the start of the candle to the end of the impulse leg where rejection is shown.
Wait for the price to retrace to the 61.8 retracement and use the engulfing candle as a second confirmation.
And lastly, wait for the price to retest the fib level showing signs of rejection, then enter.
Appendix 2:
Technical Description:
The "Engulfing Pattern Alerts By PropFirm Algo" script is a sophisticated tool designed to identify and alert traders of potential bullish and bearish engulfing patterns in the market, enhanced by trend and volume filters for improved accuracy. This script helps traders spot potential trend reversals by analyzing candlestick patterns in conjunction with volume data and moving averages.
Key Features:
Bullish Engulfing Pattern Detection: Identifies when a smaller bearish candle is followed by a larger bullish candle, indicating potential upward price movement.
Bearish Engulfing Pattern Detection: Identifies when a smaller bullish candle is followed by a larger bearish candle, indicating potential downward price movement.
Volume Filter: Enhances pattern reliability by ensuring the identified pattern is accompanied by a significant volume increase.
Trend Filter: Utilizes Simple Moving Averages (SMA) to filter patterns based on the prevailing market trend, reducing false signals on the "Filtered Engulfing Alerts" Setting.
Custom Alerts: Configurable alerts for both bullish and bearish engulfing patterns, allowing traders to stay informed in real-time.
How It Works:
Bullish Engulfing Pattern:
Detected when the body of the current candle completely engulfs the body of the previous candle.
Confirmed if the current candle closes higher than it opens, and the previous candle closes lower than it opens.
Volume on the current candle must be greater than the previous candle.
Bearish Engulfing Pattern:
Detected when the body of the current candle completely engulfs the body of the previous candle.
Confirmed if the current candle closes lower than it opens, and the previous candle closes higher than it opens.
Volume on the current candle must be greater than the previous candle.
Trend Filter:
Uses moving averages to determine the market trend.
Bullish patterns are only considered in downtrends.
Bearish patterns are only considered in uptrends.
Alerts:
Alerts can be set up for both bullish and bearish patterns, ensuring you are notified when significant market movements are detected.
How to Use:
Add the script to your chart.
Configure the alert settings according to your trading preferences.
Monitor your chart for plotted symbols indicating potential bullish (︽) and bearish (︾) engulfing patterns.
Utilize the alert conditions to get notified when these patterns occur.
Multi Pivot (S/R) & Previous Period (OHLC)█ Multi Pivot (Support/Resistance) & Previous Period (Open/High/Low/Close)
The previous script was deleted because of a copyrighted word.
From JayRogers description.
█ Multi Pivot Selector
Allows you to set up to 3 distinct sets of pivots, each with their own resolution settings and the ability to select how many support|resistance levels are shown.
The maximum amount of S|R levels available varies with different pivot types, the options available are:
Traditional
Fibonacci
Woodie
Classic
Copyrighted word
Camarilla
Fibonacci Extended
█ Previous Period Levels
A simple but highly customisable display of previous higher time-frame OHLC values.
Customised resolution input which excludes time frames lower than 1 hour while extending the common higher reference inputs.
This script is based on JayRogers script, I only added some features so please check out his script.
I added the timeframe in the labels, in order to make it easier to differentiate when using multiple pivot set.
As well as making it possible to change the lines color of each pivot set separately.
Labels can now be displayed on each side (right, left and both) or just disabled.
The type of pivot can be shown on the right side.
Lines extension can be disabled and lines width value can be changed.
I also added another one of his script to display OHLC levels, I made similar changes.
Converted to Pine Script v5.
Previous Period Levels - X Alerts
Pivotal - Multi Pivot Selector (which was also deleted because of the copyrighted word)

Deck@r True Range IndexThis Pine Script calculates the True Range Index (TRI) using ATR and Fib Levels and uses the result to generate buy and sell signals based on certain conditions.
Here's a breakdown of the code:
Inputs:
atr_period: Determines the period for calculating the Average True Range (ATR), preferred setting at 14.
atr_multiplier: Multiplier used to set the width of the ATR bands preferred setting at 1.
Calculations:
atr_value: Calculates the Average True Range (ATR) using the input period.
upper_band: Calculates the upper band of the ATR bands using a Simple Moving Average (SMA) of the close price plus the ATR multiplied by the multiplier.
lower_band: Calculates the lower band of the ATR bands using a Simple Moving Average (SMA) of the close price minus the ATR multiplied by the multiplier.
midline_75 and midline_25: Calculate midlines at Fibonacci retracement levels of 0.75 and 0.25, respectively, between the upper and lower bands.
Plotting:
Plots the upper and lower bands of the ATR bands.
Optionally plots midlines for the ATR bands (commented out in the code).
Buy and Sell Conditions:
buy_condition: Defines a condition for a buy signal, which occurs when the close price is above the midline at the Fibonacci retracement level of 0.25.
sell_condition: Defines a condition for a sell signal, which occurs when the close price is below the midline at the Fibonacci retracement level of 0.75.
Candle Color:
Sets the candle color based on the buy and sell conditions.
Buy and Sell Signals:
buy_signal: Checks for a buy signal when the close price crosses above the midline at the Fibonacci retracement level of 0.25.
sell_signal: Checks for a sell signal when the close price crosses below the midline at the Fibonacci retracement level of 0.75.
Plots buy and sell signals on the chart.

Otekura Range Trade Algorithm [Chain Hood]The Range Trade Algorithm calculates the levels for Monday.
On the chart you will see that the Monday levels will be marked as 1 0 -1.
The M High level calculates Monday's high close and plots it on the screen.
M Low calculates the low close of Monday and plots it on the screen.
The coloured lines on the screen are the points of the range levels formulated with fibonacci values.
The indicator has its own Value table. The prices of the levels are written.
Potential Range breakout targets tell prices at points matching the fibonacci values. These are Take profit or reversal points.
Buy and Sell indicators are determined by the range breakout.
Users can set an alarm on the indicator and receive direct notification with their targets when a new range occurs.
Fib values are multiplied by range values and create an average target according to the price situation. These values represent an area. Breakdown targets show that the target is targeted until the area.
Dual Dynamic Fibonacci Grouped Averages with Color ChangeRed Bearish Green Bullish
Using grouped fib averages, works similar to SMA

Opening Range Reversal ZonesThis script finds a reversal zone beyond the opening range for the selected period. I borrowed most of the opening range script itself from asenski.
I added a few things:
Trade Entry Times -- this restricts the "alert times."
Shading for the above mentioned times for the two "reversal" zones
A couple of other visuals for lines for the hi, mid, low of the opening range and lines for the fibs
Alerts while in the trading entry time session for fibbonacci crossovers.
I use this on NDX, SPY, and QQQs and have found buying "at the money" 0DTE puts in the "red zone" or 0DTE calls in the "green zone" frequently wins.
I have no statistics, as I am very methodical when I choose to enter, paying attention to the news, recent momentum, etc, and am not blindly entering when alert comes, but when one does, I do research and enter a trade.
In any case, thought I would share.
Anchored Progressive RangeIntroducing a simple script based off of the idea that ranges form from a point of origin that can be measured and produce interesting analysis indicating potential opportunities.
Specifically I use this on daily and weekly anchorage to find mid range retracements once range has developed.
Configure internal multipliers to provide potentially useful measurements between range high and mid point, as well as mid point and range low. By default it's standard .25 based multipliers but one could adjust to fib multipliers such as .615, .65, etc.
Anchored open price is plotted as continuous line as often times reversals will occur and open price will be tested on daily, weekly, monthly timeframes.
Once a bit of range is established and there's a rapid adjustment of range mid up or down, these can signal interesting breakouts. Also areas where the range stays flat due to no new high or low being printed can be indicative of consolidation, etc.
I've tested this with heikin ashi, renko, bars, line and regular candles through various markets such as futures, etfs and stocks and everything appears to anchor correctly, please feedback if experiencing otherwise.
I hope you enjoy this indicator as much as I enjoyed creating it, happy trading!
Intraday Fibonacci Levels [Gorb]Welcome to the Intraday Fibonacci Levels indicator, a dynamic and customizable tool designed for traders who incorporate Fibonacci retracements and extensions into their technical analysis. This indicator focuses on intraday price action, allowing you to select a specific candle from any trading session and visualize crucial Fibonacci levels derived from its high and low prices.
Features:
Candle Selection for Fibonacci Analysis: Select any candle based on its time to plot Fibonacci levels, giving you control over the period of analysis.
Customizable .236 and .618 Fibonacci Levels: Plot and customize the .236 and .618 Fibonacci retracement and extension levels. Adjust color and line style for each level to fit your chart preferences.
User-Friendly Interface: Easy-to-use input fields for selecting the candle time and configuring Fibonacci settings. Intuitive toggle options to display or hide specific Fibonacci levels.
Dynamic Updating: The indicator updates in real-time as new price data is received, ensuring you have the latest Fibonacci levels on your chart.
Usage Case:
This indicator is ideal for day traders and technical analysts who utilize Fibonacci tools to identify potential support and resistance levels, trend reversals, or continuation patterns. Whether you are analyzing a high-impact news event candle or a significant pivot point in the trading day, this indicator helps bring clarity to your Fibonacci-based trading strategy.
Guidelines for Usage:
Use the indicator settings to select the candle time and configure your desired Fibonacci levels. You can choose any time you want, in order to use premarket candles you need to enable electronic hours on your chart to have levels plot from pre/post.
These auto plotted levels can act as pivot points or points of support and resistance for traders to make informed trading decisions near these levels. Analyze the plotted Fibonacci levels in conjunction with other technical indicators or price action patterns for informed trading decisions.
Conclusion:
This indicator is a versatile and essential tool for traders who rely on Fibonacci analysis as part of their trading arsenal. By offering the flexibility to analyze specific candles and customize Fibonacci levels, this indicator empowers you to make more informed trading decisions. Its user-friendly design and real-time updating capabilities ensure that you have access to accurate and relevant Fibonacci data at any moment of the trading day.
RISK DISCLAIMER
All content, tools, scripts & education provided by Monstanzer or Gorb Algo are for informational & educational purposes only. Trading is risk and most lose their money, past performance does not guarantee future results.

Fibonacci Timing Pattern IIThe Fibonacci Timing Pattern II is a price-based counter that seeks to determine medium-term reversals in price action. It is based on the following set of conditions:
* For a bullish Fibonacci timing signal II: The current close must be lower than the close prices from one and two periods ago. Simultaneously, the close price from two periods ago must be lower than the close price from three periods ago, and the close price from three periods ago must be lower than the close price from five periods ago. The Fibonacci sequence continues until the close price from thirty four periods ago which must be above the close price from fifty five periods ago.
* For a bearish Fibonacci timing signal II: The current close must be higher than the close prices from one and two periods ago. Simultaneously, the close price from two periods ago must be higher than the close price from three periods ago, and the close price from three periods ago must be higher than the close price from five periods ago. The Fibonacci sequence continues until the close price from thirty four periods ago which must be lower the close price from fifty five periods ago.
The signals of the pattern are ideally used in a sideways market or used in tandem with the trend (bullish signals are taken in a bullish market and bearish signals are taken in a bearish market).

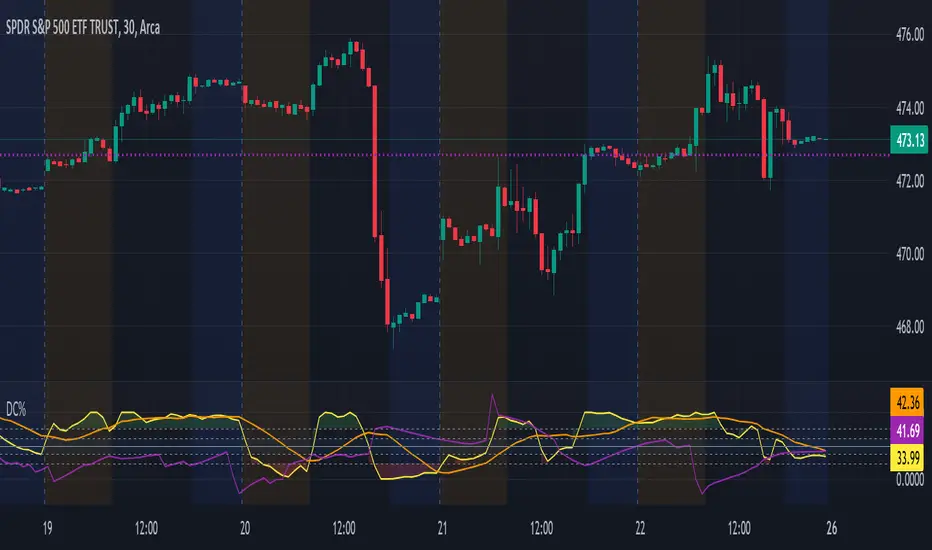
Donchian Channels %I enjoy Donchian Channels for identifying trends. However, I hate having them on my chart. They are next to impossible to interpret at a glance. This script converts DCs to a % making a useful oscillator. The horizontal lines on the chart correspond to the Fib retracements below 50%. There are many ways to trade using this script and it works on any time frame. Moving average crosses are worth your attention, particularly, the 34 period MA (purple line). Enjoy and happy trading.
Auto Fibonacci Retracement // Atilla YurtsevenOverview:
This Pine Script™ is a specialized tool for traders, designed to automatically plot Fibonacci retracement levels over a user-defined date range in trading charts. It also indicates the extent of price retracement within these levels.
Key Features:
Date Range Customization: Users can specify the start and end dates to focus the analysis on a particular trading period.
Dynamic Fibonacci Levels: The script includes various Fibonacci ratios (0.0, 0.236, 0.382, 0.5, 0.618, 0.786, 1.0), with the flexibility to enable or disable individual levels.
Visual Customization: Each Fibonacci level can be customized for color and line style (solid, dotted, dashed). Labels for each level are also configurable.
Retracement Measurement: The script not only draws the Fibonacci levels but also measures and displays how much the price has retraced within these levels.
Extension and Additional Options: Users have options to extend the Fibonacci lines and additional features such as using close values, trend drawing, date range display, and more.
Technical Insights:
The script identifies high and low values within the selected time frame, assessing the market's trend direction.
Within the specified date range, this script effortlessly plots the Fibonacci levels automatically, bringing clarity and precision to your market analysis as it unfolds.
The tool's adaptability makes it suitable for various trading styles and chart preferences.
Intended Use:
This script is particularly valuable for technical analysts and traders who use Fibonacci retracements to identify potential support and resistance areas and understand the depth of market corrections or rallies.
Disclaimer:
This Pine Script™ is offered 'as is', without any guarantees or warranties. It is intended for informational purposes and should not be taken as investment advice. Atilla Yurtseven, the creator of this script, assumes no responsibility for any financial losses or gains that may result from its usage. Users should perform their own due diligence and consult with professional advisors before making any investment decisions.
Remember to follow and comment!
Trade smart, stay safe
Atilla Yurtseven

Day Open,High,Low Fib LevelsDay Open,High,Low Fibonacci Levels indicator depicts Fibonacci levels from Highest to lowest price levels vis-à-vis Day Open Price. The indicator is structured based on default Intraday number of bars. Hence the indicator and Gray Zone concept is effective in lower time frames .The indicator has also “Regular” Check in Box option under “Input” with default 14 bars under “Regular Length” to switch over from default Intraday Length.
Green Zone represent area above Day Open Price when close is above Day Open Price.
Red Zone represent area below Day Open Price when close is below Day Open Price.
Gray Zone represent band within the Maximum and Minimum of Moving Averages of MA24,MA38,MA50,MA62,MA79 drawn with relevance to Fibonacci levels. The movement within this band is expected to be resistant prone on either direction.
Fibonacci levels between Highest and Lowest points during Green Zone and Red Zone are derived and reflected at 78.6,61.8,50.0,38.2 and 23.6 levels for users guidance.
Trades above Gray Zone are favored for Buy trades and below Gray Zone are favored for Sell trades. Trades within Gray Zone are resistant prone from either direction.
If number of bars in Gray Zone during Intraday are more than the combined number of bars above Green Zone and number of bras below Gray Zone then market may be assumed to be in Range bound state.
MA20 and MA200 are in default in display state. Position of MA 20 above and below Gray Zone and vis-à-vis MA Mid (Mid point in Gray Zone ) reflects the prevailing trend .MA 200 reflects the general Up trend or Down trend .
The Indicator reflects the Green Zone, Gray Zone ,Red Zone in the Table below the Chart depending on the position of Day Open Price below or above the Last Price .If the number of bars in the Gray Zone are more than the combined number of bars above and below Gray Zone the table reflect Range Bound Market.
Supplementing with other monitoring tools and Price Action dynamics the indicator assist the user to plan his entry and exit of trade based on the position of the market whether it is in Green Zone or Red Zone by taking into account the Fibonacci Levels.
DISCLAIMER : For educational and entertainment purpose only .Nothing in this content should be interpreted as financial advice or a recommendation to buy or sell any sort of security/ies or investment/s.

ZigZag++ FibonacciAuto Fibonacci tools are powerful ways designed to simplify your technical analysis by automatically drawing Fibonacci retracement and extension levels on your chart. This indicator is built to enhance your trading experience with clearer market moves and informative insights.
You can easily spot your waves and patterns when the percentages are moving with you.
Key Features:
Automated Fibonacci Levels: Plots Fibonacci retracement and extension levels based on recent price movements.
Multi-Timeframe Support: This indicator is your versatile companion, offering multi-timeframe functionality. You can seamlessly track Fibonacci levels across different resolutions, providing a comprehensive view of the market.
Two Types of Fibs: Retracement and Timeframe extension Fibonacci levels. Use retracements to identify potential reversal points and extensions to anticipate price targets, giving you a well-rounded perspective on market movements.
Benefits:
Save Time: No more manual Fibonacci drawing; It does this for you in real-time.
Enhanced Analysis: Gain a deeper understanding of potential support, resistance, and price targets.
User-Friendly: Suitable for traders of all levels, this indicator simplifies complex technical analysis.
For the math lovers
I started creating the ZigZag++ based on the MT4 calculation as I found it better performing than the tradingview inbuilt one. I have revised the calculation couple of times and now the final calculation is simple yet more accurate for my analysis.
First, I observe the market direction for the last Depth setting by comparing the rate at which high values reduce and low values increase. When the number of ticks set by Deviation is crossed and the last cross is more than the Backstep candles, then we have our ZigZag points.
These are the points we use in our Fibonacci calculation.
Checkout ZigLib below to use the same logic in your scripts.
Sample usage
This is a 4 Hour configuration with the default settings.
When the trend reversed, some key points I watch are 0.618 and 0.5. The market retraced back and formed the new point for the next ZigZag line on that level. This market behaviour happens quite often on these Fibonacci points. I would be looking for reversal or a break in this zone to know the next step.
Resources
ZigZag++ Lib by me; for retrieving the line points.
Fibonacci Toolkit by Lux Algo; For drawing the Timeframe Fibs. Very Amazing script.
Clone Pivots. Oct_2023Conceptually very simple.
The all time high or low of the chart (this indicator can be used with non-price sources as well), is used to divide the price pane continuously by 2.
For example the first pivot is (All Time High + All Time Low)/2.
From this point the price chart is further divided by 2.
The user can set the depth of division, and the lines for depth are only shown around the price.
About clone pivots.
- they can be used for ladder trading
- they are based on the range of the stock or instrument price
An alternative is available to use Fib divisions rather than simple divide by 2 method.
Labels may be placed with price or without. And depth of labelling is also an option.
Clone pivots at 50% tend to work very well with price structures - give it a try and see if it helps your trading!
Pine source uses UDTs, Methods, Arrays and Maps.

RSI + Fibonacci HH LL Support Resistance I have integrated my past scripts and brushed them up further.
This tool allows for support/resistance, stop loss, take profit, and trend analysis using RSI and Fibonacci ratios.
For example, the Fibonacci ratio is used as follows
l1 = m - dist * 0.618
l2 = m - dist * 1.618
l3 = m - dist * 2.618
l4 = m - dist * 4.235
l5 = m - dist * 6.857
l6 = m - dist * 11.089
When the Fibonacci ratio reaches 2.618 or higher and the RSI smoothed by the 5-day EMA is oversold/overbought, the bar color is changed by a gradation.
We have tried to make the design as beautiful and good-looking as possible. You can also hide the lines to suit your own preference.
Example usages are here:
BTCUSDT 1Hour Chart
Using Fibonacci numbers
BTCUSDT 15min Chart, for Scalping
Here, to set the highest and lowest prices one hour ago, "4" is substituted as the calculation: 15 minutes x 4 = 60
BTCUSDT 15min Chart, for Scalping
To set the highest and lowest prices 4 hours ago , "4" is substituted as the calculation: 15 minutes x 16 = 240
BTCUSDT 15min Chart, for Scalping
To draw yesterday's high and low as support/resistance lines, I substituted the number "96" as 1440/15=96.
BTCUSDT 1min Chart, for Scalping
Substituted "60" to trail the highest and lowest prices over a 60-minute period on a 1-minute chart, and removed lines to beautify
BTCUSDT 1day Chart, for Long-Term Investers
This is an example of using "90" because it is a 1-day chart and assumes that 3 months = 90 days in order to trail the highest and lowest prices over a 3-month period and no lines.
My past scripts are here:
RSI + FIB HH LL StopLoss Finder/Contrarian Trades
Fibonacci HH LL TRAMA Band
