Fibonacci Oscillator Prototype V2Fib Oscillator Prototype V2
visuals refined a bit
no more timeframe selector - value clamp going outside of the top fib and bottom fib levels if you pick a higher timeframe than what you are currently using
Cari dalam skrip untuk "fib"

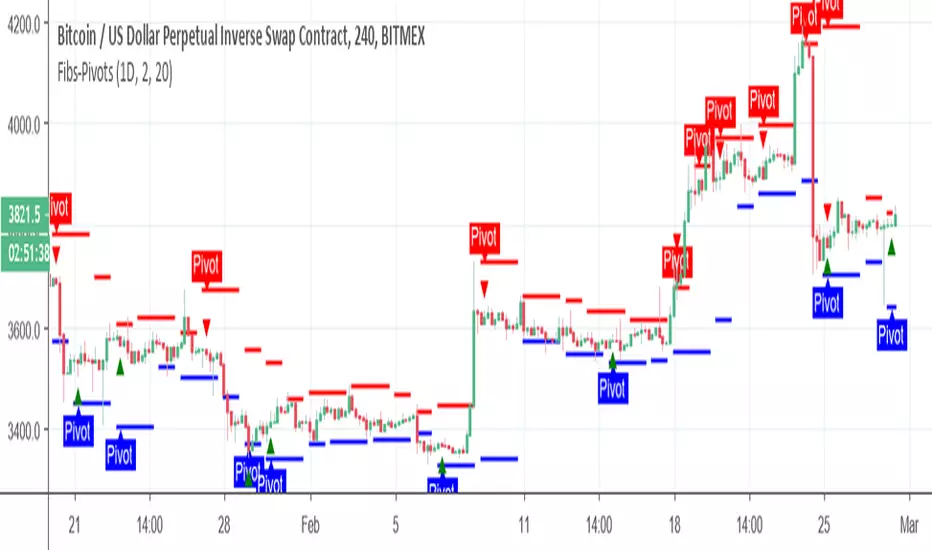
Fibs-PivotsThis Pivots are based on 2 days of Fibs upper and lower . In contrast to regular pivots that based on price , this one based on the high and low of the extreme ends of the fibs system. you can change the fibs to be daily or longer to find proper setting . Also you can change the lookback to be longer or shorter to see points of interest .
It easy to add alerts to this system if one want to do it
Fib Retrace + Extensions (v6– safe version) v 1🌀 Fib Extension Plus Retracement Strategy: Complete Overview
📊 Purpose and Core Idea
The Fib Extension Plus Retracement Strategy is a hybrid price-action methodology that blends Fibonacci Retracement and Fibonacci Extension tools to map high-probability entry, exit, and target zones within trending markets.
It is designed for precision timing, measured risk exposure, and trend-continuation trading.
By uniting both retracement and extension logic, traders can capture the entire lifecycle of a move — from the pullback phase to the breakout and projected expansion wave.

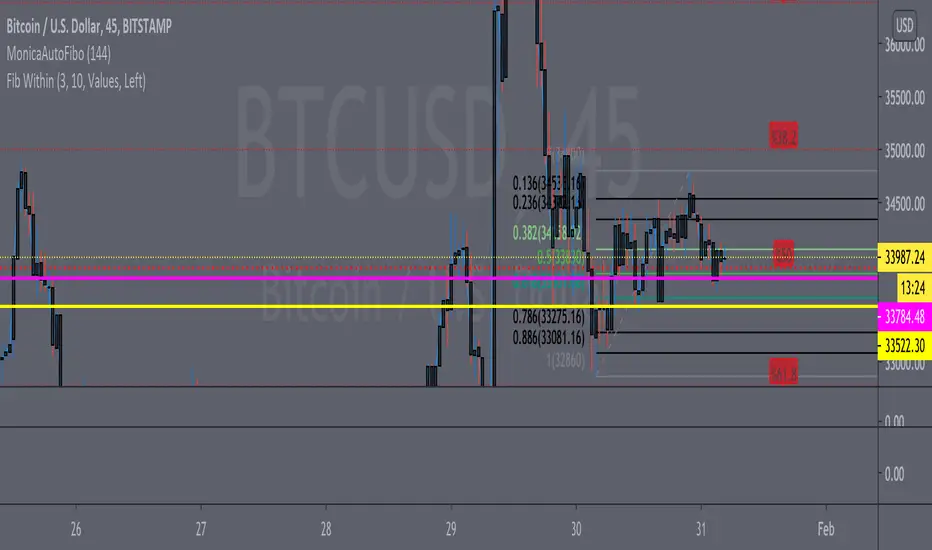
Fib Within ConvectionThis Fib has all the basic level plus the convection zones of the 136 & 886 listed in black... you can utilize this with the other fib convection zone to catch smaller moves in the market.
Source @daytraderph
Mod @LaMonicaRobinson
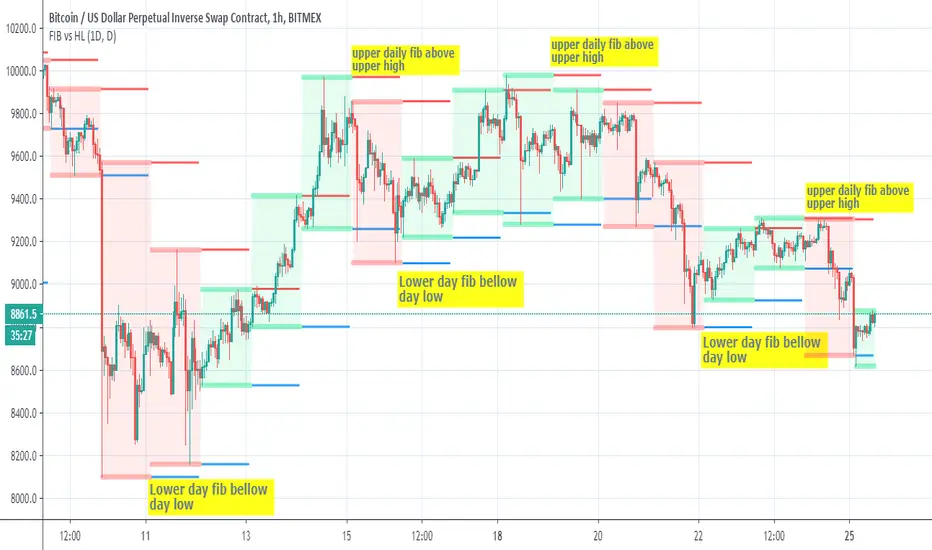
FIB vs HLThis script show the relation bettwen daily fib seen in red =upper and blue=lower to daily candles upper and lower
since there is slight variation how both calculated we can see that when daily fib is lower then the low candles daily low then there is a good chance for a buy trend
and vice versa in oposite direction
so it just a nice idea that need further verification
Fib Green zone / Red zone + Elliott Wave 3═══════════════════════════════════════════
🎯 FIB GREEN ZONE / RED ZONE + ELLIOTT WAVE 3
═══════════════════════════════════════════
OVERVIEW
--------
A comprehensive technical analysis tool combining Fibonacci retracement levels
with Elliott Wave theory to identify high-probability trading opportunities.
KEY FEATURES
------------
✅ Dynamic Fibonacci Levels (0%, 23.6%, 38.2%, 50%, 61.8%, 78.6%, 100%)
✅ Color-Coded Trading Zones:
• Green Zone (0-23.6%): Strong support area
• Golden Zone (50-61.8%): High-probability reversal zone
• Red Zone (78.6-100%): Potential resistance area
✅ Elliott Wave 3 Detection:
• Automatic Wave 1 & 2 identification
• Wave 3 entry signals
• Golden Pocket setups (highest probability)
• Customizable retracement parameters
✅ Fully Customizable:
• Toggle individual levels on/off
• Customize all colors and line styles
• Adjust Elliott Wave sensitivity
• Show/hide labels and zones
IDEAL FOR
---------
- Day traders and swing traders
- Fibonacci-based trading strategies
- Elliott Wave practitioners
- Support/resistance trading
ALERT SYSTEM
------------
Built-in alerts for:
- Price crossing key Fibonacci levels
- Wave 3 entry signals
- Golden Pocket setups
HOW TO USE
----------
1. Apply to any timeframe (works best on 1min-1hr for intraday)
2. Watch for price action in zones
3. Wave 3 signals appear when setup criteria are met
4. Use with other confirmations (volume, price action, etc.)
IMPORTANT DISCLAIMER
-------------------
This indicator is for educational purposes only. It does not guarantee
profitable trades. Past performance does not indicate future results.
Always use proper risk management and conduct your own analysis.
═══════════════════════════════════════════
📧 For access requests or questions, please message me directly.

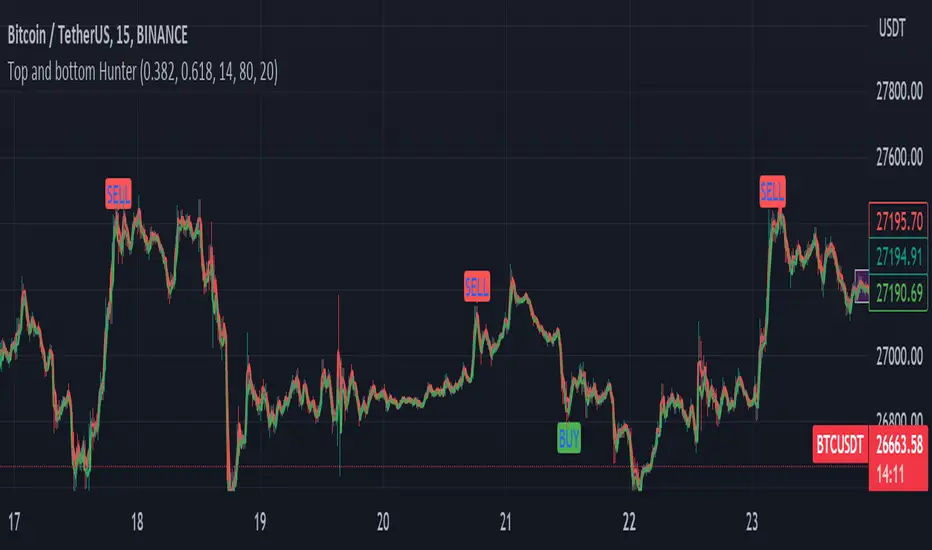
Fib top and bottom Hunter - No Repaint "Top and bottom Hunter" indicator combines two popular technical analysis tools, Fibonacci retracement levels and the Relative Strength Index (RSI), to identify potential trading opportunities in the market.
Fibonacci retracement levels are based on the Fibonacci sequence, a mathematical series where each number is the sum of the two preceding ones. In trading, Fibonacci retracement levels are used to identify potential support and resistance levels based on the recent price action. The indicator uses two Fibonacci levels, fib_0 and fib_1, which are typically set to 0.382 and 0.618, respectively. These levels represent common retracement ratios.
To calculate the Fibonacci levels, the indicator considers the highest and lowest prices within a specified range, typically the highest and lowest of the last two bars. It calculates the fib_range, which is the difference between the highest and lowest prices. Then, fib_level_0 and fib_level_1 are determined by subtracting the Fibonacci ratios from the highest price.
The RSI is a momentum oscillator that measures the speed and change of price movements. It helps identify overbought and oversold conditions in the market. The RSI parameters used in this indicator are rsi_length (length of the RSI calculation), rsi_overbought (upper threshold indicating overbought conditions), and rsi_oversold (lower threshold indicating oversold conditions). The RSI value is calculated based on the closing prices.
The indicator generates buy and sell signals based on specific conditions:
Buy Condition: A buy signal is triggered when the RSI crosses above the oversold level (rsi_oversold) and the closing price is higher than fib_level_1. This indicates a potential reversal or bounce from the Fibonacci support level.
Sell Condition: A sell signal is triggered when the RSI crosses below the overbought level (rsi_overbought) and the closing price is lower than fib_level_0. This suggests a potential reversal or pullback from the Fibonacci resistance level.
In summary, this indicator combines the power of Fibonacci retracement levels and the RSI to identify potential trading opportunities. It helps traders find confluence between the Fibonacci support or resistance levels and the RSI readings, indicating potential trend reversals or bounces. Traders can use this information to make informed decisions about entering or exiting positions in the market.
Feel free to change the settings for what works best for you and use this with other confluences. I personally use RSI overbought and oversold values as 80 and 20
Fib Retracement AlgoFib Retracement Algo
Description: This indicator has a series of steps that it takes before it finds possible retracement areas depending on the trend. The indicator itself is really simple to use.
How does it work?
This indicator uses the Hurst Exponent to verify whether or not the market is trending or not. It then determines the trend and then decides which retracement is possible.
If the hurst is below 0.5, then the retracement lines won't appear; they only appear in a trending market above 0.5 if you don't see the lines.
How Traders can use this indicator
Traders who trade bounces or retracements can use this indicator and enjoy the verification process that goes behind finding these retracements. This indicator can also be used to identify possible gaps on some occasions.
Examples of the indicator:

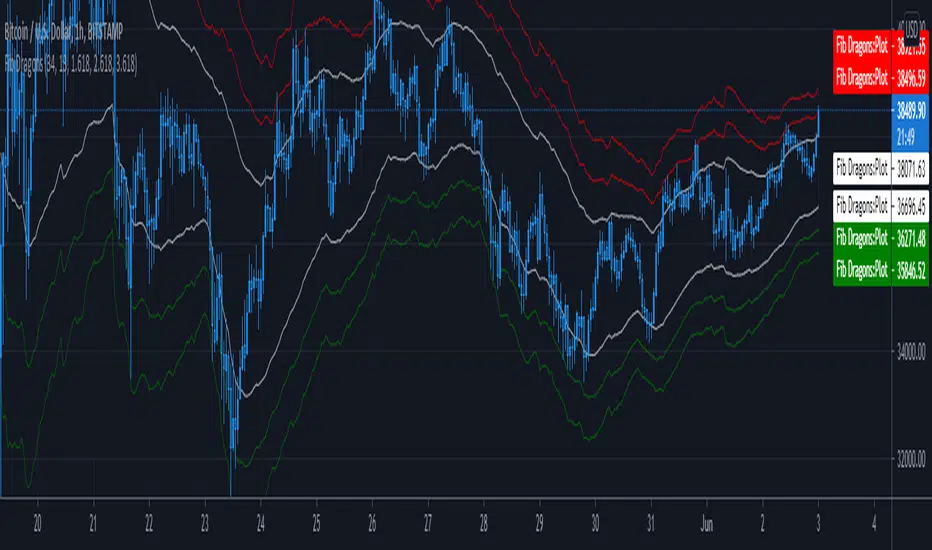
Fib DragonsCreates bands based on Fibonacci golden ratio numbers and EMA w/ATR
This allows for a faster reaction and significantly less lag than SMA w/ATR
EMA is set to 34 - Recommend range by taste 21, 34, 55, 62
ART is set to 13 - Recommend 13 or 21
Fib Bands are set to 1.618, 2.618, 3.618 however you can set to what works for you. I recommend keeping them at the golden ratios.
Based on indicator by rstraat
How to trade - Same rules apply
- Best to use in ranging market conditions
- Place on two different time frames such as the 15 min. and 60 min for intraday trading
- Take trades off either short or long term chart.
- Best trades occur when both charts show same trigger/condition.
- Trades are short term reversals in direction of major trend on longer term chart unless you expect a trend reversal.
- Determine which band is the limiting band for the volatility of the instrument.
- When the market closes outside of the limiting band then returns inside, take a long/short one tick above/below the high/low of the previous bar.
- Place stop below/above the low/high of the the recent swing low/high.
- Set targets at opposite band of chart
Use any oscillator you favor or see fit with this indicator or any other strategies that work for you.
Fib-Simple MA MultiplesThis is just a Simple Moving Average script with several multipliers at Fibonacci number values. You can adjust the MA lengths and source value. Enjoy.

FIB WEDGE BreakOut-ProNSE:BANKNIFTY
This is Fibonacci retracement Breakout Strategy based on First 5Min of the Day. Retracement line will be auto populated after the confirmation of first 5min candle of the day.
We tested this only on Indian Market, you can try in other Market based on your need but we never tested this in other market.
The levels are defined based fib levels of first 5Min candle. you can use this in any time frame plotting will change accordingly but suggested to use in 5Min.
Compared to my basic version script, pro version has different level plotting and this will give you early entry, Since these are using two different level we cannot club.

FIB / RSI Mixed IndicatorThis is a FIB / RSI combined indicator designed to locate tops and bottoms.


Fib Divergence SystemCombo of many useful indicators which includes fib lines, time and money channels and divergence buy sell signals
Credits for source code:
Scarf, Lazybear, 100kiwi

Fib Bands 1H 4H 1D Ideas are collected and edited
Combined indicators from Fibonacci, BollingerBands, SMMA
Should use 1H to 4H frames is most effective.
# The support and resistance points are almost perfect, have been tested a lot of times .

FIB EMAs4 EMAs for the FIB numbers - 8, 13, 21 and 55
Can be used as a single indicator, so can have e.g. MACD and RSI also available

Trend Fib Zone Bounce (TFZB) [KedArc Quant]Description:
Trend Fib Zone Bounce (TFZB) trades with the latest confirmed Supply/Demand zone using a single, configurable Fib pullback (0.3/0.5/0.6). Trade only in the direction of the most recent zone and use a single, configurable fib level for pullback entries.
• Detects market structure via confirmed swing highs/lows using a rolling window.
• Draws Supply/Demand zones (bearish/bullish rectangles) from the latest MSS (CHOCH or BOS) event.
• Computes intra zone Fib guide rails and keeps them extended in real time.
• Triggers BUY only inside bullish zones and SELL only inside bearish zones when price touches the selected fib and closes back beyond it (bounce confirmation).
• Optional labels print BULL/BEAR + fib next to the triangle markers.
What it does
Finds structure using confirmed swing highs/lows (you choose the confirmation length).
Builds the latest zone (bullish = demand, bearish = supply) after a CHOCH/BOS event.
Draws intra-zone “guide rails” (Fib lines) and extends them live.
Signals only with the trend of that zone:
BUY inside a bullish zone when price tags the selected Fib and closes back above it.
SELL inside a bearish zone when price tags the selected Fib and closes back below it.
Optional labels print BULL/BEAR + Fib next to triangles for quick context
Why this is different
Most “zone + fib + signal” tools bolt together several indicators, or fire counter-trend signals because they don’t fully respect structure. TFZB is intentionally minimal:
Single bias source: the latest confirmed zone defines direction; nothing else overrides it.
Single entry rule: one Fib bounce (0.3/0.5/0.6 selectable) inside that zone—no counter-trend trades by design.
Clean visuals: you can show only the most recent zone, clamp overlap, and keep just the rails that matter.
Deterministic & transparent: every plot/label comes from the code you see—no external series or hidden smoothing
How it helps traders
Cuts decision noise: you always know the bias and the only entry that matters right now.
Forces discipline: if price isn’t inside the active zone, you don’t trade.
Adapts to volatility: pick 0.3 in strong trends, 0.5 as the default, 0.6 in chop.
Non-repainting zones: swings are confirmed after Structure Length bars, then used to build zones that extend forward (they don’t “teleport” later)
How it works (details)
*Structure confirmation
A swing high/low is only confirmed after Structure Length bars have elapsed; the dot is plotted back on the original bar using offset. Expect a confirmation delay of about Structure Length × timeframe.
*Zone creation
After a CHOCH/BOS (momentum shift / break of prior swing), TFZB draws the new Supply/Demand zone from the swing anchors and sets it active.
*Fib guide rails
Inside the active zone TFZB projects up to five Fib lines (defaults: 0.3 / 0.5 / 0.7) and extends them as time passes.
*Entry logic (with-trend only)
BUY: bar’s low ≤ fib and close > fib inside a bullish zone.
SELL: bar’s high ≥ fib and close < fib inside a bearish zone.
*Optionally restrict to one signal per zone to avoid over-trading.
(Optional) Aggressive confirm-bar entry
When do the swing dots print?
* The code confirms a swing only after `structureLen` bars have elapsed since that candidate high/low.
* On a 5-min chart with `structureLen = 10`, that’s about 50 minutes later.
* When the swing confirms, the script plots the dot back on the original bar (via `offset = -structureLen`). So you *see* the dot on the old bar, but it only appears on the chart once the confirming bar arrives.
> Practical takeaway: expect swing markers to appear roughly `structureLen × timeframe` later. Zones and signals are built from those confirmed swings.
Best timeframe for this Indicator
Use the timeframe that matches your holding period and the noise level of the instrument:
* Intraday :
* 5m or 15m are the sweet spots.
* Suggested `structureLen`:
* 5m: 10–14 (confirmation delay \~50–70 min)
* 15m: 8–10 (confirmation delay \~2–2.5 hours)
* Keep Entry Fib at 0.5 to start; try 0.3 in strong trends, 0.6 in chop.
* Tip: avoid the first 10–15 minutes after the open; let the initial volatility set the early structure.
* Swing/overnight:
* 1h or 4h.
* `structureLen`:
* 1h: 6–10 (6–10 hours confirmation)
* 4h: 5–8 (20–32 hours confirmation)
* 1m scalping: not recommended here—the confirmation lag relative to the noise makes zones less reliable.
Inputs (all groups)
Structure
• Show Swing Points (structureTog)
o Plots small dots on the bar where a swing point is confirmed (offset back by Structure Length).
• Structure Length (structureLen)
o Lookback used to confirm swing highs/lows and determine local structure. Higher = fewer, stronger swings; lower = more reactive.
Zones
• Show Last (zoneDispNum)
o Maximum number of zones kept on the chart when Display All Zones is off.
• Display All Zones (dispAll)
o If on, ignores Show Last and keeps all zones/levels.
• Zone Display (zoneFilter): Bullish Only / Bearish Only / Both
o Filters which zone types are drawn and eligible for signals.
• Clean Up Level Overlap (noOverlap)
o Prevents fib lines from overlapping when a new zone starts near the previous one (clamps line start/end times for readability).
Fib Levels
Each row controls whether a fib is drawn and how it looks:
• Toggle (f1Tog…f5Tog): Show/hide a given fib line.
• Level (f1Lvl…f5Lvl): Numeric ratio in . Defaults active: 0.3, 0.5, 0.7 (0 and 1 off by default).
• Line Style (f1Style…f5Style): Solid / Dashed / Dotted.
• Bull/Bear Colors (f#BullColor, f#BearColor): Per-fib color in bullish vs bearish zones.
Style
• Structure Color: Dot color for confirmed swing points.
• Bullish Zone Color / Bearish Zone Color: Rectangle fills (transparent by default).
Signals
• Entry Fib for Signals (entryFibSel): Choose 0.3, 0.5 (default), or 0.6 as the trigger line.
• Show Buy/Sell Signals (showSignals): Toggles triangle markers on/off.
• One Signal Per Zone (oneSignalPerZone): If on, suppresses additional entries within the same zone after the first trigger.
• Show Signal Text Labels (Bull/Bear + Fib) (showSignalLabels): Adds a small label next to each triangle showing zone bias and the fib used (e.g., BULL 0.5 or BEAR 0.3).
How TFZB decides signals
With trend only:
• BUY
1. Latest active zone is bullish.
2. Current bar’s close is inside the zone (between top and bottom).
3. The bar’s low ≤ selected fib and it closes > selected fib (bounce).
• SELL
1. Latest active zone is bearish.
2. Current bar’s close is inside the zone.
3. The bar’s high ≥ selected fib and it closes < selected fib.
Markers & labels
• BUY: triangle up below the bar; optional label “BULL 0.x” above it.
• SELL: triangle down above the bar; optional label “BEAR 0.x” below it.
Right-Panel Swing Log (Table)
What it is
A compact, auto-updating log of the most recent Swing High/Low events, printed in the top-right of the chart.
It helps you see when a pivot formed, when it was confirmed, and at what price—so you know the earliest bar a zone-based signal could have appeared.
Columns
Type – Swing High or Swing Low.
Date – Calendar date of the swing bar (follows the chart’s timezone).
Swing @ – Time of the original swing bar (where the dot is drawn).
Confirm @ – Time of the bar that confirmed that swing (≈ Structure Length × timeframe after the swing). This is also the earliest moment a new zone/entry can be considered.
Price – The swing price (high for SH, low for SL).
Why it’s useful
Clarity on repaint/confirmation: shows the natural delay between a swing forming and being usable—no guessing.
Planning & journaling: quick reference of today’s pivots and prices for notes/backtesting.
Scanning intraday: glance to see if you already have a confirmed zone (and therefore valid fib-bounce entries), or if you’re still waiting.
Context for signals: if a fib-bounce triangle appears before the time listed in Confirm @, it’s not a valid trade (you were too early).
Settings (Inputs → Logging)
Log swing times / Show table – turn the table on/off.
Rows to keep – how many recent entries to display.
Show labels on swing bar – optional tags on the chart (“Swing High 11:45”, “Confirm SH 14:15”) that match the table.
Recommended defaults
• Structure Length: 10–20 for intraday; 20–40 for swing.
• Entry Fib for Signals: 0.5 to start; try 0.3 in stronger trends and 0.6 in choppier markets.
• One Signal Per Zone: ON (prevents over trading).
• Zone Display: Both.
• Fib Lines: Keep 0.3/0.5/0.7 on; turn on 0 and 1 only if you need anchors.
Alerts
Two alert conditions are available:
• BUY signal – fires when a with trend bullish bounce at the selected fib occurs inside a bullish zone.
• SELL signal – fires when a with trend bearish bounce at the selected fib occurs inside a bearish zone.
Create alerts from the chart’s Alerts panel and select the desired condition. Use Once Per Bar Close to avoid intrabar flicker.
Notes & tips
• Swing dots are confirmed only after Structure Length bars, so they plot back in time; zones built from these confirmed swings do not repaint (though they extend as new bars form).
• If you don’t see a BUY where you expect one, check: (1) Is the active zone bullish? (2) Did the candle’s low actually pierce the selected fib and close above it? (3) Is One Signal Per Zone suppressing a second entry?
• You can hide visual clutter by reducing Show Last to 1–3 while keeping Display All Zones off.
Glossary
• CHOCH (Change of Character): A shift where price breaks beyond the last opposite swing while local momentum flips.
• BOS (Break of Structure): A cleaner break beyond the prior swing level in the current momentum direction.
• MSS: Either CHOCH or BOS – any event that spawns a new zone.
Extension ideas (optional)
• Add fib extensions (1.272 / 1.618) for target lines.
• Zone quality score using ATR normalization to filter weak impulses.
• HTF filter to only accept zones aligned with a higher timeframe trend.
⚠️ Disclaimer This script is provided for educational purposes only.
Past performance does not guarantee future results.
Trading involves risk, and users should exercise caution and use proper risk management when applying this strategy.

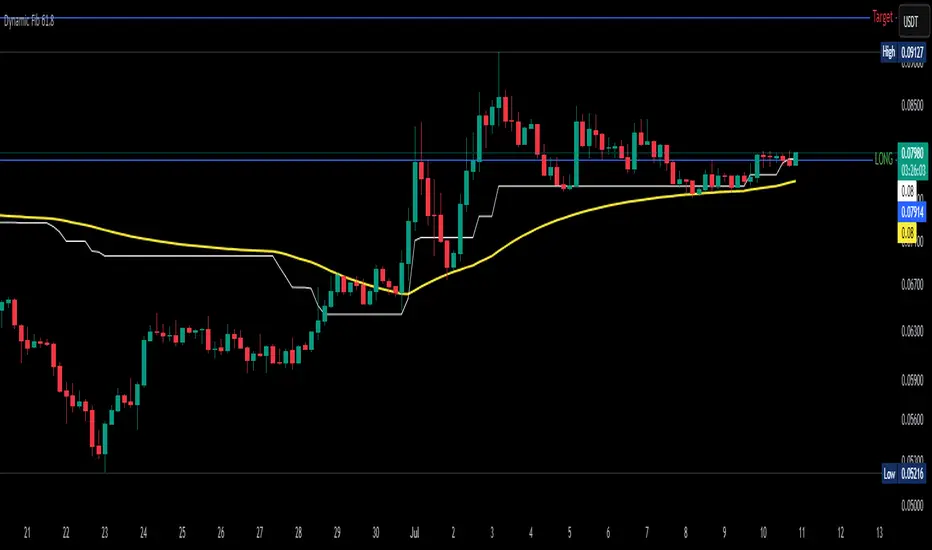
Dynamic Fib 61.8Dynamic Fib 61.8 Indicator – Full Guide
1. Overview
This indicator plots a dynamic 61.8% Fibonacci retracement level, adjusted for market volatility and smoothed using an EMA for cleaner signals. Unlike traditional static Fib levels, this version auto-adjusts based on recent price swings, making it more responsive to changing market conditions.
Key Features:
✅ Auto-Adjusting 61.8% Fib Level – Adapts to the highest high/lowest low over a user-defined period.
✅ EMA Smoothing – Reduces noise for more reliable support/resistance.
✅ Breakout Alerts – Built-in alerts for when price crosses the Fib level.
✅ Inverse Chart Support – Works on both regular and inverse price scales.
2. How to Use This Indicator
Primary Use Case:
Trend Retracement Entry: The 61.8% level often acts as a reversal zone in trending markets.
Breakout Confirmation: A decisive close above/below the smoothed Fib level suggests trend continuation.
Support/Resistance Flip: Watch for price reactions at this level for intraday/swing trades.
Input Parameters:
Input Default Description
Lookback Period 52 Determines how far back the highest high/lowest low is calculated. Higher = slower reaction, lower = more sensitive.
EMA Smoothing 3 Controls how much the Fib level is smoothed (higher = smoother but laggier).
Invert Price Scale Off Flips the calculation for inverse charts (e.g., for crypto perpetuals).
3. Interpretation & Trading Rules
Bullish Scenario (Buy Dips):
Price retraces to the smoothed Fib 61.8 level in an uptrend.
Confirmation: Wait for bullish candlestick patterns (hammer, engulfing) or RSI > 50.
Entry: Long on a bounce, stop-loss below recent swing low.
Bearish Scenario (Sell Rallies):
Price retraces to the smoothed Fib 61.8 level in a downtrend.
Confirmation: Bearish rejection (shooting star, bearish engulfing) or RSI < 50.
Entry: Short on rejection, stop-loss above recent swing high.
Breakout Trading:
If price closes decisively above/below the smoothed Fib level, it may signal trend continuation.
Volume & Momentum Confirmation: Use with MACD/RSI for stronger signals.
4. Best Confluence Indicators
This indicator works best when combined with:
A. Momentum Oscillators
RSI (14):
Look for oversold (RSI < 30) near Fib support in uptrends.
Look for overbought (RSI > 70) near Fib resistance in downtrends.
MACD:
Bullish: MACD crossing above signal line near Fib support.
Bearish: MACD crossing below signal line near Fib resistance.
B. Volume Analysis
Volume Spike + Fib Bounce = Strong Reversal Signal
Low Volume at Fib Retest = Potential Fakeout
C. Moving Averages
50 EMA/200 EMA Alignment:
If price is above 200 EMA and retests Fib 61.8, it’s a high-probability long.
If price is below 200 EMA and rejects Fib 61.8, it’s a high-probability short.
D. Price Action Patterns
Engulfing, Pin Bars, Inside Bars at the Fib level add confirmation.
5. Example Strategy
Setup:
Trend Identification – Price is above 200 EMA (uptrend).
Retracement to Smoothed Fib 61.8 – Price pulls back to the dynamic level.
Confirmation – Bullish hammer forms + RSI > 50.
Entry – Buy with stop below recent swing low.
Target – Previous high or 1.618 Fib extension.
6. Limitations & Adjustments
Choppy Markets: The Fib level may give false signals (use ATR filter).
Optimal Period Adjustment:
For day trading, reduce Lookback Period (e.g., 20-30).
For swing trading, increase (e.g., 50-100).
EMA Smoothing: If too slow, increase smoothing to 5-10.
Final Thoughts
This indicator is best used as a dynamic support/resistance tool rather than a standalone system. Combining it with momentum filters, volume, and price action significantly improves accuracy.
50% Fib Trend Cloud + ATR BandsThis indicator plots two structural 50% fibonacci midpoints from recent confirmed 'left/right' swings that form a *cloud* of equilibrium, then adds a rolling 50% fibonacci range midpoint based on a lookback window that's wrapped in ATR bands. Importantly, it solves a specific trading problem:
Structural midpoints (macro context) are powerful but can lag when price escapes prior ranges. Enter rolling 50% fib + ATR ➡️ which restores real-time balance & tolerance (micro context). Together they show where price is balanced structurally, where it’s balanced right now, and how much volatility to tolerate before acting.
➖➖➖
🔑 Why this is different
Most tools either draw a single midpoint (ex., daily 50%) or ATR bands around a moving average. This script fuses dual swing-based 50% midpoints (structure) + a rolling 50% with ATR (flow), so you don’t lose context when price escapes prior ranges. The cloud tells you who’s in control (fast vs. slow structure). The rolling 50% + ATR tells you how far is “too far” now.
➖➖➖
🧠 What it does (at a glance)
🔸Structural Equilibrium × 2 (Fib1/Fib2)
Two independent 50% midpoints formed from swing pivots (configurable Left/Right bars + optional smoothing). Their gap is the Midpoint Cloud = structural “fair value” zone.
🔸Rolling 50% + ATR Bands
A rolling highest/lowest window computes an always-current 50% rolling midpoint plot; ±ATR × length envelopes define a soft value area and over-stretch boundaries.
🔸Actionable Visuals
Optional fill between Fib1/Fib2, labels, and candle-overlay modes to instantly read regime (above both / below both / between).
🔸Smart Defaults
Timeframe-aware presets for L/R pivots & smoothing; full manual overrides available.
➖➖➖
⚙️ Calculations (plain-English)
🔸Pivot midpoints (Fib1 & Fib2):
1) Detect a swing using `Left/Right` bars
2) Take the swing’s high/low → compute 50%
3) (Optional) Smooth the line (SMA) to stabilize on noisy TFs
4) Repeat with a different sensitivity to get two distinct midpoints
🔸Rolling midpoint:
Highest High / Lowest Low over the last *N* bars → (HH + LL) / 2
🔸ATR levels:
`Upper = Rolling50 + ATR × Mult`, `Lower = Rolling50 − ATR × Mult`
(Typical: ATR length 14–21; Multipliers 2.236 for L1, 5.382 for L2)
➖➖➖
🤖 Auto-Configured Presets (with Manual Override)
💡Goal: make the midpoints “just work” on common timeframes while still letting you dial them in.
💡How Auto Presets work
When Auto Presets = ON, the script picks sensible L/R/S (Left bars / Right bars / Smoothing) for Fib Trend 1 and Fib Trend 2 based on chart timeframe.
🔸Fib 1 (fast) emphasizes *micro-structure* for quicker bias shifts.
🔸Fib 2 (slow) emphasizes *macro-structure* for anchor/bias context.
These defaults keep Fib 1 responsive without jitter and Fib 2 stable without lag.
➡️ Turn Auto Presets = OFF to take full control with the manual inputs described below.
➖➖➖
🛠 Manual Fib Midpoint Settings (when Auto = OFF)
💡Each midpoint uses three knobs:
🔸Pivot Left (L): bars to the left that must be lower/higher to qualify a swing
🔸Pivot Right (R): bars to the right that must be lower/higher to confirm the swing
🔸Smoothing (S): SMA period applied to the raw 50% midpoint (stabilizes noise)
5-Minute optimized defaults
🔸Fib Trend 1: `L21 / R5 / S55` → responsive local structure (entries/exits, re-balancing zones)
🔸Fib Trend 2: `L55 / R13 / S89` → broader structure (trend context, anchors/stops)
Timeframe guidance
🔸1m–3m: may feel a touch laggy → consider ~`L13 / R3 / S34`
🔸15m–1h: defaults remain strong → optionally ~`L34 / R8 / S89`
🔸4h+ : increase span for stability → `L89–144 / R13–21 / S144–233`
➡️ Rule of thumb: shorter L/R = faster detection, longer S = smoother line. Tune until Fib 1 captures the “active swing” and Fib 2 captures the “dominant swing” without whipsaw.
➖➖➖
🎛 Inputs (quick reference)
🔸Fib Trend 1/2: Source (High/Low/Close), Left/Right bars, Smoothing length, Show/Hide, Cloud fill toggle
🔸Rolling 50%: Lookback length, Price basis (Wicks/Close/HLC3/OHLC4), Plot scope (Full / Last N / None)
🔸ATR Bands: ATR length, Multipliers (L1/L2), Plot scope, Line width/colors
🔸Overlay & Labels: Candle overlay mode, Label padding/size, 50% centerline toggle, Plot widths
➖➖➖
🖍️ Candle Coloring & Overlay Modes
💡Purpose: make trend instantly visible on the candles and ATR levels.
1) Color Logic (dropdown)
🔸 Fib Midpoints — Colors by position of price vs. Fib 1 & Fib 2
🔸ATR Zones — Colors by which ATR zone price is in relative to the Rolling 50%
➡️ Price Reference: Choose the input used for the decision (Close, HL2, OHLC3, OHLC4).
➡️Tip: Close is crisp; HL2/OHLC variants are smoother.
2) Overlay Style (dropdown)
🔸 None — No visual change to candles
🔸 Bar Color — Uses `barcolor()` to tint built-in candles (this takes into account your Trading View settings, for instance if you have wicks set to white, they will show up as white with this setting)
🔸 PlotCandles — Draws unified custom candles (body, wick, border) with the same color for maximum clarity
💡Practical use
🔸 Pick Fib Midpoints to read structural bias at a glance (above/below/between the cloud).
🔸 Pick ATR Zones to read value vs. stretch around the Rolling 50% (mean-reversion vs. trend extension).
➖➖➖
📘 How to use
A) Trend confirmation
- Strong bullish bias when price holds above both structural mids; strong bearish when below both.
- Use the Rolling 50% + ATR as a dynamic re-entry zone: pullbacks that respect ATR(L1) often continue the prevailing trend.
B) Transition / mean reversion
- Inside the Cloud (between Fib1 & Fib2) treat behavior as neutralization/re-balancing; range tactics tend to outperform momentum plays.
- In ranges, fades near ±ATR around the rolling 50% can mark short-term edges.
C) Breakout context
- When price leaves the Cloud, the Rolling 50% keeps you anchored so price never feels “floating.” A clean hold outside ATR(L1/L2) suggests regime strength; quick re-entries hint at traps.
➖➖➖
🖼 Chart examples
➡️ Each snapshot shows how the Cloud (structure) and the Rolling 50% + ATR (flow) work together.
1) 1-Minute Downtrend – Cloud as Dynamic Ceiling
- The Cloud slopes down; pullbacks repeatedly fail under the Cloud’s underside.
- Rolling 50% (dashed mid) + ATR(L1) act as a reversion band: rallies stall near upper ATR and rotate lower.
2) 15-Minute Persistent Drift – Structure Guides, Flow Times Entries
- Long drift lower with Cloud overhead.
- Consolidations near the rolling mid resolve in the trend direction; ATR bands frame risk on each attempt.
3) 15-Minute Uptrend (BTC) – From Cloud Escape to Value Stair-Step
- After escaping the prior Cloud, rolling 50% + ATR establish a new higher value area.
- Pullbacks into ATR(L1) produce orderly stair-steps; Cloud remains supportive on deeper dips
4) 5-Minute BTC – Pullback to Value then Rotate
- Strong leg up; retrace tags lower ATR band and rotates back toward the rolling mid.
- Labels (Fib1/Fib2) make the structural context explicit for decision-making.
➖➖➖
🧪 Starter presets
- Intraday (5–15m): Fib1 ~ L21/R5 (smooth 5), Fib2 ~ L55/R13 (smooth 9) • Rolling = 55 • ATR = 14 • L1 = 2.5x, L2 = 5.0x
- Scalping: Shorten lookbacks & smoothing; keep ATR multipliers similar, or tighten L1.
- Swing: Lengthen all lookbacks; consider ATR length 21–28.
➖➖➖
🏁Final Word
This script is not just a visual tool, it’s a complete trend and structure framework. Whether you're looking for clean trend alignment, dynamic support/resistance, or early warning signs of a reversal, this system is tuned to help you react with confidence — not hindsight.
Rembember, no single indicator should be used in isolation. For best results, combine it with price action analysis, higher-timeframe context, and complementary tools like trendlines, moving averages etc Use it as part of a well-rounded trading approach to confirm setups — not to define them alone.
---
💡Turn logic into clarity. Structure into trades. And uncertainty into confidence.

3 Zigzag for MTF Fib Alert [MsF]Japanese below / 日本語説明は英文の後にあります。
-------------------------
This indicator that automatically displays Fibonacci from each High & Low based on 3 Zigzags. It's useful for multi-timeframe analysis.
For example, Fibonacci calculated from the high and low prices (Zigzag 3 Period=100) of the upper timeframe can be displayed on the lower timeframe.
Also, you can set alerts for each Fibonacci point. It is useful when you are waiting for the price to return to the discount (50% or less) or the premium (50% or more) of the upper timeframe.
"Fib 1 - Crossing 0.00" … Trigger an alert when crossing the 0% line in Fibonacci of Zigzag1
"Fib 1 - Crossing 100.0" … Trigger an alert when crossing the 100% line in Fibonacci of Zigzag1
"Fib 1 - Crossing 23.6" … Trigger an alert when crossing the 23.6% line in Fibonacci of Zigzag1
"Fib 1 - Crossing 38.2" … Trigger an alert when crossing the 38.2% line in Fibonacci of Zigzag1
"Fib 1 - Crossing 50.0" … Trigger an alert when crossing the 50.0% line in Fibonacci of Zigzag1
"Fib 1 - Crossing 61.8" … Trigger an alert when crossing the 61.8% line in Fibonacci of Zigzag1
"Fib 1 - Crossing 76.4" … Trigger an alert when crossing the 76.4% line in Fibonacci of Zigzag1
*Same as Zigzag 1 and Zigzag 2 too.
"Choose Zig Zag Leg for fib" parameter means...
Latest : Calculate Fibonacci based on "the most recent Zigzag line".
Previous : Calculate Fibonacci based on "the previous Zigzag line".
-------------------------
3つのZigzagを元に各High&Lowからフィボナッチを自動で表示するインジケーターです。
Zigzagの期間を工夫することで、マルチタイムフレーム分析に役立ちます。
例えば、以下の設定とした場合:
Zigzag 1 Period … 8
Zigzag 2 Period … 25
Zigzag 3 Period … 100
上位時間足Zigzag(Period=100)の高値安値から形成されるフィボナッチを下位時間足に表示することができるのです。
また、このインジケーターではフィボナッチのポイント毎にアラートの設定が可能です。
上位時間足の割安価格(50%以下)や割高価格(50%以上)に価格が戻ってくるのを待っている時などに力を発揮してくれます。
"Fib 1 - Crossing 0.00" … Zigzag1のフィボナッチにおいて、0%ラインとクロスした場合にアラートを発報します
"Fib 1 - Crossing 100.0" … Zigzag1のフィボナッチにおいて、100%ラインとクロスした場合にアラートを発報します
"Fib 1 - Crossing 23.6" … Zigzag1のフィボナッチにおいて、23.6%ラインとクロスした場合にアラートを発報します
"Fib 1 - Crossing 38.2" … Zigzag1のフィボナッチにおいて、38.2%ラインとクロスした場合にアラートを発報します
"Fib 1 - Crossing 50.0" … Zigzag1のフィボナッチにおいて、50.0%ラインとクロスした場合にアラートを発報します
"Fib 1 - Crossing 61.8" … Zigzag1のフィボナッチにおいて、61.8%ラインとクロスした場合にアラートを発報します
"Fib 1 - Crossing 76.4" … Zigzag1のフィボナッチにおいて、76.4%ラインとクロスした場合にアラートを発報します
※Zigzag1およびZigzag2のフィボナッチも同様
"Choose Zig Zag Leg for fib"パラメータについて:
Latest … 一番新しいZigzagのライン(UpまたはDown)を元にフィボナッチを計算します。
Previous … ひとつ前のZigzagのライン(UpまたはDown)を元にフィボナッチを計算します。

Rolling Fibonacci Pivot Points [QuantNomad]Standard Fibonacci Pivot Points are calculated from the previous day (or another period) close/low/high. But what is the day close for cryptocurrencies trading 24/7 on exchange? Does it make sense to use a specific time price as a close if it continue trading after that?
So I decided to solve that issue with Rolling Fibonacci Pivot Points where I calculate pivot points not at the end of the period but for every bar. Every time recalculating pivot points I look at a window of period length in bars and base my calculations on these bars. This way you get smooth pivot points changing with every bar and it seems like levels might be really nice support and resistance for the price.
I implemented 6 periods: Auto, Day, Week, Month, Quarter, Year. For the Auto period, I select the most suitable period for the timeframe of your chart.
On the chart, you can see by default 7 levels plotted:
PP – Pivot Point
S1 – Support on 0.382 fib level
S2 – Support on 0.618 fib level
S3 – Support on 1.000 fib level
R1 – Resistance on 0.382 fib level
R2 – Resistance on 0.618 fib level
R3 – Resistance on 1.000 fib level
Also in parameters you can display additional midpoints:
S0.5 – Support on 0.236 fib level
S1.5 – Support on 0.500 fib level
S2.5 – Support on 0.786 fib level
R0.5 – Resistance on 0.236 fib level
R1.5 – Resistance on 0.500 fib level
R2.5 – Resistance on 0.786 fib level
####################
It's a pro indicator, you can have access to it for a small fee. Link to my PRO indicators you can find in my signature.
####################
Disclaimer
Please remember that past performance may not be indicative of future results.
Due to various factors, including changing market conditions, the strategy may no longer perform as good as in historical backtesting.
This post and the script don’t provide any financial advice.
