TradeChartist Essential MTF Screener™TradeChartist Essential MTF Screener is an adaptive and powerful multi time frame screener toolkit for several essential trading indicators like RSI, Stochastic, CCI, MACD, 15 different Moving Averages, Heikin Ashi Trend and Net Volume, which can be visualised as a singular Indicator plot or as MTF Screener blocks showing absolute or trend-based colour coded Bull/Bear Strength along with real-time indicator value labels.
===================================================================================================================
™𝗧𝗿𝗮𝗱𝗲𝗖𝗵𝗮𝗿𝘁𝗶𝘀𝘁 𝗘𝘀𝘀𝗲𝗻𝘁𝗶𝗮𝗹 𝗠𝗧𝗙 𝗦𝗰𝗿𝗲𝗲𝗻𝗲𝗿 𝗨𝘀𝗲𝗿 𝗠𝗮𝗻𝘂𝗮𝗹
====================================================
MTF Screener can be used as a singular Time Frame screener plot or as colour coded screener blocks with several Time Frames (based on Time Frame Multiplier inputs) and based on user preference of the indicator such as RSI, Stoch, CCI, MACD, one of 15 Moving Averages, Heikin Ashi Trend or Net Volume from the 𝐈𝐧𝐝𝐢𝐜𝐚𝐭𝐨𝐫 𝐓𝐲𝐩𝐞 dropdown.
For RSI, Stoch, MACD and Moving Averages, Source price is required from the Sᴏᴜʀᴄᴇ dropdown (default - close). Sᴍᴏᴏᴛʜɪɴɢ input can be used to smooth the plot.
RSI, CCI and Stoch lengths are 14 as default and each of them have Uᴘᴘᴇʀ Bᴀɴᴅ and Lᴏᴡᴇʀ Bᴀɴᴅ inputs, which decides the colour of the screener block.
MACD has 3 inputs namely - Fᴀsᴛ Lᴇɴɢᴛʜ , Sʟᴏᴡ Lᴇɴɢᴛʜ and Sᴍᴏᴏᴛʜɪɴɢ and the default is the classic settings (12,26,9). Type of MA used can be chosen from under 𝟰. 𝗠𝗼𝘃𝗶𝗻𝗴 𝗔𝘃𝗲𝗿𝗮𝗴𝗲 section of the indicator settings. For classic MACD, use EMA which is default.
Moving Average has two inputs namely - MA ᴛʏᴘᴇ (which allows one of 15 Moving Averages) and MA Lᴇɴɢᴛʜ (default - 55).
Heikin Ashi Trend and Net Volume do not need any inputs.
===================================================================================================================
𝗠𝗧𝗙 𝗦𝗰𝗿𝗲𝗲𝗻𝗲𝗿 𝗕𝗹𝗼𝗰𝗸𝘀
Screener blocks are plotted as default and each row represents a specific Time Frame based on the Time Frame Multiplier (Default - 11 TF Multipliers from 1 to 2 in steps of 0.1) entered by the user in the 𝗦𝗰𝗿𝗲𝗲𝗻𝗲𝗿 𝗣𝗹𝗼𝘁𝘀 section. There are 11 maximum rows or Time Frame Multipliers that can be displayed. For example, if the user wants just 4 timeframes say, 1hr, 2hr , 4hr and Daily on a 1hr chart, the user should enter 4 in 𝐍𝐮𝐦𝐛𝐞𝐫 𝐨𝐟 𝐌𝐓𝐅 𝐒𝐜𝐫𝐞𝐞𝐧𝐞𝐫𝐬 input box and enter 1, 2, 4 and 24 in the Time-Frame Multiplier input boxes.
The Screener block colour can be changed from the settings. Each Screener row will have the data labels displayed in real-time as default ( Aʟʟᴏᴡ Rᴇᴘᴀɪɴᴛɪɴɢ (Cᴜʀʀᴇɴᴛ HTF Dᴀᴛᴀ) ). Disabling this will have Higher Time Frame data lag based on previous HTF close. Real-time data is recommended for live prices/data as it helps see the current dynamic.
Hᴇɪᴋɪɴ Asʜɪ Sᴄʀᴇᴇɴᴇʀ plots data based on Heikin Ashi chart on normal candle/bar chart.
Tʀᴇɴᴅ Bᴀsᴇᴅ Sᴄʀᴇᴇɴᴇʀ (ʀsɪ, sᴛᴏᴄʜ, ᴄᴄɪ) plots color coded screener blocks based on Upper and Lower bands input from the user. The colors change only when the upper/lower band is breached for the first time since the opposite band breach.
The MTF Screener blocks can be used visually on price chart by just moving the MTF Screener to main chart with the default Separate Screener Pane - Default under Lᴀʙᴇʟs Dɪsᴘʟᴀʏ Tʏᴘᴇ to keep the labels on chart. Having separate scales for security price and MTF Screener makes it possible to view the screener blocks on main chart.
Screener overlaid on Price Chart disables the MTF screener blocks but shows the MTF labels on price chart.
MTF Screener block colours can be changed from Screener Blocks colour settings and the Screener Label colour can be changed from Screener Label Colour settings.
===================================================================================================================
𝗦𝗰𝗿𝗲𝗲𝗻𝗲𝗿 𝗜𝗻𝗱𝗶𝗰𝗮𝘁𝗼𝗿 𝗣𝗹𝗼𝘁
Screener Indicator Plot is a singular plot of the user preferred timeframe multiplier (entered in Iɴᴅɪᴄᴀᴛᴏʀ Pʟᴏᴛ Tɪᴍᴇғʀᴀᴍᴇ Mᴜʟᴛɪᴘʟɪᴇʀ input box) of the Essential Indicator selected by the user.
To display the indicator plot, enable Dɪsᴘʟᴀʏ Iɴᴅɪᴄᴀᴛᴏʀ Pʟᴏᴛ (ᴅɪsᴀʙʟᴇs sᴄʀᴇᴇɴᴇʀ) . For example, if the selected plot is RSI, this displays RSI of the chosen Time Frame Multiplier along with the MTF Screener Labels without the blocks.
Screener Indicator Plot colours can be changed from Indicator/Screener Label colour settings and the Label colour can be changed from Lᴀʙᴇʟ Cᴏʟᴏᴜʀ (ғᴏʀ ɪɴᴅɪᴄᴀᴛᴏʀ ᴘʟᴏᴛ) .
The example chart below shows the use of both MTF Screener Blocks and Screener Indicator Plots of various essential indicators.
===================================================================================================================
Note: ™TradeChartist Essential MTF Screener is not a Signal generator and doesnt always reflect the trend when using MTF Screener blocks. Using relatively higher Time Frame Multipliers can cause late trade entries on chart time frame. The Screener and labels help visualize the values and the relative trend where sensible using colour codes. Users must devise personal techniques to exploit and use this tool to suit their trading needs.
===================================================================================================================
Example Charts
1. BTC-USDT 1hr chart using multiple MTF Screeners
2. BTC-USDT 1hr chart using Net Volume Indicator Plot and MACD MTF Screener on chart.
3. BTC-USDT 4hr chart using Daily Heikin Ashi Trend plotted on the main chart + Daily RSI indicator plot on a separate MTF Screener pane connected to ™TradeChartist Plotter to display Divergences on Price chart.
4. BTC-USDT 4 hr chart as above example, connected to ™TradeChartist FibMaster to plot Auto Fibs and display Bull/Bear Zones based on RSI 60/40 breakout trends.
5. BTC-USDT 4 hr chart with 20 period Weekly Hull MA plotted on Main chart with 4hr, Daily and 3D 20 period Hull MA value labels with Daily MACD Indicator Plot with 1hr, 4hr and 12 hr MACD real-time value labels.
===================================================================================================================
Best Practice: Test with different settings first using Paper Trades before trading with real money
===================================================================================================================
This is not a free to use indicator. Get in touch with me (PM me directly if you would like trial access to test the indicator)
Premium Scripts - Trial access and Information
Trial access offered on all Premium scripts.
PM me directly to request trial access to the scripts or for more information.
===================================================================================================================
Cari dalam skrip untuk "fib"

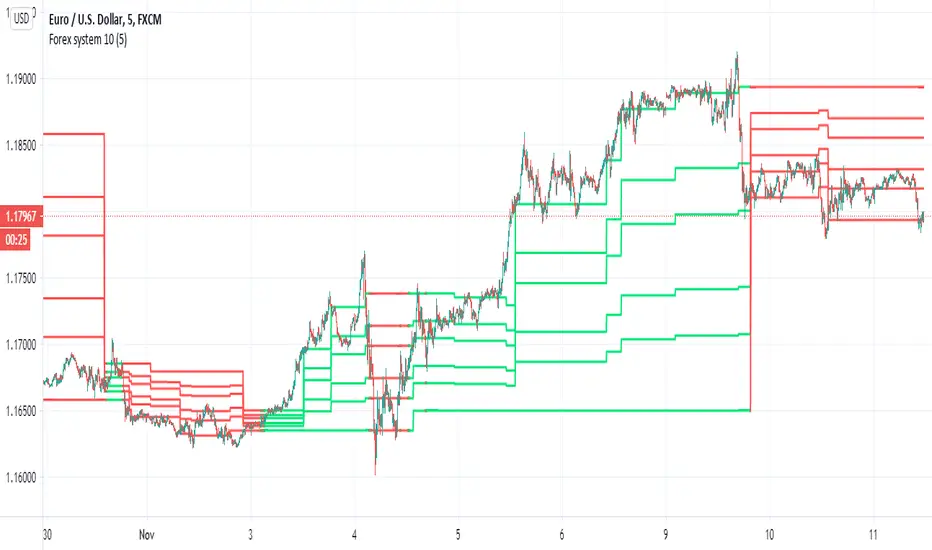
Forex system 10This is old method I used in the past for forex
can be apply to any time frame . can be apply to any asset
all you have to do is to follow the colors (red =sell, green=buy)
the system is my modification to fibs system in order to make it more accurate
here is example of setting for 5 min chart
the color determine by cross of the median of high and low
the script try to give us more accurate levels of resistance and support levels especially when we do it in lower TF
the Min is the control need to be same or higher then chart
60 min chart for example
gold 60 min
btc
another forex example 15 min
here 60 min TF on 5 min chart on crypto link
EOD TraderMy EOD (End of Day) system for trading on the daily timeframe with minimum stress. Just pair the built-in alerts with the bot of your choice and then let the indicator do the rest. It'll determine the current trend, filter out as much noise as possible and then take you from long to short.
There are options to toggle the following:
Auto fibonacci levels with alerts for the look-back period of your choosing
Auto support and resistance with alerts
Alerts for the price closing above/below the 50MA
A coloured background to show the trend direction (green = up, red = down)
The fib and support levels can be handy when trying to determine when best to take profit or even exit the trade entirely.
Important: I personally use Heikin Ashi candles with this script to further filter entries. An option is available within the script settings to toggle this on/off should you wish to do the same.
This is a premium script. Please DM me for access.

Dynamic Dots Dashboard (a Cloud/ZLEMA Composite)The purpose of this indicator is to provide an easy-to-read binary dashboard of where the current price is relative to key dynamic supports and resistances. The concept is simple, if a dynamic s/r is currently acting as a resistance, the indicator plots a dot above the histogram in the red box. If a dynamic s/r is acting as support, a dot is plotted in the green box below.
There are some additional features, but the dot graphs are king.
_______________________________________________________________________________________________________________
KEY:
_______________________________________________________________________________________________________________
Currently the dynamic s/r's being used in the dot plots are:
Ichimoku Cloud:
Tenkan (blue)
Kijun (pink)
Senkou A (red)
Senkou B (green)
ZLEMA (Zero Lag Exponential Moving Average)
99 ZLEMA (lavender)
200 ZLEMA (salmon)
You'll see a dashed line through the middle of the resistances section (red) and supports section (green). Cloud indicators are plotted above the dashed line, and ZLEMA's are below.
_______________________________________________________________________________________________________________
How it Works - Visual
_______________________________________________________________________________________________________________
As stated in the intro - if a dynamic s/r is currently above the current price and acting as a resistance, the indicator plots a dot above the histogram in the red box. If a dynamic s/r is acting as support, a dot is plotted in the green box below. Additionally, there is an optional histogram (default is on) that will further visualize this relationship. The histogram is a simple summation of the resistances above and the supports below.
Here's a visual to assist with what that means. This chart includes all of those dynamic s/r's in the dynamic dot dashboard (the on-chart parts are individually added, not part of this tool).
You can see that as a dynamic support is lost, the corresponding dot is moved from the supports section at the bottom (green), to the resistances section at the top (red). The opposite being true as resistances are being overtaken (broken resistances are moved to the support section (red)). You can see that the raw chart is just... a mess. Which kinda of accentuates one of the key goals of this indicator: to get all that dynamic support info without a mess of a chart like that.
_______________________________________________________________________________________________________________
How To Use It
_______________________________________________________________________________________________________________
There are a lot of ways to use this information, but the most notable of which is to detect shifts in the market cycle.
For this example, take a look at the dynamic s/r dots in the resistances category (red background). You can see clearly that there are distinctive blocks of high density dots that have clear beginnings and ends. When we transition from a high density of dots to none in resistances, that means we are flipping them as support and entering a bull cycle. On the other hand, when we go from low density of dots as resistances to high density, we're pivoting to a bear cycle. Easy as that, you can quickly detect when market cycles are beginning or ending.
Alternatively, you can add your preferred linear SR's, fibs, etc. to the chart and quickly glance at the dashboard to gauge how dynamic SR's may be contributing to the risk of your trade.
_______________________________________________________________________________________________________________
Who It's For
_______________________________________________________________________________________________________________
New traders: by looking at dot density alone, you can use Dot Dynamics to spot transitionary phases in market cycles.
Experienced traders: keep your charts clean and the information easy to digest.
Developers: I created this originally as a starting point for more complex algos I'm working on. One algo is reading this dot dashboard and taking a position size relative to the s/r's above and below. Another cloud algo is using the results as inputs to spot good setups.
Colored Bars
There is an option (off by default, shown in the headline image above) to fill the bar colors based on how many dynamic s/r's are above or below the current price. This can make things easier for some users, confusing for others. I defaulted them to off as I don't want colors to confuse the primary value proposition of the indicators, which is the dot heat map. You can turn on colored bars in the settings.
One thing to note with the colored bars: they plot the color purely by the dot densities. Random spikes in the gradient colors (i.e. red to lime or green) can be a useful thing to notice, as they commonly occur at places where the price is bouncing between dynamic s/r's and can indicate a paradigm shift in the market cycle.
_______________________________________________________________________________________________________________
Timeframes and Assets
_______________________________________________________________________________________________________________
This can be used effectively on all assets (stocks, crypto, forex, etc) and all time frames. As always with any indicator, the higher TF's are generally respected more than lower TF's.
Thanks for checking it out! I've been trading crypto for years and am just now beginning to publish my ideas, secret-sauce scripts and handy tools (like this one). If you enjoyed this indicator and would like to see more, a like and a follow is greatly appreciated 😁.

Automatic Risk to Reward PivotsIn a nutshell I was tired of guestimating what my risk was between pivots when getting into trades I went to work on the basic math behind the relationship of the pivots to find their natural risk to reward ratios.
The natural risk to rewards span high and low...for example...you can go from the S3 --> R3 and that R:R is with a stop loss of the S4 is 7.4
But making all of those possibilities in code is excessive and for simplicity sake I price can only be between two pivot areas at any point in time.
So this auto risk to reward is limited to the 2:1 opportunities. If you by chance do the math for all of the possibilities as I have then it would be easy to change the Take Profit levels.
I use the fibonacci pivot points in this indicator but I include the mid levels and further extensions totaling 20 levels, 21 including the pivot.
Here they are...the generic plots are bolded...the additional levels are the other fib levels
R7 - 200%
R6 - 162%
R5 - 141%
R4 - 127%
R3 - 100%
R-C - 76%
R2 - 62%
R-B - 50%
R1 - 38%
R-A - 24%
Pivot
S-A - (24%)
S1 - (38%)
S-B - (50%)
S2 - (62%)
S-C - (76%)
S3 - (100%)
S4 - (127%)
S5 - (141%)
S6 - (162%)
S7 - (200%)
The indicator give you the setups for uptrends and downtrends based on the pivot point moving averages (ex. ema(hlc3, 34)) from a higher timeframe which you will be free to change yourself in the inputs.
For my setup, I trade from the daily pivots using the 10m or 5m chart so my next level up is the weekly pivots which I view using the 1H chart candles.
In the next iterations I will add the ability to change the MA lengths.
Pivot Point Moving average lengths
Weekly lengths - fast 34 : slow 55
Monthly lengths - fast 13 : slow 34
Yearly lengths - fast 13 : slow 34
Rules for Uptrends
Fast MA > Slow MA
Session high < r6
Rules for Downtrends
Fast MA < Slow MA
Session high > s6
Timeframes applicable are only those who have a higher pivot set above it
Monthly_SR = 240m, 300m, D
Weekly_SR = 26m, 30m, 60m
Daily_SR = 1m, 3m, 5m, 10m, 15m
Your take profit line will always populate where your risk will be 2:1
Your stop loss will always be one pivot level underneath or above your entry
Feel free to ask any questions. Trade well my friends!

SHARP PIVOTS (INTRADAY LEVELS) Hi friends,,
This indicator is based on modified fib levels.
Buy above 23.7% from recent low and sell below 72.7% from recent high.
15 mins close above or below the entry levels Recommended.
use Heiken Ashi candles for trend confirmation.
USE RSI 60/40(UNCONVENTIONAL) For additional conformation

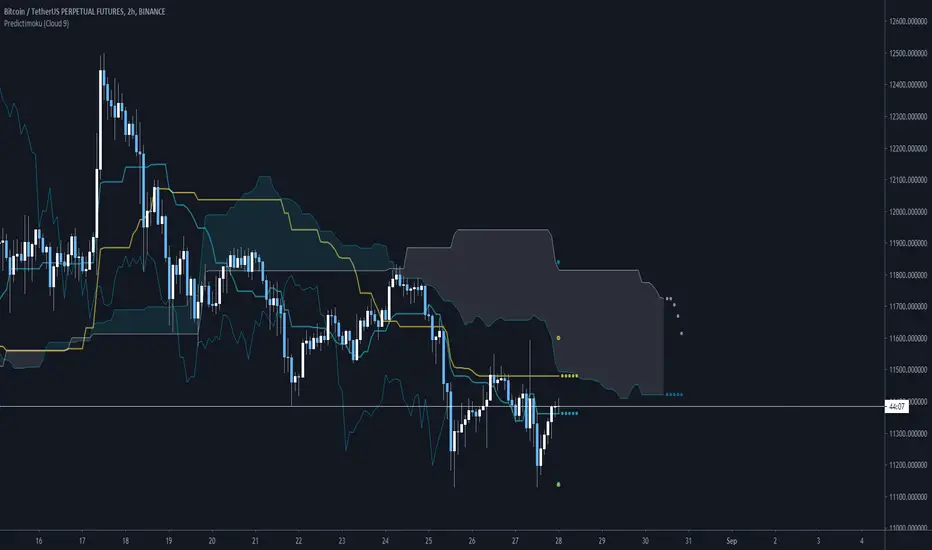
Predictimoku (Cloud 9) - Modified Ichimoku by Cryptorhythms [CR] Predictimoku (Cloud 9) - Modified Ichimoku by Cryptorhythms
📜Intro
New spin on the old standby ichimoku!
Predictimoku (Cloud 9): This indicator uses a proprietary algo to forecast the kijun tenkan & senkou spans accurately out into the future.
📋Background
Unfortunately you may have seen it around twitter as part of a paid for course with indicator set. These influencers claim its "their proprietary indicator". Well the truth is that the source code was stolen from me without payment by some folks who will remain nameless... Then they published the indicator as a private script to avoid moderation/ban (cowards!)
Lesson learned... this is why you never trust anyone until the money is in your hand. And if you see the indicator in the wild as part of some "guru's" overpriced course you will know who the thieves are!
But I wouldnt let that injustice or their shady behavior stand. So that now means you all will get access to it because I am providing it free for the public! :)
📋Features and How to Use
You use this indicator in all the same ways as you would use traditional ichimoku, the underlying structure is the same. Though the default settings are using doubled lookback lengths as per "crypto standard."
The extra functionality comes in the form of accurate and non repainting forecast of up to 17 bars for the kijun, tenkan and senkou spans! This can be useful in many ways for instance it can show you ahead of time when a kumo twist will happen, or a tenkan/kijun cross, etc!
💠Here is an example of the 17 bar forecast:
💠Here is an example of the Trading Range option to show you where price would need to go to force a recalculation of the forecasts. It also provides areas of interest for PA reactions.
💠Last an example of the fibonacci spread. By default the Auto Fib's lookback length is set to 60 to match the kijun lookback. This generally produces a nice framework for near future price action.
💠Look for some more new and unique ichimoku based indicators coming soon from us! :)
About Us
👍 We hope you enjoyed this indicator and find it useful! We post free crypto analysis, strategies and indicators regularly. This is our 84th script on Tradingview! Check signature for more information.
ORB 15 Min FIB retracement by fnohouseretracement logic applied to find out range breakout on 30 minute

Globex RangesGlobexRanges. How the market moves over night helps determine what the market may do the next day. In this indicator I have used fib levels as well as the globex range levels.

CCI w/ SMA averages DS2This is a simple yet powerful indicator using the CCI and CCI average. I have included Buy (B) and Sell (S) signals in it. Those signals work best when used in conjunction with an Anchor chart and a trigger chart. Where the Anchor chart is of higher time frame and the trigger chart with B and sell signals is used for the entries. Keep on mind when trading to don't let it go red.....ie. the trade. Hope is not a trading option to continually make money. Know your trade set up entries and exits. Wether they are fib levels are a certain amount on ticks.

Simple Fibonacci RetracementSimple Fibonacci Retracement is a free and easy to use script to plot Fibonacci levels, for any assets like Stocks, Forex, Commodities , Cryptocurrencies etc. on any time frame chart.
Fibonacci Levels can be plotted using Lookback or manual Price input from the settings.
1. Lookback type - Candles
Determines the High and Low price of the user input number of Candles back (100 default) and plots Fibonacci Levels based on the calculated High and Low for the number of candles in the past from the current candle. The levels stay intact on any time frame as long as no new Highs or Lows are formed.
2. Lookback type - Days
Determines the High and Low price of the user input number of Days back (100 default) and plots Fibonacci Levels based on the calculated High and Low for the number of days in the past from the day of the current bar. The levels stay intact on any time frame as long as no new Highs or Lows are formed.
3. Manual Price Input
Plots Fibonacci Levels based on the user specified High and Low Price in the settings input fields. The levels stay intact on any time frame irrespective of new Highs or Lows being formed. Manual Price Input will enable the trader to keep the Levels intact and visually see the higher Fibonacci Retracement levels, when the price crosses beyond 100% retracement. On the other two lookback types, the Fibonacci levels are displayed only upto 100% retracement.
The Fibonacci levels can also be reversed by enabling 'Reverse' option from the settings.
M4x FIB-o-matic V3.6M4x is a combination of RSI and Fibonacci components, set up with fixed values, so no worries about "original" settings...
Recommendet Bot settings:
- use one short and one long bot
- take profit 0.5%
- 6 simul trades
- 3 security orders, VolScale 1.5, StepScale 1.4
- Deviation 0.35%
- cooldown 780sec
Alerts:
- aproved Buy
- aproved Sell
- heartbeat (..check if Script is running. Gives you the possibility to get an alive Signal every minute)
(With a few "input" M4x can be changed into a highly configurable Signal Generator with menus.)
...tested successful with BTC-ETH, gl ;-)

TB_Monday's Range Break Outs & RetraceTB Monday's Retracements v1.0
The indicator is designed to zone off Monday's Range of Candles and measure specified retracement areas during the course of that particular week.
Mondays BRK OUT Highs and Lows are also measuerd to indicate the potential direction of the market with potential head and shoulders patterns being the result.
After break out and retracement tp specified fib levels the indicator offers alerts when the conditioons are satisfied.
If you would like to enquire about access to this invite only script please send me a private message on trading view and I will be happy to assist. Thank you.

Ultimate Pivot PointsLately, there are a plethora of Pivot scripts on TV, I'll be adding one more :3
This is a combination that I use for my personal use so I've coded accordingly. Its the best combination of the regular pivot, woodie pivot, fib, and cams, in my humble opinion. Also added previous day high and low as those are the key levels for intraday traders.
Also, this is a multi-timeframe version.
Enjoy~

Bull Market BarrierThis is a very special band of long-term Bollinger Bands derived from Fib values, and is specifically made for Bitcoin .
It represents one of, if not the strongest dynamic resistance in the BTCUSD market, and divides the market into bull and bear cycles.
The BMB uses the BLX long-term data.

Volatility based Standarde Deviation and Fib. Pivot PointsThis indicator plots Standard deviation levels and Fib. Pivot Points. I prefer to use only SD levels but Fib. levels also come handy in providing support and resistance.
How to use this indicator:
You have to manually enter instrument's Closing Price / Settlement Price and VIX closing price to draw each day's levels.
For NQ, I use VXN closign price and for ES or RTY, I use VIX closing price.
This indicator can be used on individual stocks and forex pairs.

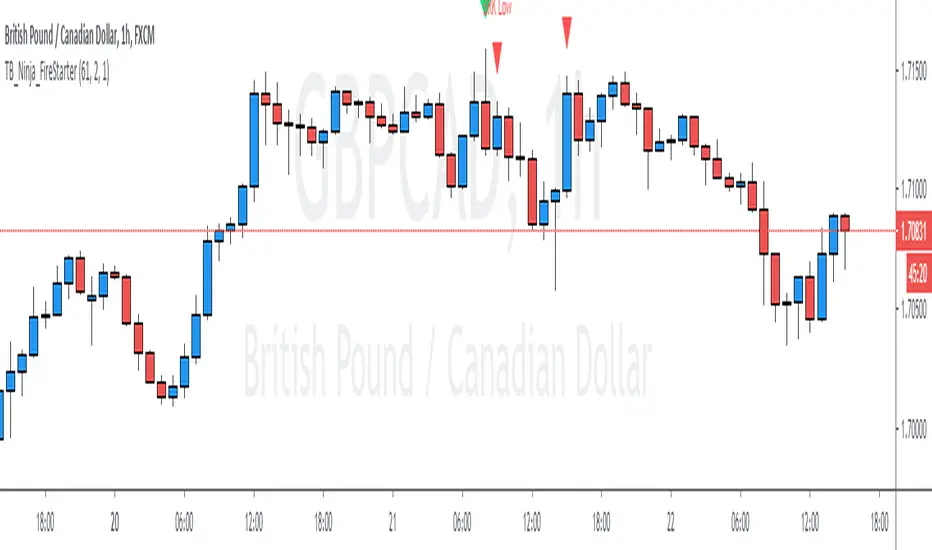
TB_Ninja_FireStarterTB_Ninja_FireStarter v1.0
This indicator measures a break out and retracement on swing HIGH/LOW Candles.
The swing may be marked manually by the user and the bar count adjusted ahead for a retracement range. Fib zones are utilised.
The swing HIGH/LOW Pattern is identified by the user based on market analysis and the indicator applied in accordance with those decisions.
Alerts are available for the Break Out and Retracement zones.
This is NOT a trading system and should be used with supporting information and data. It is not identifying or is meant to represent a standalone trading system.
If you would like to enquire about access to this invite only script please send me a private message on trading view and I will be happy to assist. Thank you.
[AngelHouse] All Eating Assistance Indicator_v1.0Hello, I'm Angelhouse, a crypto analyst and developer of the index :)
The All Eating Assistance Indicator is an indicator created to support the All Eating Strategy Index and is a strategic indicator created for trading in the crypto market.
★ Describe the All Eating Assistance Indicator
1. Pivot Points Standard : Provides a Pivot Points Standard indicator. The corresponding indicator is R1/R2/R3 and the resistance line is S1/S2/S3 represents the support line. Strangely enough, the stock always reaches the line.
2. Auto Fib: Show Fibre automatically following the previous high and low points. If you want to check for a recent or more historical Fibre, you can change the Deviation and Depth values.
3. Month Information Label: Shows the highest, lowest, and Closer values of the stock price for a month.
※ If you want to obtain access to this indicator with a script dedicated for the first time, please contact the link shown in the signature.

Rain On Me IndicatorFinally, we made it :D
Rain On Me Indicator, As the name suggests this indicator will make money rain on you. More seriously, this indicator contains :
This indicator contains:
-Bullish and bearish RSI divergences showing on chart with alerts.
-Parabolic SAR with Labels on chart with buying or selling alerts.
-3 Moving Average (MA 1 : 7, MA 2 : 21 MA 3 HIDDEN : 50 (Cross alerts for Pullback)
-Customizable Bollinger band
-Fibonacci on 10 levels with the level 0 to the middle. This Fibonacci help a lot since it can let you find easily entry/exit point, trend and even where to place your Take Profit and Stop Loss. It have alerts for most important levels (0.382, 0.§, 0.618) for Crossunder and Crossover in Bullish or Bearish trend.
-Fully Customizable Ichimoku Cloud.
-Trend Buy/Sell Labels on chart with buying or selling signal alerts.
-Trend color visible on candles.
If an alert trigger of Buy/Sell Signal with the same alert based on PSAR, so you can be confident to enter in position. Alway checking fibs level that is the key thing with this indicator. the script has been set to have the best possible results on as many market as possible. But.best result for zfter backtesting is on
Forex : EUR/USD, USDJPY, USDCAD.
Indice : S&P500, NASDAQ, DOWJONES
Commodities : OIL, WTI
Everything work on following timeframe :
15MN, 1H, 4H, DAILY, WEEKLY.
So that you can avoid having to set it again, whether it be in minutes, hours, days, months.
So you can easily trade in the mode that suits you best. It works well on everything from indices to forex to commodities etc. I thank all those who allowed me to carry out this project. IF you feelt free to give your ideas, suggestions, for improve it by sending me messages.
This is really a first version sp it may contain bugs / errors that will be fixed over time.
A BIG THANK YOU TO QUANTNOMAD WHO GIVE ME HIS PERMISSION TO USE, MODIFY AND REPUBLISH HIS "Ultimate Pivot Points Alerts" Script Indicator :
Good trade to all !

DUOT OSCILLATORDuot Oscillator is an indicator combining the performance of multiple differential oscillators (RSI, ROC, WCCI, MACD, BBB)
The oscillators are normalized and triple smoothed using a variant of McGuinley Dynamic MA formula, the final result is also then triple smoothed over a fib series.
The final oscillator was found to produce higher success rate when detecting divergence over using either individual signals for each of the oscillators on its own, or a weighted signal of a subset of the mentioned oscillators.
We were not able to verify, hypothesis, or find a reasoning for that claim, but following the divergences of that oscillator were more accurate at least in our setups since Feb 2019 on BTCUSD
Duot oscillator along with William Vix fix and Simple 3 MAs are the main decision makers behind Duot Strategy
Settings:
- Date Selectors
- Normalize Lookback (for all oscillators)
- Minimize parameters (this will use the same MAs Lookbacks for all oscillators, should be fine but if you want to use any parameters optimizers, you can disable that setting and fine tune each individually)
- Oscillators Lookback: if the above checkbox is checked then this value will be used for all oscillators(generally fine except for RSI)
- MAs Lookback for individual oscillators
- William Vix Fix Settings

Fibonacci Bollinger Bands Alerts [QuantNomad]These are alerts for my Fibonacci Bollinger Bands Strategy. You can find more details and strategy description in it:
It's a pro indicator, you can have access to it for a small fee. Link to my PRO indicators you can find in my signature.
Disclaimer
Please remember that past performance may not be indicative of future results.
Due to various factors, including changing market conditions, the strategy may no longer perform as good as in historical backtesting.
This post and the script don’t provide any financial advice.
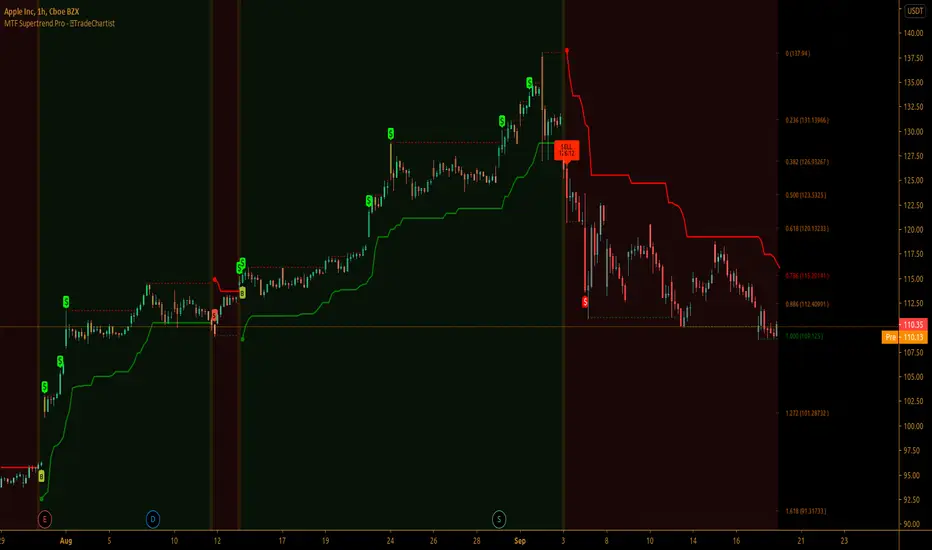
TradeChartist MTF Supertrend Pro™TradeChartist MTF SuperTrend Pro is the Multi Time-Frame version (using timeframe multiplier) of classic Volatility Stop or SuperTrend (Stop and Reverse indicator using multiple of Average True Range of lookback period trailing behind the price acting as both trend reversal signifier and StopLoss trigger at the same time ).
What does ™TradeChartist MTF SuperTrend Pro include?
Multi Time-Frame option using Time-Frame Multiplier to plot Higher Time Frame SuperTrend plot on Lower Time-Frame chart.
Auto-fibs - 2 types (1. Retracement from last significant high/low to previous significant low/high, 2. Retracement from Current High/Low to previous significant Low/High).
Trend identifying color bars.
Trend identifying Background colour.
Option to detect bars where Profit Taking is recommended using $ sign.
How to create Alerts for ™TradeChartist MTF SuperTrend Pro Long and Short Entries?
Alerts can be created for Long or Short entries using Once Per Bar as BUY and SELL labels appear with entries only on confirmation after bar close.
Does the indicator include Stop Loss and Take Profit plots?
This script doesn't have Stop Loss and Take Profit plots, but it can be connected to TradeChartist Plug and Trade as Non-Oscillatory signal to generate Automatic Targets, user set StopLoss and Take Profit plots and to create all types of alerts too.
Does this indicator repaint?
No. This script doesn't repaint as it confirms its signals only after close above/below SuperTrend plot and also uses security function to call higher time-frame values in the right way to avoid repainting. This can be verified using Bar Replay to check if the plots and fills stay in the same bar in real time as the Bar Replay.
===================================================================================================================
Tip 1: Using 1.618 as Timeframe Multiplier results in lucrative trades on most timeframes with ATR multiplier 1.618, 2.618 or 3.618. (Best Practice: Test with various values first on asset using Paper Trades before trading with real money)
Tip 2: Using bars, candles with no borders or Hollow Candles results in clear trend spotting with Bar color option enabled in settings.
===================================================================================================================
Chart below shows Performance of MTF SuperTrend Pro connected to Plug and Trade using Default settings.
===================================================================================================================
This is not a free to use indicator. Get in touch with me (PM me directly if you would like trial access to test the indicator)
Premium Scripts - Trial access and Information
Trial access offered on all Premium scripts.
PM me directly to request trial access to the scripts or for more information.
===================================================================================================================
Bollinger levelesSimilar to VRSI level script , only this time I use bolliger
plus add similar to a fib system to it
the cross up or down of high and low are optional if you want to see as L=low.h = high
so it a bollinger just it look different:)
