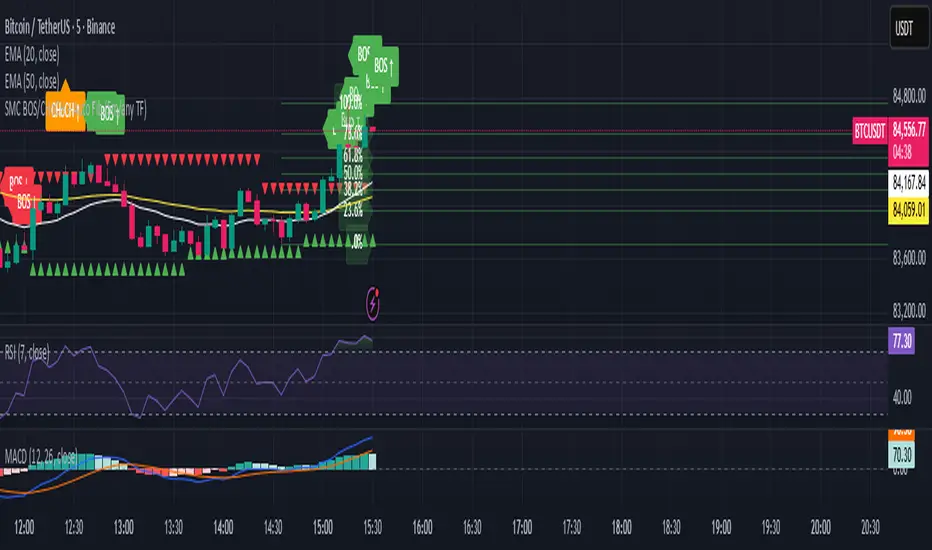
SMC BOS/CHoCH + Auto Fib (5m/any TF) durane//@version=6
indicator('SMC BOS/CHoCH + Auto Fib (5m/any TF)', overlay = true, max_lines_count = 200, max_labels_count = 200)
// --------- Inputs ----------
left = input.int(3, 'Pivot Left', minval = 1)
right = input.int(3, 'Pivot Right', minval = 1)
minSwingSize = input.float(0.0, 'Min swing size (price units, 0 = disabled)', step = 0.1)
fib_levels = input.string('0.0,0.236,0.382,0.5,0.618,0.786,1.0', 'Fibonacci levels (comma separated)')
show_labels = input.bool(true, 'Show BOS/CHoCH labels')
lookbackHighLow = input.int(200, 'Lookback for structure (bars)')
// Parse fib levels
strs = str.split(fib_levels, ',')
var array fibs = array.new_float()
if barstate.isfirst
for s in strs
array.push(fibs, str.tonumber(str.trim(s)))
// --------- Find pivot highs / lows ----------
pHigh = ta.pivothigh(high, left, right)
pLow = ta.pivotlow(low, left, right)
// store last confirmed swings
var float lastSwingHighPrice = na
var int lastSwingHighBar = na
var float lastSwingLowPrice = na
var int lastSwingLowBar = na
if not na(pHigh)
// check min size
if minSwingSize == 0 or pHigh - nz(lastSwingLowPrice, pHigh) >= minSwingSize
lastSwingHighPrice := pHigh
lastSwingHighBar := bar_index - right
lastSwingHighBar
if not na(pLow)
if minSwingSize == 0 or nz(lastSwingHighPrice, pLow) - pLow >= minSwingSize
lastSwingLowPrice := pLow
lastSwingLowBar := bar_index - right
lastSwingLowBar
// --------- Detect BOS & CHoCH (simple robust logic) ----------
var int lastBOSdir = 0 // 1 = bullish BOS (price broke above), -1 = bearish BOS
var int lastBOSbar = na
var float lastBOSprice = na
// Look for price closes beyond last structural swings within lookback
// Bullish BOS: close > recent swing high
condBullBOS = not na(lastSwingHighPrice) and close > lastSwingHighPrice and bar_index - lastSwingHighBar <= lookbackHighLow
// Bearish BOS: close < recent swing low
condBearBOS = not na(lastSwingLowPrice) and close < lastSwingLowPrice and bar_index - lastSwingLowBar <= lookbackHighLow
bosTriggered = false
chochTriggered = false
if condBullBOS
bosTriggered := true
if lastBOSdir != 1
// if previous BOS direction was -1, this is CHoCH (change of character)
chochTriggered := lastBOSdir == -1
chochTriggered
lastBOSdir := 1
lastBOSbar := bar_index
lastBOSprice := close
lastBOSprice
if condBearBOS
bosTriggered := true
if lastBOSdir != -1
chochTriggered := lastBOSdir == 1
chochTriggered
lastBOSdir := -1
lastBOSbar := bar_index
lastBOSprice := close
lastBOSprice
// --------- Plot labels for BOS / CHoCH ----------
if bosTriggered and show_labels
if chochTriggered
label.new(bar_index, high, text = lastBOSdir == 1 ? 'CHoCH ↑' : 'CHoCH ↓', style = label.style_label_up, color = color.new(color.orange, 0), textcolor = color.white, yloc = yloc.abovebar)
else
label.new(bar_index, high, text = lastBOSdir == 1 ? 'BOS ↑' : 'BOS ↓', style = label.style_label_left, color = lastBOSdir == 1 ? color.green : color.red, textcolor = color.white, yloc = yloc.abovebar)
// --------- Auto Fibonacci drawing ----------
var array fib_lines = array.new_line()
var array fib_labels = array.new_label()
var int lastFibId = na
// Function to clear previous fibs
f_clear() =>
if array.size(fib_lines) > 0
for i = 0 to array.size(fib_lines) - 1
line.delete(array.get(fib_lines, i))
if array.size(fib_labels) > 0
for i = 0 to array.size(fib_labels) - 1
label.delete(array.get(fib_labels, i))
array.clear(fib_lines)
array.clear(fib_labels)
// Decide anchors for fib: if lastBOSdir==1 (bullish) anchor from lastSwingLow -> lastSwingHigh
// if lastBOSdir==-1 (bearish) anchor from lastSwingHigh -> lastSwingLow
if lastBOSdir == 1 and not na(lastSwingLowPrice) and not na(lastSwingHighPrice)
// bullish fib: low -> high
startPrice = lastSwingLowPrice
endPrice = lastSwingHighPrice
// draw
f_clear()
for i = 0 to array.size(fibs) - 1 by 1
lvl = array.get(fibs, i)
priceLevel = startPrice + (endPrice - startPrice) * lvl
ln = line.new(x1 = lastSwingLowBar, y1 = priceLevel, x2 = bar_index, y2 = priceLevel, xloc = xloc.bar_index, extend = extend.right, color = color.new(color.green, 60), width = 1, style = line.style_solid)
array.push(fib_lines, ln)
lab = label.new(bar_index, priceLevel, text = str.tostring(lvl * 100, '#.0') + '%', style = label.style_label_right, color = color.new(color.green, 80), textcolor = color.white, yloc = yloc.price)
array.push(fib_labels, lab)
if lastBOSdir == -1 and not na(lastSwingHighPrice) and not na(lastSwingLowPrice)
// bearish fib: high -> low
startPrice = lastSwingHighPrice
endPrice = lastSwingLowPrice
f_clear()
for i = 0 to array.size(fibs) - 1 by 1
lvl = array.get(fibs, i)
priceLevel = startPrice + (endPrice - startPrice) * lvl
ln = line.new(x1 = lastSwingHighBar, y1 = priceLevel, x2 = bar_index, y2 = priceLevel, xloc = xloc.bar_index, extend = extend.right, color = color.new(color.red, 60), width = 1, style = line.style_solid)
array.push(fib_lines, ln)
lab = label.new(bar_index, priceLevel, text = str.tostring(lvl * 100, '#.0') + '%', style = label.style_label_right, color = color.new(color.red, 80), textcolor = color.white, yloc = yloc.price)
array.push(fib_labels, lab)
// --------- Optional: plot lastSwing points ----------
plotshape(not na(lastSwingHighPrice) ? lastSwingHighPrice : na, title = 'LastSwingHigh', location = location.absolute, style = shape.triangledown, size = size.tiny, color = color.red, offset = 0)
plotshape(not na(lastSwingLowPrice) ? lastSwingLowPrice : na, title = 'LastSwingLow', location = location.absolute, style = shape.triangleup, size = size.tiny, color = color.green, offset = 0)
// --------- Alerts ----------
alertcondition(bosTriggered and lastBOSdir == 1, title = 'Bullish BOS', message = 'Bullish BOS detected on {{ticker}} @ {{close}}')
alertcondition(bosTriggered and lastBOSdir == -1, title = 'Bearish BOS', message = 'Bearish BOS detected on {{ticker}} @ {{close}}')
alertcondition(chochTriggered, title = 'CHoCH Detected', message = 'CHoCH detected on {{ticker}} @ {{close}}')
// End
Cari dalam skrip untuk "fib"
MTF Pivot Fib Speed Resistance FansOverview
This Pine Script indicator, titled "MTF Pivot Fib Speed Resistance Fans", is a multi-timeframe tool that automatically plots Fib Speed Resistance Fan lines based on pivot structures derived from higher timeframes. It mirrors the functionality of TradingView’s built-in “Fib Speed Resistance Fan” drawing tool, but in a dynamic, programmatic way. It uses pivot highs and lows to anchor fan projections, drawing forward-facing trend lines that align with well-known Fibonacci ratios and their extensions.
Pivot Detection Logic
The script identifies pivots by comparing the current bar’s high and low against the highest and lowest prices over a user-defined pivot period. This pivot detection occurs on a higher timeframe of your choice, giving a broader and more strategic view of price structure. The script tracks direction changes in the pivot trend and stores only the most recent few pivots to maintain clean and meaningful fan drawings.
Fan Direction Control
The user can select whether to draw fans for "Buys", "Sells", or "Both". The script only draws fan lines when a new directional move is detected based on the pivot structure and the selected bias. For example, in “Buys” mode, a rising pivot followed by another higher low will trigger upward fan projections.
Fib Speed Resistance Levels
Once two pivots are identified, the script draws multiple fan lines from the first pivot outward, at angles defined by a preset list of Fibonacci levels. These fan lines help visualize speed and strength of a price move.
The script also draws a horizontal line from the pivot for additional confluence at the base level (1.0).
Price Level Plotting
In addition to drawing fan lines, the indicator also plots their price levels on the right-hand price scale. This makes it easier for users to visually reference the projected support and resistance levels without needing to trace the lines manually across the chart.
Mapping to TradingView’s "Fib Speed Resistance Fan"
The expanded set of values used in this script is not arbitrary—they closely align with the default and extended levels available in TradingView's built-in "Fib Speed Resistance Fan" tool.
TradingView’s Fib Fan tool offers several levels by default, including traditional Fibonacci ratios like 0.382, 0.5, 0.618, and 1. However, if you right-click the tool and open its settings, you’ll find additional toggles for levels like 1.618, 2.000, 2.618, and even 4.000. These deeper levels are used to project stronger trend continuations beyond the standard retracement zones.
The inclusion of levels such as 0.25, 0.75, and 1.34 reflects configurations that are available when you manually add or customize levels in TradingView’s fan tool. While 1.34 is not a canonical Fibonacci ratio, it is often found in hybrid Gann/Fib methods and is included in some preset templates in TradingView’s drawing tool for advanced users.
By incorporating these levels directly into the Pine Script, the indicator faithfully reproduces the fan structure users would manually draw using TradingView’s graphical Fib Fan tool—but does so programmatically, dynamically, and with multi-timeframe control. This eliminates manual errors, allows for responsive updating, and adds custom visual tracking via the price scale.
These values are standardized within the context of TradingView's Fib Fan tool and not made up. This script automates what the manual drawing tool achieves, with added precision and flexibility.

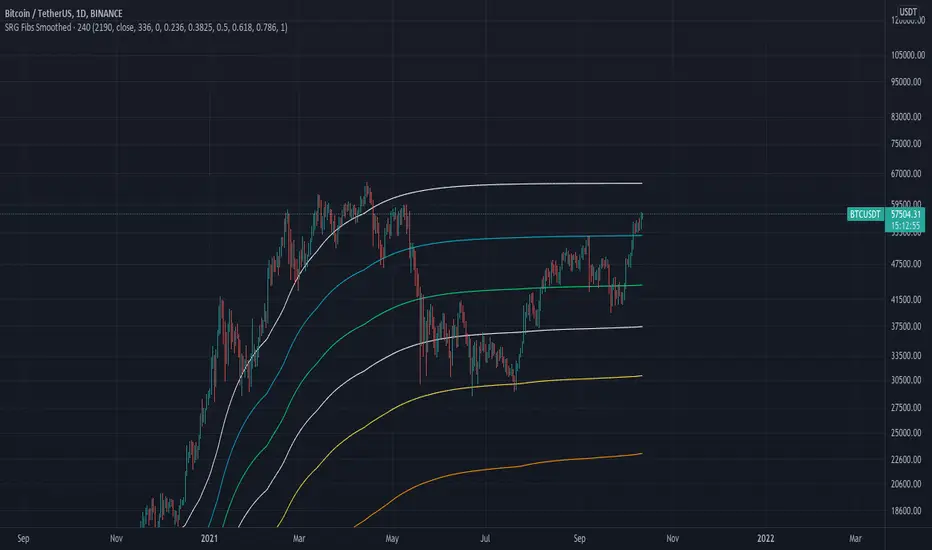
SRG Fibs SmoothedPLEASE READ: HOW TO UNDERSTAND HOW THIS INDICATOR WORKS FOR ME!
Why did I code this?
I never know where is the best place to buy
Sometimes I get greedy and just don't want to sell...
I want to protect myself from losses and still be able to make some trades
What does this do?
This script plots Fibonacci levels dynamically according to a specified length
It also has a smooting value so it looks a bit more clean (and allows for dynamic trailing stop loss)
Internal Fib levels allow to plot fibonacci levels between each main level (scalpers and day traders should be happy with this)
Fib Projection toggle so we can have "the same behaviour" during aggressive Bull Runs.
How to test this thing?
BTC USD Daily chart
For starters, use the following settings:
- Length: 365 (lookback of a full year)
- Smooth: 56 (8 week period)
- Inter Fib levels: OFF
- Fib projection: OFF
Have a look into the chart and check some support/resistance zones. Also check the behaviour of the indicator during the 2021 Jan -> Mar bull run (we will need it later)
If you like to check different time frames. Use these settings:
- Indicator Timeframe: 4 hours
- Length: 2190 (1 year)
- Smooth: 336 (8 weeks)
- Inter Fib Levels: ON
- Fib Projection: OFF
You can now test the chart using the 2H timeframe to see the movement, and how the Internal Fib levels work
Now as we're getting bullish:
- Indicator Timeframe: 4 hours
- Length: 2190 (1 year)
- Smooth: 336 (8 weeks)
- Inter Fib Levels: OFF
- Fib Projection: ON
You can now check the behaviour of the indicator during the 2021 Jan - Mar Bullrun in the 2H or 4H chart, to see some stop loss magic.
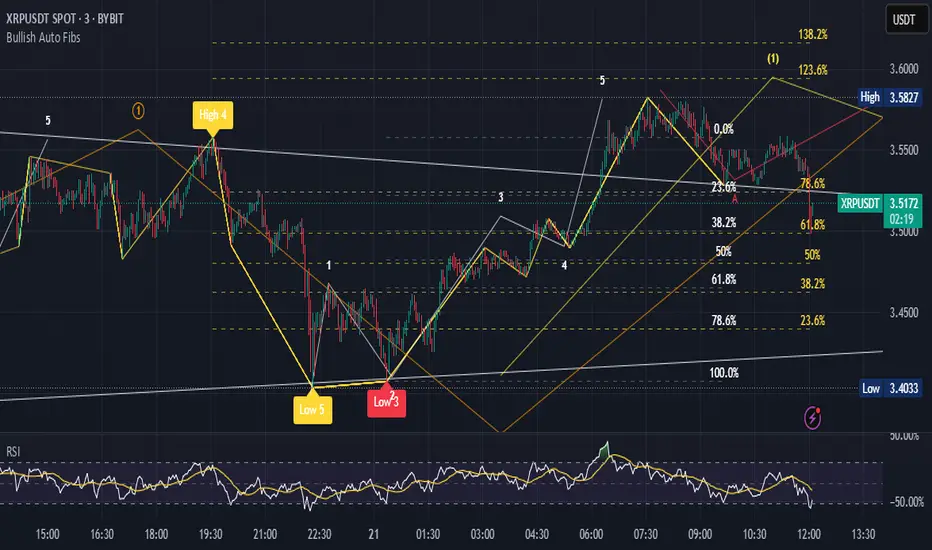
Bullish Auto FibsBullish Auto Fibs Indicator
Description
The Bullish Auto Fibs indicator is a sophisticated tool designed for traders on the TradingView platform, specifically tailored for analyzing bullish price movements on XRP and other assets. It automatically plots Fibonacci retracement, B Wave, and extension levels based on a customizable ZigZag pattern, providing clear visual cues for potential support, resistance, and price targets. With a focus on the 15-minute timeframe, this indicator enhances technical analysis by dynamically updating Fibonacci levels as new pivot highs and lows are detected, ensuring traders stay aligned with evolving market trends.
Key Features:
Automatic Fibonacci Levels: Plots retracement (23.6%, 38.2%, 50%, 61.8%, 78.6%), B Wave (23.6% to 161.8%), and extension (100%, 161.8%, 261.8%) levels.
Dynamic ZigZag Detection: Identifies pivot highs and lows with an adjustable length (1–100 bars, default 20).
Real-Time Updates: Adjusts Fibonacci levels when new highs (for retracements) or lows (for B Wave and extensions) are detected, preserving key reference points like the B Wave pivot high.
Customizable Display: Toggle visibility for retracement, B Wave, and extension levels to suit your analysis needs.
Visual Clarity: Uses distinct colors (gray for retracements, yellow for B Wave, green for extensions) and labels for easy interpretation.
This indicator is ideal for traders employing Elliott Wave theory, Fibonacci-based strategies, or trend-following approaches, offering a robust framework for identifying key price levels in bullish markets.
User Manual
Configuration
The indicator’s settings can be adjusted via the “Settings” panel in TradingView:
Yellow ZigZag Length (default: 20, range: 1–100): Controls the sensitivity of pivot detection. Higher values detect more significant pivots; lower values increase sensitivity for shorter-term swings.
Show Retracement Fibs (default: true): Enable/disable retracement levels (low to high, 0% at high, 100% at low).
Show B Wave Fibs (default: true): Enable/disable B Wave levels (high to low, 100% at high, 0% at low, with extensions up to 161.8%).
Show Extension Fibs (default: true): Enable/disable extension levels (pivot low as 0%, projecting upward).
How It Works
ZigZag Pattern:
The indicator identifies pivot highs and lows using the ta.pivothigh and ta.pivotlow functions, with the specified yellowLength.
Pivots are marked with “H” (high) or “L” (low) labels in yellow.
Fibonacci Levels:
Retracement Fibs: Drawn from a pivot low (100%) to a pivot high (0%). Updates to a new high if detected, maintaining the original low.
B Wave Fibs: Drawn from a pivot high (100%) to a pivot low (0%), with extensions above 100%. Updates to a new low if detected, preserving the original high.
Extension Fibs: Drawn from a pivot low (0%) upward, based on the prior low-to-high wave length. Updates to a new low if detected.
Dynamic Updates:
Lines and labels extend to the current bar for active Fibonacci levels, ensuring real-time relevance.
When a new pivot is detected, previous levels are cleared, and new levels are drawn to reflect the latest price structure.
Usage Tips
Trend Confirmation: Use retracement levels to identify potential support zones during pullbacks in a bullish trend.
B Wave Analysis: Leverage B Wave levels for corrective wave targets, especially in Elliott Wave strategies.
Price Targets: Extension levels highlight potential bullish continuation zones.
Timeframe Flexibility: While optimized for 15-minute charts, adjust yellowLength for higher (e.g., 50–100) or lower (e.g., 5–10) timeframes.
Combine with Other Tools: Pair with trend indicators (e.g., moving averages) or oscillators (e.g., RSI) for enhanced decision-making.
Troubleshooting
No Levels Displayed: Ensure at least two pivots (high and low) are detected. Increase yellowLength if pivots are sparse.
Overlapping Labels: Reduce chart zoom or toggle off unnecessary Fibonacci types to declutter.
Performance Issues: The indicator limits arrays to 500 entries to prevent slowdowns. Older pivots are automatically removed.
Notes
The indicator is optimized for bullish markets but can be adapted for other assets by adjusting the ZigZag length.
For best results, test settings on historical data to align with your trading style.
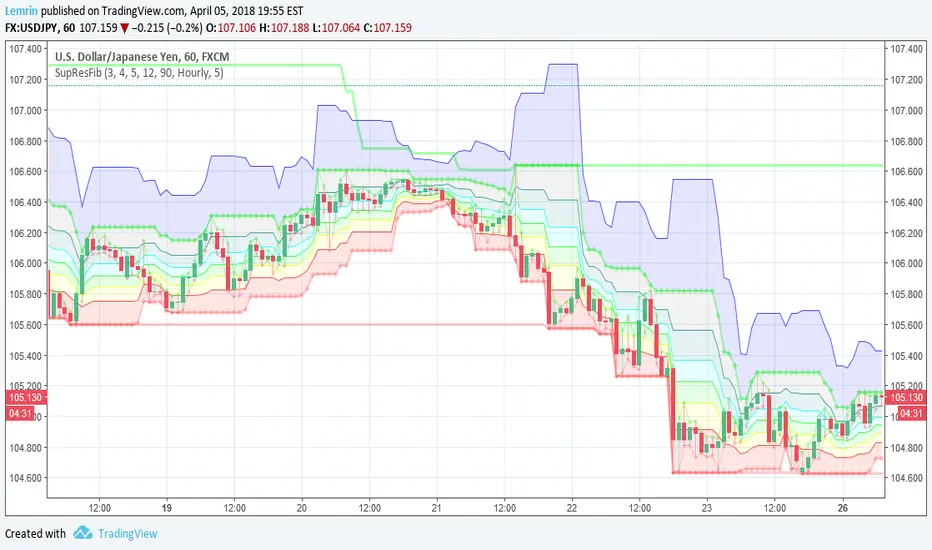
Automatic Support, Resistance, Fibonacci LevelsThis indicator plots absolute high and low values for up to five completely adjustable time periods (in months, weeks, days, hours, minutes) and optionally calculates the Fibonacci levels on the pair of absolutes of your choice, ascending or descending, and mimics the shading available in the built-in Fib charting tools (e.g. retracement).
Here are a few screenshots of the same chart with various options selected.
3-Month, 4-Week, and 5-Day absolutes with 3-Monthly Fib plotted:
The same chart with 4-Weekly Fib:
The same chart with 5-Daily Fib:
5-Day, 12-Hour, 90-Minute absolutes with 12-Hourly Fib:
Zoomed in, on a 30-minute interval, with 90-minute Fib:
With descending ("inverted") 90-minute Fib:
I started putting this together for Vazzyb, who was looking for a way to automate plotting horizontal support and resistance levels for monthly, weekly, and daily extremes, and then I added additional features as they occurred to me. Special thanks to Paaax, who suggested I add Fib levels.
I am leaving the code open, so you may feel free to grab snippets you like and use them for your own purposes. Of particular interest may be my custom "calc_fib()" function, which accepts any series pair, as well as a Boolean indicating whether to invert, and returns an array with each of the major Fibonacci levels: .
If anyone likes this enough to feel generous, please feel free:
BTC
3KmFchJ18QvMzAJKDcFQXvyK9p1EHWQdhP
BCH
qqtrw64ptuwprk5vtj3z8qwkvh3v0jawxq7khqng7x
ETH
0x9b51361A278910Ba3945C7519C9f0FA8a77df18d
LTC
MDeWWsP7XCG2zQuZ2dYALZXQ52u2qkc8fh
P.S. If you want the time lengths to be as close to accurate as possible, don't forget to change the number of days per week when using for cryptocurrency!
Donchian Channels + Fibs//@version=6
indicator(title="Donchian Channels + Fibs", shorttitle="DC Fibs", overlay=true, timeframe="", timeframe_gaps=true)
// --- 1. 输入设置 ---
length = input.int(20, minval = 1, title="Length")
offset = input.int(0, "Offset")
show_fibs = input.bool(true, "Show Fib Levels")
// --- 2. 核心计算 ---
lower = ta.lowest(length) // 0.0 (下轨)
upper = ta.highest(length) // 1.0 (上轨)
basis = math.avg(upper, lower) // 0.5 (中轨)
range_val = upper - lower // 高度
// --- 3. 斐波那契计算 ---
f_786 = lower + range_val * 0.786
f_618 = lower + range_val * 0.618
f_382 = lower + range_val * 0.382
f_236 = lower + range_val * 0.236
// --- 4. 绘图 (已修复样式错误) ---
// 上下轨 (最粗实线)
u = plot(upper, "Upper 1.0", color = #2962FF, linewidth=2, offset = offset)
l = plot(lower, "Lower 0.0", color = #2962FF, linewidth=2, offset = offset)
// 中轴 (中等实线)
plot(basis, "Basis 0.5", color = #FF6D00, linewidth=1, offset = offset)
// 斐波那契内部线
// 修复点:删除了不支持的 style_dashed/dotted,改为默认实线,但保留了透明度
// 0.786 (偏红)
plot(show_fibs ? f_786 : na, "Fib 0.786", color = color.new(#f23645, 30), linewidth=1, offset = offset)
// 0.618 (橙色)
p_618 = plot(show_fibs ? f_618 : na, "Fib 0.618", color = color.new(color.orange, 30), linewidth=1, offset = offset)
// 0.382 (橙色)
p_382 = plot(show_fibs ? f_382 : na, "Fib 0.382", color = color.new(color.orange, 30), linewidth=1, offset = offset)
// 0.236 (偏绿)
plot(show_fibs ? f_236 : na, "Fib 0.236", color = color.new(#089981, 30), linewidth=1, offset = offset)
// --- 5. 背景填充 ---
fill(p_618, p_382, color = color.new(color.orange, 85), title="Golden Zone Fill")
fill(u, l, color = color.rgb(33, 150, 243, 95), title = "Background")

Globex Overnight Futures ORB with FIB's by TenAMTrader📌 Globex Overnight Futures ORB with FIB’s – by TenAMTrader
This indicator is designed for futures traders who want to track the Globex Overnight Opening Range (ORB) and apply Fibonacci projections to anticipate potential support/resistance zones. It’s especially useful for traders who follow overnight sessions (such as ES, NQ, CL) and want to map out key levels before the U.S. regular session begins.
⚙️ How It Works
Primary Range (ORB):
You define a start and end time (default set to 18:00 – 18:15 EST). During this period, the script tracks the session high, low, and midpoint.
Opening Range Plots:
High Line (green)
Low Line (red)
Midpoint Line (yellow)
A shaded cloud between High–Mid and Mid–Low for easy visualization.
Fibonacci Projections:
Once the ORB is complete, the script calculates a full suite of Fibonacci retracements and extensions (e.g., 0.236, 0.382, 0.618, 1.0, 1.618, 2.0).
Standard key levels (0.618, 0.786, 1.0, etc.) are always shown if enabled.
Optional extended levels (1.236, 1.382, 1.5, 2.0, etc.) can be toggled on/off.
"Between Range" fibs (such as 0.382 and 0.618 inside the ORB) are also available for traders who like intra-range precision.
🔧 User Settings
Time Inputs: Choose your ORB start/end time.
Color Controls: Customize high, low, midpoint, and fib line colors.
Display Toggles: Turn on/off High, Low, Midpoint lines and Fibonacci projections.
Fib Extensions Toggle: Decide whether to show only major fibs or all extensions.
Alerts (Optional): Alerts can be set for crossing the ORB High, Low, or Midpoint.
📊 Practical Use Cases
Breakout Traders: Use the ORB high/low as breakout triggers.
Mean Reversion Traders: Watch for rejections near fib extension levels.
Overnight Futures Monitoring: Track Globex behavior to prepare for RTH open.
Risk Management: ORB and Fib levels make for natural stop/target placement zones.
⚠️ Disclaimer
This indicator is provided for educational and informational purposes only. It does not constitute financial advice, investment advice, or trading recommendations. Trading futures involves substantial risk of loss and may not be suitable for all investors. Always do your own due diligence and consult with a licensed financial professional before making trading decisions.

Auto Unlimited Fibs 1.0Still in development, this indicator automatically draws unlimited Fibonacci Retracements so you don't have to keep manually drawing them.
Upwards moves are colored green by default and downward moves are colored red by default, idea being an upward move creates a green retracement level that may be an area to buy and vice versa for short moves. The retracements are drawn on every 3-bar swing high/low, this idea was taken from Inner Circle Trader (ICT). If the move then goes on to retrace past the 0.764 fib retracement, the move is mitigated. If a new high or low is put in the fib gets extended. The mitigation levels are customisable.
Also hides moves that are below a minimum size, as I don't like to see fibs of small moves, these are hidden based on a % of price, customisable in the script.
As the fibs get extended/mitigated and hidden you should end up with all the fibs that are still valid for a retracement.
There is a display option to draw shorter lines as things can get pretty messy with lots of fibs on one chart. Also, bigger moves have longer lines and are slightly brighter in color, shorter moves are shorter lines and duller in color.
Finally the user can customise the amount to show in each direction, so if you only want to see long moves set the Total Short Fibs To Show to 0, or choose 1 of each if you only want to see the most recent smallest fib.

GC-ShorterTimeFrame (STF) (GC)This is a fractal version of the higher time frame Fib for GC . This is a Shorter Time Frame Fib level indicator. To be used with Longer Time frame Indicator. Though it can be used independently. It shows where the market is looking to go and where it has been. When the market get above one level ( white bar, for example) look for price action to continue to the next level (white bar). If it breaks below the white bar look for price action to go the next level below for support. It is fractal in nature. It is fib levels inside longer time frame fib levels. I hope it will impress! More importantly I hope you can make some money! It is great for having targets and support levels. It helps in knowing why the market may continue in a direction. For example: When the price action has already moved up, why does it keep going up, because it hasn't reached targeted fib level, yet. Same reason price action may move lower once it breaks a particular level. It is looking for its fib level support. I know Gold is in the spot light now...as most of the time. This should help trade smaller time frames. If it drops below or goes above this range I can publish more levels..just ask if I forget. Thx

NQLH-LongerTimeFrame (LTF) - Maroon, Green, Black/White (NQLH)This is a Longerer Time Frame Fib level indicator. It shows where the NQ market is looking to go and where it has been. When the market gets above one level ( white bar, for example) look for price action to continue to the next level. If it breaks below the white bar look for it to go the next level below for support. It is great for having targets. It helps in knowing why the market may continue in a direction. For example: When the price action has already moved up, why does it keep going up, because it hasn't reached targeted fib level yet. Same reason price action may move lower. It is looking for its fib level support. You can find them yourself by taking the red level fibs as plug numbers. This makes it fractal in nature. Find the fractal or/of inner fibs by plugging in two consecutive red level fib numbers as the plug numbers. With two plug number it will work for any instrument at any level. Use this indicator for a daily or weekly chart. The close on the day or the week would indicate where the next target level is at.

Daily Dual Pivots (Std + Fib) Extended by Jackel
簡介: 這個指標旨在為日內交易者提供最強大的支撐與阻力參考。它將市場上最常用的兩種 Pivot Points 計算方式——標準 (Standard) 與 斐波那契 (Fibonacci)——結合在同一個圖表中,讓你一眼就能看出關鍵的價格匯聚點 (Confluence Areas)。
主要特色:
雙重系統並存:
標準 Pivot (Standard):以 實線 (Solid Lines) 顯示。這是機構與大部分交易者使用的傳統支撐阻力位。
斐波那契 Pivot (Fibonacci):以 圓點/虛線 (Dotted Lines) 顯示。利用 Fib 黃金比例 (0.382, 0.618) 計算出的潛在反轉位。
清晰的視覺區分:標準版使用暖色系 (紅/綠/橙),Fib 版使用冷色系 (藍/紫),互不干擾,清晰易讀。
可選擴展關卡 (S4-S5 / R4-R5):預設顯示 P, R1-R3, S1-S3。如果市場波動劇烈,你可以在設定中開啟 "Show Extra Levels" 來顯示 R4/R5 及 S4/S5。
自動隱藏歷史:預設只顯示「當日」的線條,保持圖表整潔。如需回測,可開啟「顯示歷史數據」選項。
如何使用:
當 實線 (Standard) 與 虛線 (Fib) 重疊或非常接近時,該區域通常具有更強的支撐或阻力效力。
適用於 15分鐘、1小時或 4小時圖表操作日內交易。
Introduction: This indicator is designed for intraday traders who need precise Support & Resistance levels. It combines the two most popular Pivot Point calculation methods—Standard (Traditional) and Fibonacci—into a single chart, allowing you to easily identify key areas of confluence.
Key Features:
Dual System Strategy:
Standard Pivots: Displayed as Solid Lines. These represent the traditional structural levels used by most traders and institutions.
Fibonacci Pivots: Displayed as Dotted/Circle Lines. These use key Fibonacci ratios (0.382, 0.618) to identify potential reversal zones.
Visual Clarity: Different line styles and color groups allow you to distinguish between Standard and Fib levels instantly without chart clutter.
Extended Levels (Optional): By default, it shows P, R1-R3, and S1-S3. In highly volatile markets, you can enable "Show Extra Levels" in the settings to reveal S4/S5 and R4/R5.
Clean Chart: By default, it only shows levels for the current day. You can enable "Show History" in the settings if you need to backtest.
How to Use:
Look for Confluence: When a Solid Line (Standard) and a Dotted Line (Fib) overlap or are very close to each other, it indicates a very strong Support or Resistance zone.
Best used on 15m, 1H, or 4H charts for intraday analysis.

BHUVANA Fib 50–61.8 • Turn Alerts when FIB directions change
Detects step-up / step-down on both Fib 50 & 61.8 (your “stairs” logic).
Triggers BUY/SELL on that slope change (optionally also requires price to be above/below the line).Spot volatility compression around the 50%–61.8% Fibonacci mid-band of the current swing, then trade the first expansion with clean, rules-based entries and auto SL references.
Swing mapping: Finds the active high/low over a user-defined lookback and computes Fib 50% and Fib 61.8%.
Squeeze detection: Measures the distance between 50% and 61.8%. If the band width is ≤ (ATR × multiplier), the zone is flagged as a Squeeze.
Breakout entries (on close):
Long when price crosses up through 50% while squeezed.
Short when price crosses down through 61.8% while squeezed.
Risk framework: Auto-plots stop lines from the signal bar:
Long SL = swing low; Short SL = swing high.
Visuals: Fib lines (50/61.8) + optional yellow zone highlight during squeeze.
Signals evaluate on bar close (no forward-looking data).
Works well on XAUUSD / US30 intraday (5–15m) during London/NY sessions.
Add your own alertcondition() lines if you want push alerts on Long/Short entries.

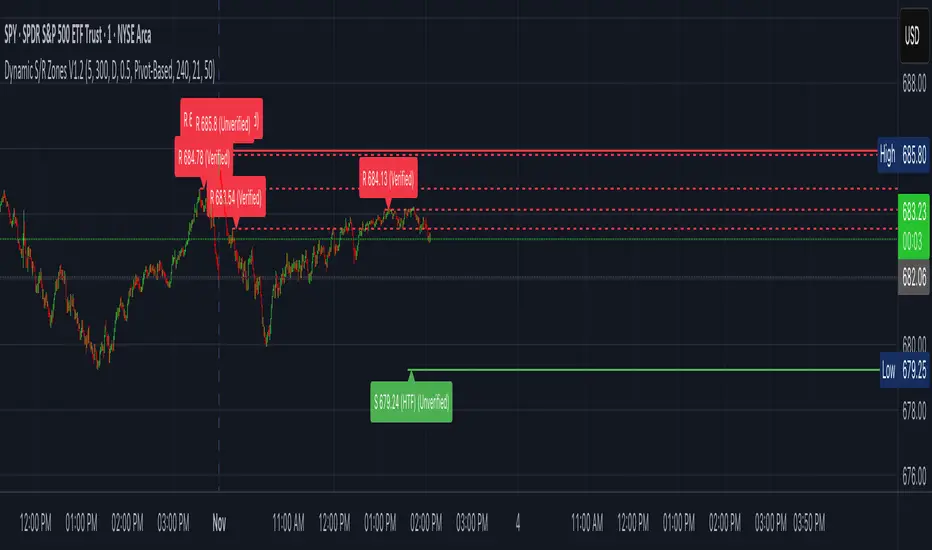
Dynamic S/R Zones (Verified Pivots)Dynamic S/R Zones V1.2
Overview
Dynamic S/R Zones V1.2 is a Pine v6 structure visualizer that highlights nearby Support/Resistance zones from confirmed swing pivots on the current chart and an optional higher timeframe (HTF). It can also plot simple Fibonacci guide levels (33% / 50% / 66%) between the most recent swing points. All HTF requests use lookahead_off to avoid forward-looking data, and S/R anchors are derived from verified pivots to minimize repainting. Optional “touch-verified” coloring flips a level’s display once price trades through it.
This tool is an illustrative S/R map for chart review and education.
How it works
Verified Pivots (Non-Repainting):
• Minor S/R uses ta.pivothigh/ta.pivotlow with a symmetric lookback (“Pivot Strength”).
• Lines anchor only on confirmed pivots, so once drawn they remain stable.
• A de-dup buffer filters out levels that are too close together.
HTF Major Zones:
• HTF OHLC is requested via request.security(..., lookahead=barmerge.lookahead_off).
• The same pivot logic runs on the HTF series; lines appear after the HTF bar closes.
• Major lines can be shown alongside (or instead of) minor lines.
Touch-Verified Coloring (optional):
• When a level is touched (high ≥ level ≥ low), it flips from neutral to a side color:
– Support (price above) ≈ green; Resistance (price below) ≈ red.
• The verification state is persistent for that line.
Fibonacci Guides (optional):
• Draws 33% / 50% / 66% between the last opposing swing high/low.
• Verification/coloring modes:
Pivot-Based: uses the most recent swing direction.
HTF Trend-Based: uses a fast/slow EMA comparison on a user-selected HTF.
Bounce/Reject Mode: color on touch regardless of trend interpretation.
• One arrow per bar (optional) indicates a newly verified fib touch.
What it displays
• Minor S/R lines from current-TF verified pivots (non-repainting anchors).
• Major S/R lines from HTF pivots (confirmed on HTF close).
• Optional labels that state level type, price, HTF tag, and Verified/Unverified status.
• Optional Fibonacci guide lines with labels, plus single-arrow confirmations.
• Coloring that reflects touch verification and current side (support/resistance).
Why it’s original
• Focuses on confirmed structure (minor + HTF) with de-duplication for clarity.
• Offers hybrid fib verification (pivot-based, HTF-trend-based, or bounce/reject) to let users study structure from multiple perspectives without asserting signals.
• Maintains persistent verification per level and avoids lookahead on HTF for stable, review-friendly visuals.
• Provides a compact workflow for scanning: minor structure, HTF context, then fib context.
Configuration & usage notes
• Pivot Strength: Higher values = stricter confirmation (fewer lines, more stable).
• Lookback Range: Prunes older lines; increase for broader context.
• HTF for Major S/R: Daily/4H/Weekly etc.; lines confirm on that timeframe’s close.
• Min Distance Between Levels: Helps reduce clutter from nearby duplicates.
• Touch-Verified Coloring: Enable for quick support/resistance side cues.
• Fibs: Choose coloring mode (Pivot-Based, HTF Trend-Based, or Bounce/Reject).
• HTF Trend TF / EMAs: Only affect coloring when using HTF trend mode for fibs.
• Performance: Labels and line counts can be tuned down on very long histories.
Limitations & assumptions
• Pivot detection depends on chart timeframe, liquidity, and chosen pivot length.
• HTF lines update after the HTF bar closes (by design, to avoid lookahead).
• Optional Realtime pivots for fibs (if enabled) are provisional and can shift until a swing verifies.
• Coloring and arrows are descriptive—they do not imply entries, exits, or probabilities.
Legal Disclaimer
These tools visualize calculations on historical data for charting and educational use only. They are not signals, recommendations, or promises of future results. Markets involve risk, and past results do not guarantee future outcomes. Provided “as is,” without warranties. Consider consulting a qualified professional before making decisions.
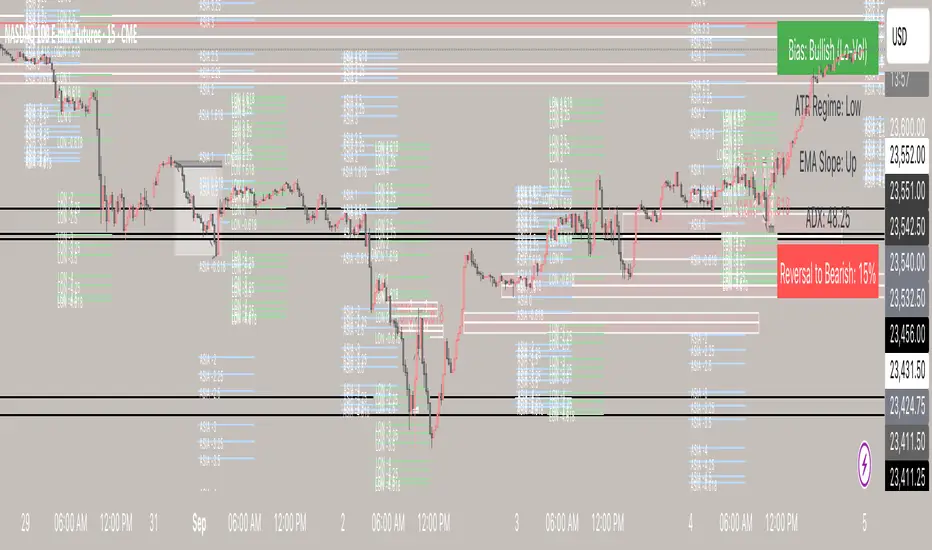
Possible Deviations | Session Fibs Session Fibs + Regime
A structured framework for intraday price action, designed to give traders both precision entry levels and a macro intraday bias filter in one indicator.
🔹 How It Works
1. Session Fibs
Automatically plots Fibonacci retracements and extensions from key session reference candles.
Levels expand across the chart, showing where liquidity often pools and where reversals or continuations have the highest probability.
Useful for identifying session-to-session ranges, breakout levels, and intraday inflection points.
2. Regime Analysis Table
Displays the current market environment in real time (e.g., trending, consolidating, or transitioning).
Derived from momentum, volatility, and directional bias — giving a clear snapshot of whether conditions favor continuation trades or mean-reversion setups.
Updates dynamically as price action evolves.
🔹 Why Use This Indicator?
Clarity at a glance – Instantly see the dominant regime without needing multiple extra tools.
Precision zones – Use Session Fibs to spot support/resistance clusters that align with institutional price behavior.
Contextual decision-making – Filter setups with the regime framework, reducing false signals and keeping you aligned with the market’s rhythm.
Intraday edge – Especially powerful on index futures, forex majors, and highly liquid equities where session structure matters.
🔹 Best Practices
Use on lower intraday timeframes (1m–15m) to track evolving structure.
Combine with higher timeframe bias (daily/weekly) for confluence.
Watch for fib level + regime alignment (e.g., a retracement to 61.8% inside a trending regime) as high-probability setups.
🔹 Who It’s For
This tool is designed for serious intraday traders who want:
More discipline and structure in their trading.
A way to avoid overtrading in choppy regimes.
Confidence in identifying where and when to engage the market.
⚡ Bottom line: The Session Fibs + Regime indicator doesn’t just give you levels — it gives you market context. It’s both a map of high-value price zones and a real-time bias filter that adapts as conditions change.
Auto Fib V2Auto Fib V2 — Advanced Fibonacci Mapping Tool
Introduction
Auto Fib V2 is an advanced Fibonacci retracement indicator that automatically adapts to recent market ranges. Rather than manually drawing Fibonacci lines, this script dynamically maps them based on the most recent highs and lows, allowing traders to see the chart as if it were a "navigation map." Its primary purpose is to help identify potential buy and sell zones with greater clarity.
Key Concept
The script is built on a simple but powerful interpretation of Fibonacci retracement:
When the price moves below the 0.236 level, it suggests an oversold zone, where buyers may step in and market reversal potential increases.
When the price rises above the 0.764 level, it highlights an overbought zone, where sellers may become more active and risk of reversal grows.
Between these extremes, the Golden Pocket (0.382–0.618 zone) is highlighted as the area where institutional traders and algorithms often react. Historically, this is one of the most respected Fibonacci areas in technical analysis.
Features & Customization
Automatic Range Detection: The indicator automatically finds the recent high/low (based on user-defined lookback bars) and applies Fibonacci levels.
Flexible Direction Setting: Traders can use Auto Mode to let the script decide direction from price movement, or manually choose upward/downward mapping.
Multiple Levels Display: Beyond the standard levels, extra fractional retracements (0.146, 0.309, 0.441, etc.) are included for more precise mapping.
Golden Pocket Highlighting: Visually emphasizes the 0.382–0.618 retracement zone for quick recognition.
Custom Styles: Switch between line-based and dot-based plotting, with adjustable colors and transparency for improved readability.
Practical Use
Auto Fib V2 is not intended as a direct buy/sell signal generator, but as a contextual guide. Traders can use it to:
Confirm whether the current price area is closer to an overbought or oversold condition.
Combine it with oscillators (RSI, MACD) or trend indicators (EMA, ADX) to strengthen trading decisions.
Identify confluence zones where Fibonacci levels overlap with key supports/resistances.
Quickly adapt to market shifts without the need to redraw Fibonacci retracement lines repeatedly.
Why Use Auto Fib V2?
Manual Fibonacci drawing can be subjective, often depending on the swing points a trader chooses. Auto Fib V2 reduces that subjectivity by using consistent logic, creating a more systematic approach. For intraday traders, it provides rapid context to assess whether the market is stretched or balanced. For swing traders, it offers a map of reaction zones across higher timeframes.

Opening Range Breakout (ORB) with Fib RetracementOverview
“ORB with Fib Retracement” is a Pine Script indicator that anchors a full Fibonacci framework to the first minutes of the trading day (the opening-range breakout, or ORB).
After the ORB window closes the script:
Locks-in that session’s high and low.
Calculates a complete ladder of Fibonacci retracement levels between them (0 → 100 %).
Projects symmetric extension levels above and below the range (±1.618, ±2.618, ±3.618, ±4.618 by default).
Sub-divides every extension slice with additional 23.6 %, 38.2 %, 50 %, 61.8 % and 78.6 % mid-lines so each “zone” has its own inner fib grid.
Plots the whole structure and—optionally—extends every line into the future for ongoing reference.
**Session time / timezone** – Defines the ORB window (defaults 09:30–09:45 EST).
**Show All Fib Levels** – Toggles every retracement and extension line on or off.
**Show Extended Lines** – Draws dotted, extend-right projections of every level.
**Color group** – Assigns colors to buy-side (green), sell-side (red), and internal fibs (gray).
**Extension value inputs** – Allows custom +/- 1.618 to 4.618 fib levels for personalized projection zones.
OrangeCandle 4EMA 55 + Fib Bands + SignalsThe script is a TradingView indicator that combines three popular technical analysis tools: Exponential Moving Averages (EMAs), Fibonacci bands, and buy/sell signals based on these indicators. Here’s a breakdown of its features:
1. EMA Settings and Calculation:
The script calculates and plots several Exponential Moving Averages (EMAs) on the chart with different lengths:
Short-term EMAs: EMA 9, EMA 13, EMA 21, and EMA 55 (used for tracking short-term price trends).
Long-term EMAs: EMA 100 and EMA 200 (used to analyze longer-term trends).
These EMAs are plotted with different colors to visually distinguish between the short-term and long-term trends.
2. Fibonacci Bands:
The script calculates Fibonacci Bands based on the Average True Range (ATR) and a Simple Moving Average (SMA).
Fibonacci factors (1.618, 2.618, 4.236, 6.854, and 11.090) are used to determine the upper and lower bounds of five Fibonacci bands.
Upper Fibonacci Bands (e.g., fib1u, fib2u) represent resistance levels.
Lower Fibonacci Bands (e.g., fib1l, fib2l) represent support levels.
These bands are plotted with different colors for each level, helping traders identify potential price reversal zones.
3. Buy and Sell Signals:
Long Condition: A buy signal occurs when the price crosses above the EMA 55 (long-term trend indicator) and is above the lower Fibonacci band (support zone).
Short Condition: A sell signal occurs when the price crosses below the EMA 55 and is below the upper Fibonacci band (resistance zone).
These conditions trigger visual signals on the chart (green arrow for long, red arrow for short).
4. Alerts:
The script includes alert conditions to notify the trader when a long or short signal is triggered based on the crossover of price and EMA 55 near the Fibonacci support or resistance levels.
Long Entry Alert: Triggers when the price crosses above the EMA 55 and is near a Fibonacci support level.
Short Entry Alert: Triggers when the price crosses below the EMA 55 and is near a Fibonacci resistance level.
5. Visualization:
EMAs are plotted with distinct colors:
EMA 9 is aqua,
EMA 13 is purple,
EMA 21 is orange,
EMA 55 is blue (with thicker line width for emphasis),
EMA 100 is gray,
EMA 200 is black.
Fibonacci bands are plotted with different colors for each level:
Fib Band 1 (upper and lower) in white,
Fib Band 2 in green (upper) and red (lower),
Fib Band 3 in green (upper) and red (lower),
Fib Band 4 in blue (upper) and orange (lower),
Fib Band 5 in purple (upper) and yellow (lower).
Summary:
This script provides a comprehensive strategy for analyzing the market with multiple EMAs for trend detection, Fibonacci bands for support/resistance, and signals based on price action in relation to these indicators. The combination of these tools can assist traders in making more informed decisions by providing potential entry and exit points on the chart.

CandelaCharts - Fib Retracement (OTE) 📝 Overview
The CandelaCharts Fib Retracement (OTE) indicator is a precision tool designed to help traders identify Optimal Trade Entry (OTE) levels based on Fibonacci retracement principles, as taught in ICT (Inner Circle Trader) methodology.
This indicator automatically plots Fibonacci retracement levels between a selected swing high and swing low, highlighting the key OTE zone between the 61.8% and 78.6% retracement levels—a prime area for potential reversals in trending markets.
📦 Features
Automatic & Custom lookback modes
Customizable fib levels
Dynamic coloring
Reverse & extend
⚙️ Settings
Lookback: Controls the number of bars to look back. You can choose between **Automatic** or **Custom** mode.
Line Style: Sets the line style for the Fibonacci levels.
Levels: 0, 0.236, 0.0.382, 0.500, 0.620, 0.705, 0.790, 0.886, 1.000. Allows you to toggle the visibility of Fibonacci levels.
Dynamic Coloring: Colors Fibonacci levels according to trend direction.
Show Labels: Shows the price value at each Fibonacci level.
Reverse: Flips the Fibonacci levels in the opposite direction.
Extend Left: Extends the Fibonacci levels to the left.
⚡️ Showcase
Dynamic Coloring
Manual Coloring
Fib Retracement
Extended
Custom Length
📒 Usage
Using the CandelaCharts Fib Retracement (OTE) is pretty straightforward—just follow these steps to spot high-probability trade setups and refine your entries.
Identify the Trend – Determine whether the market is in an uptrend or downtrend.
Select Swing Points – The indicator automatically plots from the most recent swing high to swing low (or vice versa).
Wait for Price to Enter OTE Zone – Look for price action confirmation within the optimal entry zone (61.8%-78.6%).
Enter the Trade – Consider longs in an uptrend at the OTE zone, and shorts in a downtrend.
Set Stop & Target – Place stops below/above the swing low/high and target extension levels (127.2%, 161.8%).
🎯 Key takeways
The CandelaCharts Fib Retracement (OTE) is a must-have tool for traders looking to refine their entries and maximize risk-reward potential with precision-based ICT trading strategies. 🚀
🚨 Alerts
The indicator does not provide any alerts!
⚠️ Disclaimer
Trading involves significant risk, and many participants may incur losses. The content on this site is not intended as financial advice and should not be interpreted as such. Decisions to buy, sell, hold, or trade securities, commodities, or other financial instruments carry inherent risks and are best made with guidance from qualified financial professionals. Past performance is not indicative of future results.

Auto Fib GOLDEN TARGET Golden Target Auto Fib Indicator
Unlock the power of automatic Fibonacci analysis with the Golden Target Auto Fib Indicator. Designed for traders who want to effortlessly incorporate Fibonacci retracement levels into their strategy, this indicator dynamically calculates and plots key Fibonacci levels based on recent price action.
Key Features:
Automatic Fibonacci Levels: Automatically determines the critical Fibonacci retracement levels using the most recent high and low over a user-defined period.
Customizable Length: Adjust the period over which the Fibonacci levels are calculated to match your trading style and market conditions.
Dynamic Plotting: Fibonacci levels are plotted in real-time, reflecting current market conditions and potential support and resistance areas.
Color-Coded Levels: Distinguishes between different Fibonacci levels with distinct colors, making it easy to identify significant price points at a glance.
Target Labels (Optional): Optionally display labels next to the Fibonacci levels to help identify potential target zones and better visualize the key levels.
How It Works:
The Golden Target Auto Fib Indicator calculates Fibonacci retracement levels based on the highest high and lowest low over a specified length. The levels plotted include key Fibonacci ratios: 23.6%, 38.2%, 61.8%, and the 100% extension, providing valuable insights into potential support and resistance areas as well as price targets.
Usage:
Adjust Settings: Set the Length parameter to define the period over which Fibonacci levels are calculated.
Analyze Levels: Observe the plotted Fibonacci levels and their color-coded lines to identify potential price retracement zones and target areas.
Incorporate Into Strategy: Use these levels in conjunction with your trading strategy to make more informed decisions on entry and exit points.
Whether you're a day trader or a swing trader, the Golden Target Auto Fib Indicator simplifies Fibonacci analysis and integrates seamlessly into your TradingView charts, helping you make more precise trading decisions.
Get started today and enhance your technical analysis with the Golden Target Auto Fib Indicator!
Feel free to adjust the description according to the specific features or customization options of your indicator.

Auto Fibo Multi Timeframe [Misu]█ This indicator shows a Multi Timeframe automatic Fibonacci retracement levels.
This indicator is built using pivots from a user-selected timeframe to draw and orient the Fibonacci retracement.
Fibonacci analysis uses a logical sequence of numbers to predict trends and price action.
█ Usages:
The Fibonacci retracement is used to identify hidden support and resistance levels that an investor can use for entry, exit, and stop placement.
Depending on your usage, you can track breakouts above and below retracement levels to provide early entry points for major breakouts and breakdowns.
Higher timeframe Fibs allow you to have more relevant and weighted signals.
█ Features:
Choose Timeframe
Choose Fib levels
Color Fib Levels Individually
Color Fib Levels all in one
█ Parameters:
Timeframe: The Timeframe chosen.
Left Bars: A parameter used to calculate pivots.
Right Bars: A parameter used to calculate pivots.
UI Settings: Select Fibs levels and colors.

Supertrend, MA 44|6, EMA FIBS 13|21|34I have this indicator based on my strategy. This indicator is based on existing functions available in the system. I haven't added anything new. This indicator uses Supertrend, MA44|6, EMA fibs 13|21|34 combining to find a profitable trade.
- Supertrend : Indicator uses supertrend strategy with default ATR period of 10 and Factor value 3. These values can be customized based on your preferences. Uptrend is denoted by green color and downtrend by red color. You can change the colors based on your preferences.
- MA 44|6: Indicator plots moving averages of 44 and 6. These values can be customized based on your preferences. Although it is highly recommended to keep 44 as is. Value 6 can be adjusted based on your preference. Default color for uptrend is green and for downtrend is red. You can change the colors based on your preferences.
- FIBS EMA 13|21|34: Indicator plots EMA of fibbonacci numbers 13, 21,34 to identify consolidation and breakout. The periods can be adjusted but it is highly recommended not to do so. Default colors for 13,21 and 34 is Aqua, Blue and Navy respectively. You can change the colors based on your preferences.
When to take trade?
To take a trade all conditions needs to be fulfilled.
Supertrend : Always take a trade in the direction of Supertrend. It is always advisable to take trade if the trend is changing or price is taking support of resistance.
MA 44|6: Moving average 44 indicates average price of 44 last candles and 6 for last 6 candles. Price crossing MA 44 indicates change in trend. It is advisable to take trade at crossing the line above or below. If many candles closing near MA 44 then it indicates consolidation. The more far the candle closes from MA44 the better. MA 6 is used to identify when to enter or exit the trade. If candle closes away from MA 6 then you can wait for candle to start near the MA 6 line. If candle closes above/below MA 6 you can exit your trade.
Fibonacci 13|21|34: When all lines are closed it indicates consolidation. When price breakouts to either direction you can take a trade in that direction with following conditions.
Bullish Trade:
When to enter?
If candle closed above MA 44, Supertrend is uptrend and EMA Fibs are moving away and are above MA 44. The price is near to MA 6 line then you can enter into bullish trade. If price is away from MA 6 then you should wait until the price/line comes near to avoid loss.
When to exit?
Price moving in opposite direction:
You should set a stop loss when you enter the trade. The stop loss can be set below the low of the previous candle or any other strategy you have. But it is really important to set the stop loss. If price moves in opposite direction then your stop loss will hit and you will be out of the trade.
Price moving in same direction:
Once you enter the trade you can exit based on two conditions whichever suits you.
1. Exit the trade if candle closes below MA6. The drawback is you may exit too early. You can also adjust the period based on your preferences.
2. Exit the trade if candle closed below low of previous candle. The drawback is you may book less profit but you can capture the movement very well.
Bearish Trade:
When to enter?
If candle closed below MA 44, Supertrend is downtrend and EMA Fibs are moving away and are below MA 44. The price is near to MA 6 line then you can enter into bearish trade. If price is away from MA 6 then you should wait until the price/line comes near to avoid loss.
When to exit?
Price moving in opposite direction:
You should set a stop loss when you enter the trade. The stop loss can be set below the low of the previous candle or any other strategy you have. But it is really important to set the stop loss. If price moves in opposite direction then your stop loss will hit and you will be out of the trade.
Price moving in same direction:
Once you enter the trade you can exit based on two conditions whichever suits you.
1. Exit the trade if candle closes below MA6. The drawback is you may exit too early. You can also adjust the period based on your preferences.
2. Exit the trade if candle closed below low of previous candle. The drawback is you may book less profit but you can capture the movement very well.
When not to take trade?
1. If MA 44 is completely horizontal and EMA Fibs are very close to each other. This indicates that the market is consolidated and if you enter the trade you may hit stop loss very often.
Note: Please note that I am not expert and I don't take any responsibility of your profits or losses. I have created this indicator based on my knowledge and it is for study purpose. Use of this indicator is totally your responsibility. Use all your knowledge and expertise and don't totally depend on the indicator. Don't forget to use stop loss and do money management.
Happy Trading!

Auto Fibonacci [Misu]█ This indicator shows an automatic Fibonacci retracement levels.
This indicator is designed based on highs, lows, and trend interpretation to orientate the fibonacci retracement in the good direction.
Fibonacci analysis uses a logical sequence of numbers to predict trends and price action.
█ Usages:
The Fibonacci retracement is used to identify hidden support and resistance levels that an investor can use for entry, exit, and stop placement.
Depending on your usage, you can track breakouts above and below retracement levels to provide early entry points for major breakouts and breakdowns.
█ Features:
> Choose Fib levels
> Color Fib Levels all in one
> Color Fib Levels Individually
█ Parameters:
Deviation: A parameter used to calculate pivots.
Depth: A parameter used to calculate pivots.
UI Settings: Select Fibs levels and colors.
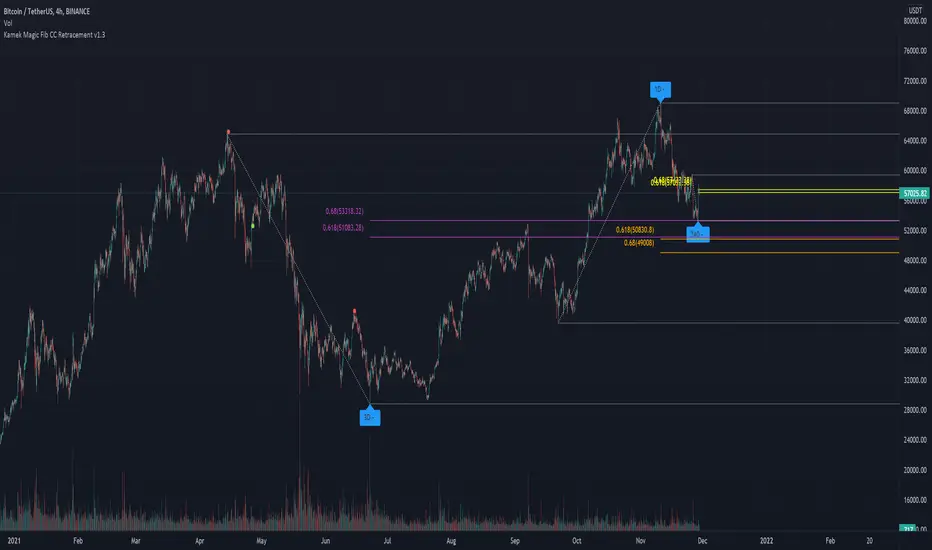
Kamek CC Magic v1.2This indicator has been created to automatically find the sweet spot for two fib levels. 0.618 & 0.66
- Using 3 Time Frame pivot points for fibs
- Each Time Frame pivot has fib retracement levels with customizable levels
- dynamic pivot left and right lookback period to adjust the lag in the higher highs and lower lows
Note: You need to have the chart time frame on the lowest fib time frame.
Recommended to use for scalping
0.618 & 0.66 for each Time frame.
1hr, 4hr, 1day
Recommended to use for Swing
0.618 & 0.68 for each Time frame.
4hr, 1day, 3day
but you can still use your own strategy using 4 fib levels.
The idea is based on the course material from Chart Champions
Its recommended using S&R levels or session volume to confirm entry or exit