Fibonacci Drapes (Dynamic Fib Tool)Automatic Fibs with main levels outlined and ranges shown in background colors. You can change the lengths and the color/look of all parts of this indicator. Have fun!
Cari dalam skrip untuk "fib"


linear and Bollingers Bands and Fibonacci ratios This model give us the following
1 .linear regression channel
2.dynamic upper and lower fibs
3. upper and lower bollinger bands
each specific to the time frame that you use
So by using all 3 in one indicator it easy to see ressistance and support level

Pickledeggtradermans Moving Averages + FibHey i've posted a script that allows upto 5 sma's, 2 ema's and also live fib levels. Let me know what you think. Enjoy


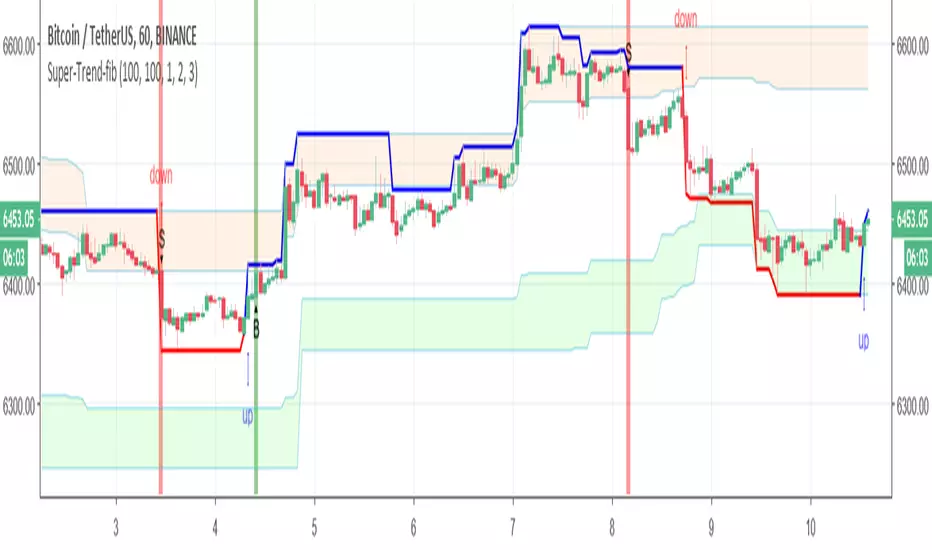
Super-Trend-fibIn this model we have fib Donchian channel with super trend alerts (B=buy) S =sell
and trailing volume system up trend alert and down trend alert
so have fun
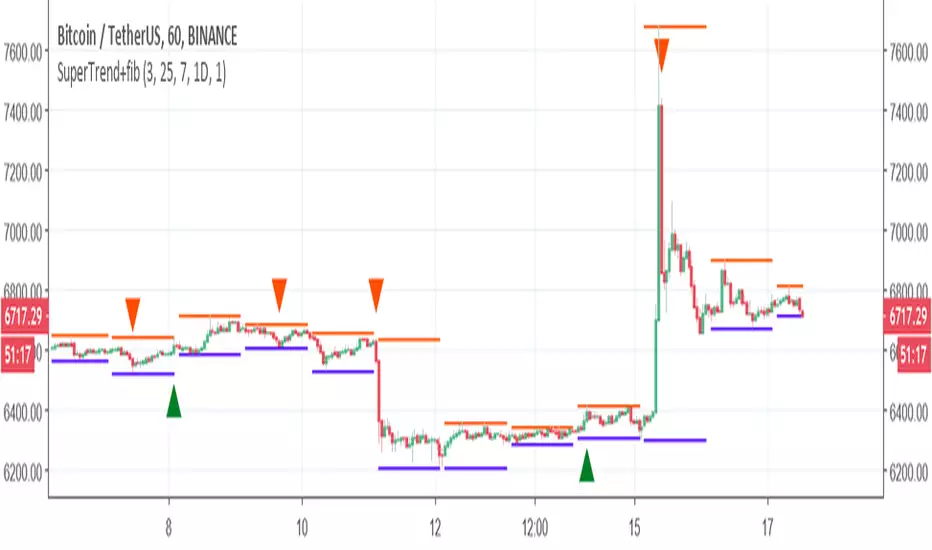
SuperTrend+fibI took the script from here so credit to the author
made some slight modification and add fib to make the buy point more stable
have fun
p.s
it can be improve further with addition of some extra, I did not check if it repaint as it not my code
Auto Fib - @marginiscallingVery simple script that automatically draws fibonacci levels for you and allows you to adjust the length of look-back period. You can also easily adjust the script to include additional fib levels.

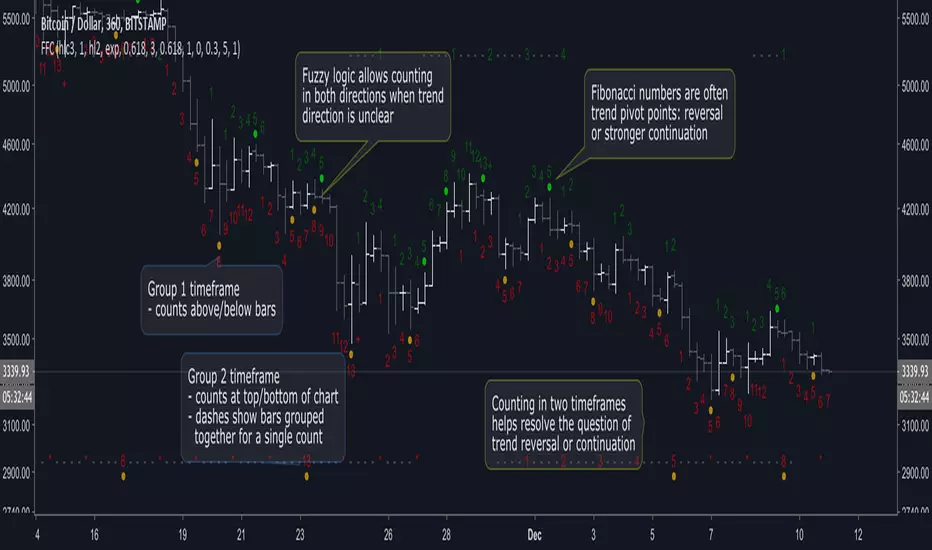
Fuzzy Fib CountsA new approach to trend/time analysis. This indicator counts up/down price moves using fuzzy logic in two time frames. Counts reaching Fibonacci numbers are often significant to trend momentum: either reversal or stronger continuation. See the script’s beginning comments for details.
I’m amazed with DeMark and all his indicators. But after coding a TD_Sequential script, I began to wonder if there wasn’t an easier way to identify high probability entry/exit points without all the intricate logic. It took awhile, but a different paradigm eventually came into focus: Fuzzy Fib Counts (FFC).
FFC is like “analog” compared to TD_Sequential’s “digital” approach. And FFC is much simpler: no buy/sell/perfected/deferred signals, just up/down counts. It’s uncanny how often a trend is refocused at Fibonacci numbers, but like TD_Sequential… it’s not perfect! As with all indicators, consult your intuition, before pulling the trigger.
The default values have been effective for me in Bitcoin (and I’m surprised how well it works in smaller time frames). However, for less volatile markets, you may need to reduce the fuzz level and/or adjust the filter (averaging) parameters.
FFC has been helpful to me. Hope it helps you too! If so, donations appreciated… Thanks!
BTC: 36FdUcETrwmGxt5qazq7Bo7kad9kuNawMF
LTC: MJYHzwJYjsnB35dzb5L9hCpqZf8RyqViEm
ETH: 0x3db7557bea61ca4c096c6ed7bdb2a0d69e455fe1
Looking for trailblazers to help explore new possibilities… Add constructive comments below!
Auto DayWeekMonth Fib Levels R2 by JustUncleLThis indicator automatically draws up to Three Sets of Fibonacci Pivot levels based on the previous Candle period's Range (High-Low). The HLC3 is used as the default Pivotal level. Only the most Recent period Candle Levels are displayed. The longer Weekly and Monthly sets are particularly useful in finding long term Supply and Demand levels.
The three sets of selectable periods are spit into the following sets:
Daily Set (1,2,3,4,5,7,10 or 14 Days)
Weekly Set (1,2,3,4,5,10, or 13 Weeks)
Monthly Set (1,2,3,4,5,6,9 or 12 months)
Each set has the option to display Extension levels.
The Pivotal Level HLC3 and Range = (High - Low), are extracted from previous Period Candle.
FIB LEVELS Colours (same in each period set):
Yellow = Pivot and Pivot Zone (HLC3 by default)
Fuchsia = R1,S1 Levels 0.368 * Range
Lime = R2,S2 Levels 0.618 * Range
Red = R3,S3 Levels 0.786 * Range
Aqua = R4,S4 Levels 1.000 * Range
Green = R5,S5 Levels 1.236 * Range
Orange = R6,S6 Levels 1.382 * Range
Black = R7,S7 Levels 1.618 * Range
Maroon = R8,S8 Levels 2.000 * Range

hi/low levels and fibsSlight development on previous range hi/low script. Plots highest lowest price over x periods, and the mid-point. Added to this are 2 sets of fib lines. That's it! :)


[RS]Fib Lines ChannelUpdated version of murrays lines with fib levels that respond to trend shifting

Fib+BOS/CHOCH+OB# ⭐ 1) **What This Indicator Does**
The indicator combines 4 major concepts:
### **1️⃣ Market Structure (Swing High/Low)**
* Detects major swing highs and lows using pivot logic
* Determines whether the market is **Bullish** or **Bearish**
### **2️⃣ BOS / CHOCH (Break of Structure / Change of Character)**
* **BOS:** continuation of trend
* **CHOCH:** early signal of trend reversal
* Only the **last 5** levels are displayed → keeps chart clean
### **3️⃣ Order Blocks (OB)**
* Detects last opposite candle before BOS/CHOCH
* Displays only **the latest 3 OB zones**
* Ideal for identifying high-probability pullbacks

Fib and Slope Trend Detector [EWT] + MTF Dashboard🚀 Overview
The Momentum Structure Trend Detector is a sophisticated trend-following tool that combines Price Velocity (Slope) with Market Structure (Fibonacci) to identify high-probability trend reversals and continuations.
Unlike traditional indicators that rely heavily on lagging moving averages, this script analyzes the speed of price action in real-time. It operates on the core principle of market structure: Impulse moves are fast and steep, while corrections are slow and shallow.
🧠 The Logic: Physics Meets Market Structure
This indicator determines the trend direction by calculating the Slope (Velocity) of price swings.
ZigZag Calculation: It first identifies market swings (Highs and Lows) using a standard pivot detection algorithm.
Slope Calculation: It calculates the velocity of every completed leg using the formula: $Slope = \frac{|Price Change|}{|Time Duration|}$.
Trend Definition:
Uptrend : If the previous Up-move was fast (Impulse) and the subsequent Down-move is slower (Correction), the market is primed for an uptrend.
Downtrend : If the previous Down-move was fast (Impulse) and the subsequent Up-move is slower (Correction), the market is primed for a downtrend.
🔥 Key Features
1. Aggressive Real-Time Detection (No Lag)
Most structure indicators wait for a "Higher High" to confirm a trend, which often leads to late entries. This script uses an Aggressive Live Slope calculation:
It compares the current developing slope of the live price action against the slope of the previous completed leg.
Result: As soon as the current move becomes "steeper" (faster) than the previous correction, the trend flips immediately. This allows you to catch the "meat" of the move before a new pivot is even confirmed.
2. Fibonacci Validity Filter
Momentum alone isn't enough; we need structural integrity.
The script calculates the 78.6% Retracement level of the impulse leg.
If a correction moves deeper than this Fibonacci limit (on a closing basis), the trend structure is considered "broken" or "invalid," and the indicator switches to a Neutral state. This filters out choppy/ranging markets.
3. Multi-Timeframe (MTF) Dashboard
A customizable dashboard on the chart allows for fractal analysis. You can view the trend state (UP/DOWN/NEUTRAL) across 9 different timeframes (1m to 1M) simultaneously.
Green Row : Uptrend
Red Row : Downtrend
Gray : Neutral/Indeterminate
4. Smart Visuals
Background Colo r: Changes dynamically (Teal for Bullish, Red for Bearish, Gray for Neutral) to give you an instant read of the market state.
Slope Labels : Displays the calculated numeric slope on the chart, helping you visualize the momentum difference between impulse and corrective waves.
Invalidation Levels : Automatically plots the invalidation line (Stop Loss level) based on the market structure.
🛠️ Settings & Inputs
Strategy Settings
Pivot Deviation Length : Sensitivity of the ZigZag calculation (Default: 5). Lower numbers = more sensitive to small swings.
Max Retracement % : The Fibonacci limit for a valid correction (Default: 78.6%).
Min Bars for Live Calc : To prevent noise, the script waits for this many bars after a pivot before calculating the "Live Slope" (Default: 3).
Dashboard Settings
Show Dashboard : Toggle the table on/off.
Timeframe Toggles : Enable/Disable specific timeframes (1m, 5m, 15m, 30m, 1H, 4H, 1D, 1W, 1M) to suit your trading style.
🎯 How to Use
Wait for Background Change : When the background turns Teal, it indicates that a corrective pullback has ended and a new impulse with high velocity has begun.
Check Invalidation : Look at the plotted Stop Loss Level. If price closes below this line, the trade idea is invalid.
Confirm with Dashboard : Use the table to ensure the higher timeframes (e.g., 1H, 4H) align with your current chart's direction for higher probability setups.
Disclaimer : This tool is designed for trend analysis and educational purposes. Past performance (momentum) is not indicative of future results. Always manage your risk.

Fib BB on VWMA*ATRThis TradingView Pine Script is designed to plot Fibonacci Bollinger Bands on a Volume Weighted Moving Average (VWMA) using the Average True Range (ATR). The script takes a higher timeframe (HTF) approach, allowing traders to analyze price action and volatility from a broader market perspective.
🔹 How It Works
Higher Timeframe Data Integration
Users can select a specific timeframe to calculate the VWMA and ATR.
This allows for a more macro perspective, avoiding the noise of lower timeframes.
Volume Weighted Moving Average (VWMA)
Unlike the Simple Moving Average (SMA), VWMA gives higher weight to price movements with larger volume.
Calculation Formula:
𝑉𝑊𝑀𝐴=∑(𝐶𝑙𝑜𝑠𝑒×𝑉𝑜𝑙𝑢𝑚𝑒) / ∑𝑉𝑜𝑙𝑢𝑚𝑒
Since VWMA accounts for volume, it is more reactive to price zones with high buying or selling activity, making it useful for identifying liquidity zones.
ATR-Based Fibonacci Bollinger Bands
The Average True Range (ATR) is used to measure market volatility.
Instead of standard deviation-based Bollinger Bands, Fibonacci multipliers (2.618, 3.0, 3.414) are applied to ATR.
These bands adjust dynamically with market volatility.
🔹 Key Findings from Exploration
Through testing and analysis, this indicator seems to effectively detect supply and demand zones, particularly at the Fibonacci levels of 2.618 to 3.414.
Price frequently reacts at these bands, indicating that they capture key liquidity zones.
Potential Order Block Detection:
The ends of the Fibonacci Bollinger Bands (especially at 2.618, 3.0, and 3.414) tend to align with order blocks—areas where institutional traders previously accumulated or distributed positions.
This is particularly useful for order flow traders who focus on unfilled institutional orders.
🔹 How to Use This Indicator?
Identifying Order Blocks
When price reaches the upper or lower bands, check if there was a strong reaction (rejection or consolidation).
If price rapidly moves away from a band, that level might be an order block.
Spotting Liquidity Pools
VWMA’s nature enhances liquidity detection since it emphasizes high-volume price action.
If a price level repeatedly touches the band without breaking through, it suggests institutional orders may be absorbing liquidity there.
Trend Confirmation
If VWMA is trending upwards and price keeps rejecting the lower bands, it confirms a strong bullish trend.
Conversely, constant rejection from the upper bands suggests a bearish market.
This script is designed for open-source publication and offers traders a refined approach to detecting order blocks and liquidity zones using Fibonacci-based volatility bands.
📌 한글 설명 (상세 설명)
이 트레이딩뷰 파인스크립트는 거래량 가중 이동평균(VWMA)과 평균 실제 범위(ATR)를 활용하여 피보나치 볼린저 밴드를 표시하는 지표입니다.
또한, 고차 타임프레임(HTF) 데이터를 활용하여 시장의 큰 흐름을 분석할 수 있도록 설계되었습니다.
🔹 지표 작동 방식
고차 타임프레임(HTF) 데이터 적용
사용자가 원하는 타임프레임을 선택하여 VWMA와 ATR을 계산할 수 있습니다.
이를 통해 더 큰 시장 흐름을 분석할 수 있으며, 저타임프레임의 노이즈를 줄일 수 있습니다.
거래량 가중 이동평균(VWMA) 적용
VWMA는 단순 이동평균(SMA)보다 거래량이 많은 가격 움직임에 더 큰 가중치를 부여합니다.
계산 공식:
𝑉𝑊𝑀𝐴=∑(𝐶𝑙𝑜𝑠𝑒×𝑉𝑜𝑙𝑢𝑚𝑒) / ∑𝑉𝑜𝑙𝑢𝑚𝑒
거래량이 많이 발생한 가격 구간을 강조하는 특성이 있어, 시장의 유동성 구간을 더 정확히 포착할 수 있습니다.
ATR 기반 피보나치 볼린저 밴드 생성
ATR(Average True Range)를 활용하여 변동성을 측정합니다.
기존의 표준편차 기반 볼린저 밴드 대신, 피보나치 계수(2.618, 3.0, 3.414)를 ATR에 곱하여 밴드를 생성합니다.
이 밴드는 시장 변동성에 따라 유동적으로 조정됩니다.
🔹 탐구 결과: 매물대 및 오더블록 감지
테스트를 통해 Fibonacci 2.618 ~ 3.414 구간에서 매물대 및 오더블록을 포착하는 경향이 있음을 확인했습니다.
가격이 피보나치 밴드(특히 2.618, 3.0, 3.414)에 닿을 때 반응하는 경우가 많음
VWMA의 특성을 통해 오더블록을 감지할 가능성이 높음
🔹 오더블록(Order Block) 감지 원리
Fibonacci 밴드 끄트머리(2.618 ~ 3.414)에서 가격이 강하게 반응
이 영역에서 가격이 강하게 튀어 오르거나(매수 압력) 급락하는(매도 압력) 경우,
→ 기관들이 포지션을 청산하거나 추가 매집하는 구간일 가능성이 큼.
과거에 대량 주문이 체결된 가격 구간(= 오더블록)일 수 있음.
VWMA를 통한 유동성 감지
VWMA는 거래량이 집중된 가격을 기준으로 이동하기 때문에, 기관 주문이 많이 들어온 가격대를 강조하는 특징이 있음.
따라서 VWMA와 피보나치 밴드가 만나는 지점은 유동성이 높은 핵심 구간이 될 가능성이 큼.
매물대 및 청산 구간 분석
가격이 밴드에 도달했을 때 강한 반등이 나오는지를 확인 → 오더블록 가능성
가격이 밴드를 여러 번 테스트하면서 돌파하지 못한다면, 해당 지점은 강한 매물대일 가능성
🔹 활용 방법
✅ 오더블록 감지:
가격이 밴드(2.618~3.414)에 닿고 강하게 튕긴다면, 오더블록 가능성
해당 지점에서 거래량 증가 및 강한 반등 발생 시 매수 고려
✅ 유동성 풀 확인:
VWMA와 피보나치 밴드가 만나는 구간에서 반복적으로 거래량이 터진다면, 해당 지점은 기관 유동성 구간일 가능성
✅ 추세 확인:
VWMA가 상승하고 가격이 밴드 하단(지지선)에서 튕긴다면 강한 상승 추세
VWMA가 하락하고 가격이 밴드 상단(저항선)에서 거부당하면 하락 추세 지속

Fib Pivot Points HLThis TradingView indicator allows users to select a specific timeframe (TF) and then analyzes the high, low, and closing prices from the past period within that TF to calculate a central pivot point. The pivot point is determined using the formula (High + Close + Low) / 3, providing a key level around which the market is expected to pivot or change direction.
In addition to the central pivot point, the indicator enhances its utility by incorporating Fibonacci levels. These levels are calculated based on the range from the low to the high of the selected timeframe. For instance, a Fibonacci level like R0.38 would be calculated by adding 38% of the high-low range to the pivot point, giving traders potential resistance levels above the pivot.
Key features of this indicator include:
Timeframe Selection: Users can choose their desired timeframe, such as weekly, daily, etc., for analysis.
Pivot Point Calculation: The indicator calculates the pivot point based on the previous period's high, low, and closing prices within the selected timeframe.
Fibonacci Levels: Adds Fibonacci retracement levels to the pivot point, offering traders additional layers of potential support and resistance based on the natural Fibonacci sequence.
This indicator is particularly useful for traders looking to identify potential turning points in the market and key levels of support and resistance based on historical price action and the Fibonacci sequence, which is widely regarded for its ability to predict market movements.
Example:
Suppose you're analyzing the EUR/USD currency pair using this indicator with a weekly timeframe setting. The previous week's price action showed a high of 1.2100, a low of 1.1900, and the week closed at 1.2000.
Using the formula ( High + Close + Low ) / 3 (High+Close+Low)/3, the pivot point would be calculated as ( 1.2100 + 1.2000 + 1.1900 ) / 3 = 1.2000. Thus, the central pivot point for the current week is at 1.2000.
The range from the low to the high is 1.2100 − 1.1900 = 0.0200 1.2100−1.1900=0.0200.
To calculate a specific Fibonacci level, such as R0.38, you would add 38% of the high-low range to the pivot point: 1.2000 + ( 0.0200 ∗ 0.38 ) = 1.2076 1.2000+(0.0200∗0.38)=1.2076. Thus, the R0.38 Fibonacci resistance level is at 1.2076.
Similarly, you can calculate other Fibonacci levels such as S0.38 (Support level at 38% retracement) by subtracting 38% of the high-low range from the pivot point.
Traders can use the pivot point as a reference for the market's directional bias: prices above the pivot point suggest bullish sentiment, while prices below indicate bearish sentiment. The Fibonacci levels act as potential stepping stones for price movements, offering strategic points for entry, exit, or placing stop-loss orders.

Fib Percentage Previous Day CloseIntraday regulated markets move within their circuit range above or below which the market activity is halted.
These levels are protected by the MM to accumulate or distribute. These levels are mostly same for all markets i.e. 2%, 4% , 5%, 10% and 20% of previous day close, crossing which the market activity halts.
So, from here the expectation of turning or breaking increases.
This indicator automatically plots the levels and helps understanding the price behavior at these points. This in turn helps taking better RR trades.

Fib High Low PointsThis is a simple indicator which plot high and lows based on Fibonacci sequence.
Best part of this indicator is it don't rewrite itself once it got plotted on the chart, which make it unique from other High low indicators.

FIBS S/R IndicatorHello,
I've decided to publish a new script. The previous version of this script was removed by admins for breaking community rules.
So I present to you the Fibonacci Support / Resistance.
1. How does it work
Ratio plots
I first take the input of pivot look back and search for pivots high and low.
And then it takes a second look back to search highest high and lowest low to establish the top bottom range.
Then using the top and bottom I plot ratios provided as input. Defaults to most relevant 5 ratios I've found (Fibonacci):
Ratio 0 = 0 - can't be changed
Ratio 1 = 0.5
Ratio 2 = 0.618
Ratio 3 = 1
Ratio 4 = 1.618
Ratio 5 = 2.618
Any changes done to these ratios should be in order, otherwise conditions could get messed up. So R1 needs to the lowest and R5 the highest.
Also the same ratios are used in reverse as negative ratios.
There is a option to plot all ratios but gets really confusing for me but maybe for you it works. By default there are certain conditions set so that as we go up new resistance ratio get displayed and as we go down we see new resistance plots.
Trendlines
I've also added some automatic trendline plots with breakout warning labels based on the pivots high and low. Start and end for trendlines can be changed via inputs.
Labels can be deactivated via input. On a older version the trendlines and labels where not removed from the chart but I felt like there was to much information.
Overcooked/Undercooked
I've also added some fills and background colors that indicate if the price action is over R5 or under Negative R5 ratios. This usually indicates some "overcooking" or "undecooking".
I've notices that after "crossunder"/"crossover" top bottom ratios it goes in consolidation or it dumps. So then I plot a bgcolor to signal that.
2. How to use it
Using plot lines we can determine where we have support and resistance. I found that the best way to use the default ratios values is on the 1H chart. Very good for trading on crypto because of current situation in the market where there is a lot of new people entering the space and volatility and sentiment make swings respect the Fibonacci ratios.
3. Examples
For instance lets look at BINANCE:BTCUSDT .
On the left we see that the price action between 20 and 21 February was "overcooked". So after we got the signal that we "crossunder" the R5 the signal was triggered and we got a small red candle followed by a small dip and after that we got a small bounce and a dump.
If we also look at MF-RSI we can also see we got multiple bear divs.
Lets entertain the idea that we went short at ~57.1k as soon as we get signaled and it starts dumping.
Where does it stop ?
We can see it went all the way down to Negative R5 ratio. Normally that should signal "undercooking" but this was not triggered as it did not close under it (signaled in green).
We can also see that previous support now becomes resistance (signaled in red).
If we take a look at BINANCE:ETHUSDT , we do see that the "undercooking" was triggered here.
I will be publishing a more detailed Idea with examples of using this on the BINANCE:BTCUSDT chart in combination with Volume and other technical analysis.
Use with caution, this is not 100% signal indicator as the markets do what they want. But by using this in combination with other indicators like MF-RSI, EMAs and regular patterns we can get some targets for Support/Resistance.
I'm trying to create a strategy based on this indicator but I'm not getting very good results. Best results were on the 15 min chart with gross profits around ~50%.
Please try to play around with the inputs and let me know if you find something interesting, maybe I can incorporate new features in the indicator.
You can find the MF-RSI indicator here

