Smart Directional Fib Zone (Selectable Session)🎯 Overview
This indicator plots a dynamic Fibonacci zone between the 0.5 and 0.618 levels , calculated from the previous day’s price action , and is designed specifically for intraday traders.
It visually highlights key retracement or reaction areas where the market often pauses or reverses.
🔍 How it works
At the start of each day, the script automatically captures:
the previous day’s open (pdo),
high (pdh),
low (pdl),
and close (pdc).
It then determines if the previous day was bullish (Close > Open) or bearish (Close < Open).
Based on that:
If the previous day was bullish, it projects the Fibonacci levels down from the high (typical for expecting retracements).
If bearish, it projects them up from the low.
The two key levels are:
0.5 (50%) retracement / projection
0.618 (61.8%) retracement / projection
A colored zone is plotted between these levels to act as a leading guide for intraday setups.
⏰ Time filtering & session customization
A unique feature is the dynamic session filtering:
By default, the zone is only plotted during active market hours, keeping your chart clean outside trading hours.
The script provides a dropdown selector so you can quickly switch between:
India session (9:15 to 15:30)
Europe session (9:00 to 17:30)
US session (9:30 to 16:00)
Or even define your own custom session times.
This makes it ideal for intraday traders in any region.
🎨 Visual features
The fill zone changes color based on the previous day’s sentiment:
Green zone if the previous day was bullish
Red zone if the previous day was bearish
🚨 Alerts
The script includes an alert condition, so you can easily set up TradingView alerts to notify you when:
Price enters the Fibonacci zone.
This is extremely helpful for catching retracements or reversals without staring at the screen all day.
⚙️ How to use
✅ Works on any intraday timeframe (1 min, 5 min, 15 min, etc.).
✅ Simply add it to your chart, pick your session in the dropdown, and watch the Fibonacci zone automatically adjust to your selected market hours.
Use it as a confluence tool alongside other indicators like VWAP, EMAs, Bollinger Bands, or price action patterns to time entries and exits.
💪 Why this is powerful
This is more than a simple Fib retracement tool:
It dynamically adapts to the previous day’s sentiment, helping you trade in alignment with recent market psychology.
The session filtering ensures your charts are focused only on the periods
Cari dalam skrip untuk "fib"

Peters Fibs IndicatorPeters Fibs Indicator helps you find great spots to enter trades, set stop-losses, and take profits using Fibonacci levels. It spots important price swings (highs and lows) and draws key levels on your chart to guide your trading decisions. Here's how it works in simple terms:
1-Finds Swings: It looks at recent price action to spot major highs ("H") and lows ("L") on your chart.
2-Draws Fibonacci Levels: Uses these swings to mark three key levels:
Entry (default at 61.8%): Where you might jump into a trade.
Stop-Loss (default at 79%): Where to cut losses if the trade goes wrong.
Take-Profit (default at 14.6% and -0.236) : Where to lock in profits.
3-Shows Trade Signals: Alerts you when the price hits the entry level, so you know it's time to act.
How to Tweak It for Different Timeframes
You can adjust the indicator to work for fast-paced or slower trading styles by changing a few settings:
*Fast Charts (e.g., 5-minute or 15-minute):
Swing Length: Set to 5-10 to catch quick price swings.
Minimum Bars Between Swings: Use 5-10 to allow swings close together.
*Slower Charts (e.g., 1-hour or 4-hour):
Swing Length: Bump up to 20-50 to focus on bigger, more important swings.
Minimum Bars Between Swings: Set to 15-30 to space out swings for clearer signals.
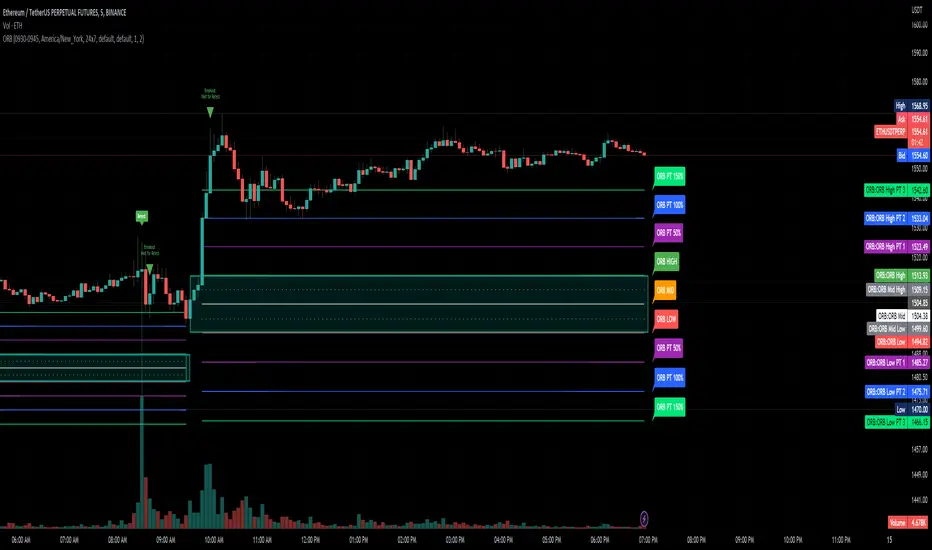
ORB Advanced Cloud Indicator & FIB's by TenAMTraderSummary: ORB Advanced Cloud Indicator with Alerts and Fibonacci Retracement Targets by TenAMTrader
This TradingView script is an advanced version of the Opening Range Breakout (ORB) indicator, enhanced with visual clouds and Fibonacci retracement/extension levels. It is designed to help traders identify key price levels and track price movements relative to those levels throughout the trading day. The script includes alert functionalities to notify traders when price crosses key levels and when Fibonacci levels are reached, which can serve as potential entry and exit targets.
Key Features:
Primary and Secondary Range Calculation:
The indicator calculates the primary range (defined by a start and end time) and optionally, a secondary range.
The primary range includes the highest and lowest prices during the designated time period, as well as the midpoint of this range.
The secondary range (if enabled) tracks another price range during a second time period, with its own high, low, and midpoint.
Visual Clouds:
The script draws colored clouds between the high, midpoint, and low of the opening range.
The upper cloud spans between the Opening High and Midpoint, while the lower cloud spans between the Midpoint and Opening Low.
Similarly, a second set of clouds can be drawn for the secondary range (if enabled).
Fibonacci Levels:
The script calculates Fibonacci retracement and extension levels based on the primary range (the difference between the Opening High and Opening Low).
Fibonacci levels can be used as entry and exit targets in a trading strategy, as these levels often act as potential support/resistance zones.
Fibonacci levels include standard values like -0.236, -0.382, -0.618, and positive extensions like 1.236, 1.618, etc.
Customizable Alerts:
Alerts can be set to trigger when:
The price crosses above the Opening High.
The price crosses below the Opening Low.
The price crosses the Opening Midpoint.
These alerts can help traders act quickly on important price movements relative to the opening range.
Customization Options:
The indicator allows users to adjust the time settings for both the primary and secondary ranges.
Custom colors can be set for the lines, clouds, and Fibonacci levels.
The visibility of each line and cloud can be toggled on or off, giving users flexibility in how the chart is displayed.
Fibonacci Levels Overview:
The script includes several Fibonacci retracement and extension levels:
Negative Retracements (e.g., -0.236, -0.382, -0.50, -0.618, etc.) are plotted below the Opening Low, and can act as potential support levels in a downtrend.
Positive Extensions (e.g., 1.236, 1.382, 1.618, 2.0, etc.) are plotted above the Opening High, and can act as potential resistance levels in an uptrend.
Fib levels can be used as entry and exit targets to capitalize on price reversals or breakouts.
Safety Warning:
This script is for educational and informational purposes only and is not intended as financial advice. While it provides valuable technical information about price ranges and Fibonacci levels, trading always involves risk. Users are encouraged to:
Paper trade or use a demo account before applying this indicator with real capital.
Use proper risk management strategies, including stop-loss orders, to protect against unexpected market movements.
Understand that no trading strategy, indicator, or tool can guarantee profits, and losses can occur.
Important: The creator, TenAMTrader, and TradingView are not responsible for any financial losses resulting from the use of this script. Always trade responsibly, and ensure you fully understand the risks involved in any trading strategy.

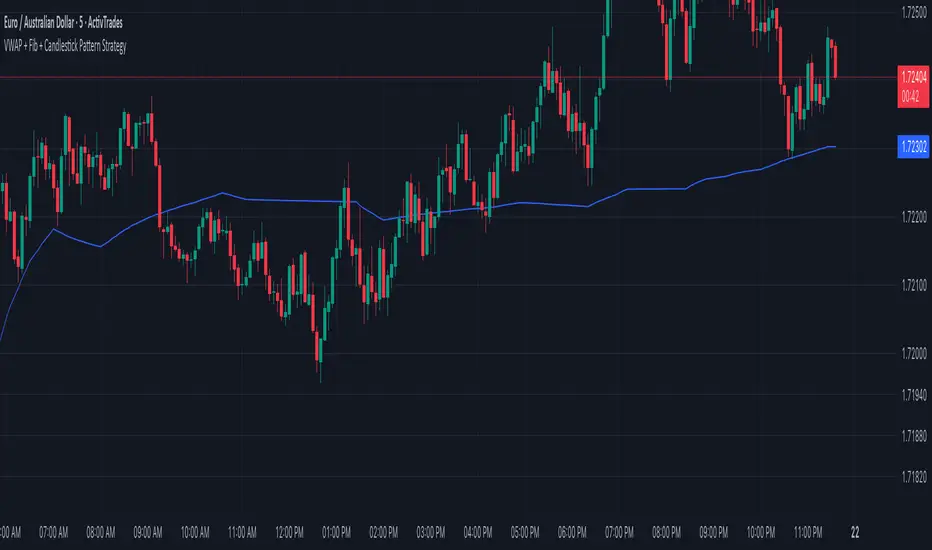
VWAP + Fib + Candlestick Pattern Strategy### **VWAP + Fibonacci + Candlestick Pattern Strategy (v6)**
This indicator is designed to identify high-quality trading setups using a combination of **Anchored VWAP, Fibonacci Retracement Levels, and Candlestick Patterns**. It helps traders find optimal entry points where multiple confluences align, enhancing trade accuracy.
### **Key Features:**
✅ **Anchored VWAP** – Starts from the last pivot low (bullish) or pivot high (bearish) to determine trend strength.
✅ **Fibonacci Levels** – Uses key retracement levels (0.382, 0.5, 0.618, 0.786) for added confluence.
✅ **Candlestick Patterns** – Detects Pin Bars, Engulfing Candles, and Hammer Candles for potential reversals.
✅ **High-Quality Setups** – Highlights strong signals where price aligns with VWAP & Fib zones.
✅ **Alerts** – Get notified when a bullish or bearish setup is detected.
✅ **Risk Management** – Includes Take Profit (TP1, TP2, Final TP) & Stop Loss based on ATR.
✅ **Position Sizing** – Calculates position size based on a fixed dollar risk per trade.
### **How to Use:**
1. Apply the indicator to your chart.
2. Look for signals near Fibonacci retracement levels and VWAP.
3. Use alerts for real-time trade notifications.
4. Manage risk with built-in TP/SL and position sizing.
Perfect for traders who use **Price Action & Smart Money Concepts** to refine their entries! 🚀
Auto Fib Retracement [victhoreb]Auto Fib Retracement is an automated Fibonacci retracement tool for TradingView that dynamically identifies key swing points and plots Fibonacci levels to help traders visualize potential support and resistance areas. Using a Zigzag algorithm, the indicator detects recent pivot highs and lows and calculates retracement levels based on these significant price swings. Key features include:
- Dynamic Pivot Detection: Automatically identifies recent swing highs and lows using configurable lookback periods, ensuring the Fibonacci levels adjust as the market evolves.
- Customizable Fibonacci Levels: Users can tailor the Fibonacci retracement levels (0, 0.214, 0.382, 0.5, 0.618, 0.786,) along with individual colors, offering flexibility to match various trading strategies.
- Zigzag Visualization: Optionally displays a Zigzag line that connects the detected pivot points, providing a clear visual representation of the price swing dynamics.
- Adjustable Line Extension: Retracement lines can be extended for a specified number of bars.
- Repainting Option: Includes an option to repaint the Zigzag, ensuring that the most current price action is reflected in the indicator’s output.
- The Auto Fibonacci Retracement itself DOES NOT REPAINT : )
This indicator streamlines the analysis process by automatically drawing Fibonacci retracement levels, allowing traders to quickly identify potential reversal areas and make more informed trading decisions.

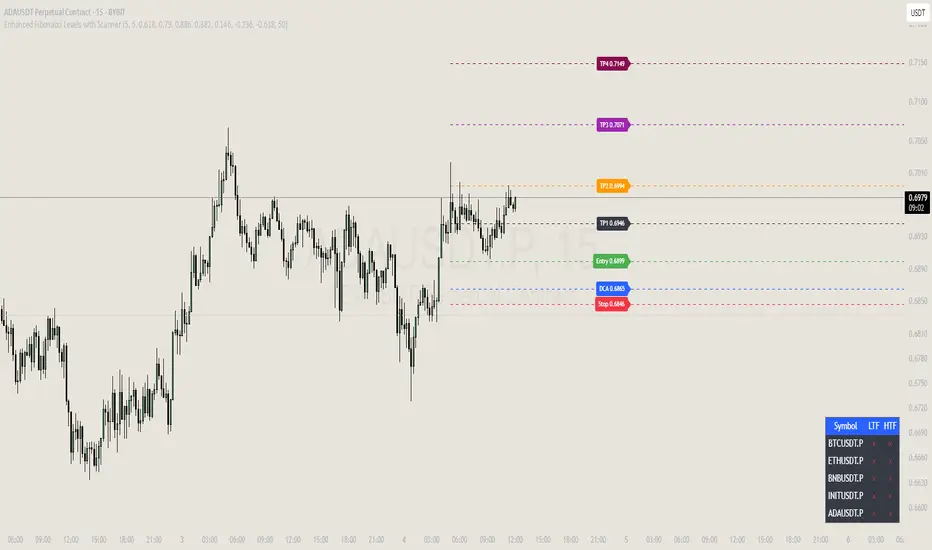
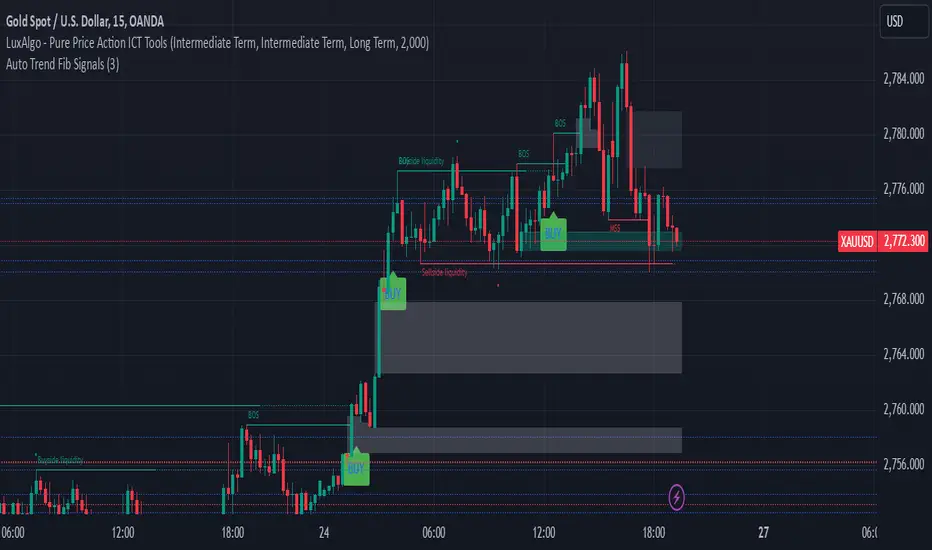
Auto Trend Fib Signals BY studio DivinKey Features
Dynamic SL using ATR volatility measure
Two-Tier Profit Taking for partial/full exits
Automatic Level Calculation based on Fibonacci extensions
Clear Visual Labels with exact price levels
Consistent Risk Management (1.5-2% per trade)
Optimization Table
Parameter Scalping Day Trading Swing Trading
ATR Multiplier 1.0 1.5 2.0
TP1 (1.272) 70% Position 50% Position 30% Position
TP2 (1.618) 30% Position 50% Position 70% Position
Time Frame 15-min 1-hour 4-hour
Pro Tips
Confirm with Volume: Increase volume at Fib levels improves signal reliability
Adjust in Ranging Markets: Use tighter SL (1.0x ATR) during consolidation
Trailing Stop: Move SL to breakeven at TP1 hit
Session Timing: Trade during London/NY overlap for best volatility
gann fib levelsDescription of gann fib Levels
Input Value Level:
Purpose: This level is the starting point for calculating support and resistance. Users can input a specific high or low price value that serves as the foundation for subsequent calculations.
Visual Representation: A bold blue line indicates this level prominently on the chart, making it easy to identify. Additionally, a horizontal magenta line provides a reference to this initial price level.
Support Levels:
Definition: Support levels are price points where a downtrend can be expected to pause due to buying interest. They act as a floor that prevents the price from falling further.
Calculation: Support levels are derived by calculating the square root of the input value, adjusting it downward by a defined step (0.25), and squaring the result to find potential support points.
Visual Representation: Each support level is plotted with a red line when the current price is below the support level and changes to green when the price is above it. Every fourth support level is depicted with a bolder line for emphasis.
Resistance Levels:
Definition: Resistance levels are price points where an uptrend can be expected to pause due to selling interest. They serve as a ceiling that prevents the price from rising further.
Calculation: Resistance levels are calculated similarly to support levels, using the square root of the input value but adjusting it upward by the defined step (0.25) before squaring the result.
Visual Representation: Each resistance level is plotted with a green line when the current price is below the resistance level and turns red when the price is above it. Like support levels, every fourth resistance line is bolded for easier identification.
Dynamic Behavior:
Crossing Logic: When the current market price crosses above a resistance level, that level transforms into a support level, effectively changing its role. Conversely, if the price crosses below a support level, it transforms into a resistance level. This dynamic behavior reflects real-time market sentiment and helps traders identify potential reversal points.
Summary
This Pine Script provides a visual representation of dynamic support and resistance levels based on a user-defined input price. With distinct color coding and bold lines for significant levels, traders can quickly assess market conditions, identify potential buy or sell signals, and make informed trading decisions. The system's adaptability allows it to reflect the latest market movements, enhancing its utility as a trading tool.

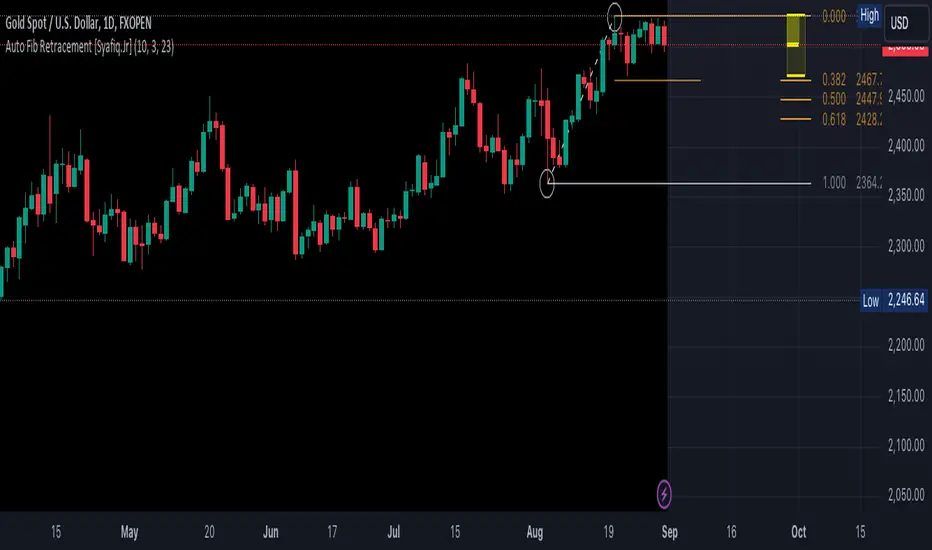
Auto Fib Retracement [Syafiq.Jr]This TradingView script is an advanced indicator titled "Auto Fib Retracement Neo ." It's designed to automatically plot Fibonacci retracement levels on a price chart, aiding in technical analysis for traders. Here's a breakdown of its functionality:
Core Functionality :
The script identifies pivot points (highs and lows) on a chart and draws Fibonacci retracement lines based on these points. The lines are dynamic, updating in real-time as the market progresses.
Customizable Inputs :
Depth: Determines the minimum number of bars considered in the pivot point calculation.
Deviation: Adjusts the sensitivity of the script in identifying new pivots.
Fibonacci Levels: Allows users to select which retracement levels (236, 382, 500, 618, 786, 886) are displayed on the chart.
Visual Settings: Customization options include the colors and styles of pivot points, trend lines, and the retracement meter.
Pivot and Line Calculation:
The script calculates the deviation between the current price and the last pivot point. If the deviation exceeds a certain threshold, it identifies a new pivot and draws a trend line between the previous pivot and the current one.
Visual Aids :
The indicator provides extensive visual aids, including pivot points marked with circles, dashed trend lines connecting pivots, and labels displaying additional information like price and delta rate.
Performance :
Optimized to handle large datasets, the script is configured to process up to 4000 bars and can manage numerous lines and labels efficiently.
Background and Appearance :
The script allows for customization of the chart background color, enhancing visibility based on user preferences.
In essence, this script is a powerful tool for traders who rely on Fibonacci retracement levels to identify potential support and resistance areas, allowing for a more automated and visually guided approach to market analysis.
Linear and Logarithmic Fibonacci Levels and FansIntroduction
The Fibonacci Retracement tool is a go-to for traders looking to spot potential support and resistance levels. By measuring the distance between swing highs and lows, you can apply Fibonacci ratios like 0.236, 0.382, and 0.618 to predict key market levels.
Traditionally, these levels are set by dividing this distance into equal parts—known as Linear Levels. A more refined approach, Logarithmic Levels, divides the distance into proportionally equal segments. Plus, this indicator now includes Fibonacci fans, adding another layer of analysis by projecting potential price levels using trendlines based on Fibonacci ratios.
This tool makes it easier to identify both Linear and Logarithmic levels while also leveraging Fibonacci fans for a more complete market view.
Applications
Logarithmic Levels and Fibonacci fans are ideal for volatile markets. In crypto, they’re especially effective for BTCUSDT (check out the wick from January 23, 2024). They also help spot accumulation and distribution patterns in high-volume altcoins like FETUSDT . In traditional markets, they’re useful for tracking stocks like TSLA and NVDA with extreme price swings, as well as indices in inflation-affected markets like XU100 , or recession-hit currency pairs like JPYUSD .
How to Use
This indicator is intuitive and similar to TradingView’s Fibonacci Tool. Select your reference levels (Level 1 and Level 0), then tweak the settings to customize your analysis, including adding Fibonacci fans for extra insights.
Why It’s Different
Unlike TradingView’s tool, which forces you to switch to a logarithmic scale (messing with other indicators and trend lines), this indicator lets you view both Linear and Logarithmic levels—and Fibonacci fans—without changing your chart’s scale. The original Fibonacci Code was derived from zekicanozkanli, modified and upgraded to plot fib fans as well.

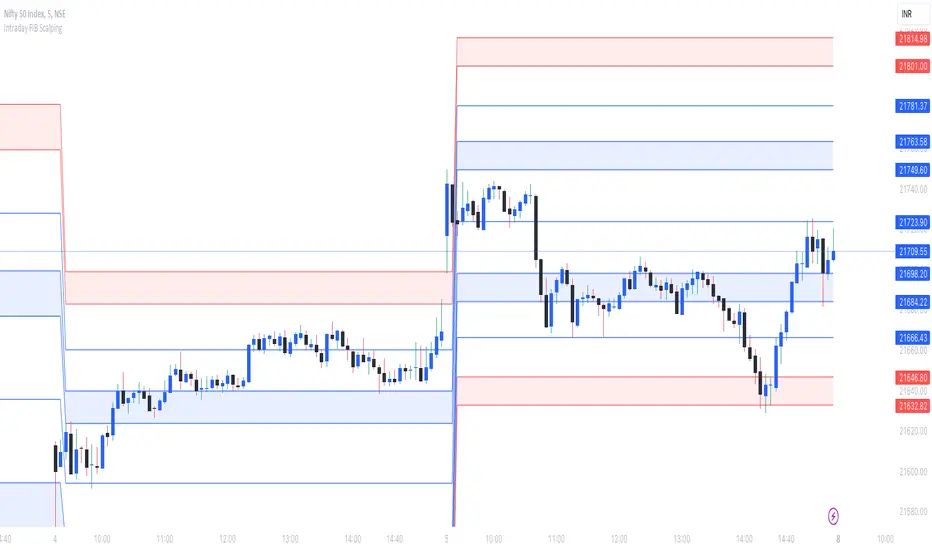
Intraday FIB ScalpingThe Intraday Fibonacci Levels Indicator is a powerful tool designed to enhance trading decisions in intraday markets. Leveraging the dynamic nature of Fibonacci retracement levels, this indicator utilizes the high and low prices observed within the first 15 minutes of the trading session to plot key levels and establish potential entry and exit zones.
Key Features:
Automatic Calculation: The indicator swiftly calculates Fibonacci retracement levels based on the highest high and lowest low recorded during the initial 15 minutes of the trading day. This ensures a quick and accurate representation of potential support and resistance levels.
Zone Marking for Precision: The indicator marks specific zones on the chart, providing traders with clear visual cues for potential entry and exit points. These zones are strategically aligned with Fibonacci levels, offering a systematic approach to decision-making.
User-Friendly Interface: With a user-friendly interface, the Intraday Fibonacci Levels Indicator is suitable for both novice and experienced traders. The intuitive design allows for easy interpretation of signals and levels.
By harnessing the power of Fibonacci retracement levels and incorporating them into an intraday context, this indicator empowers traders with a systematic and data-driven approach to decision-making. Whether identifying entry points, setting stop losses, or planning exit strategies, the Intraday Fibonacci Levels Indicator serves as a valuable ally in navigating the complexities of intraday trading.
How to Trade using these Levels?
With this indicator, you can see all the levels between whole number and its corresponding 0.272 were highlighted. That is where we need to look for intraday trade entry. If any of the level broken on either side and the bar closes below ore above the highlighted area, we should enter the trade in that direction with immediate next FIB level as TP1 and subsequent level as TP2. And, an opposite directional close above or below the highlighted level will be considered as stop loss exit.
We prefer to trade in 3 minutes or 5 minutes timeframe for intraday trading.
How we plot the levels?
We are incorporating ORB into Fibonacci to plot intraday trading levels. We use high and low of first 15 minutes candle of each new trading session to arrive the levels for that session.
When market is trading above or below initially plotted levels, user can extend the levels by enabling extentions provided in user settings
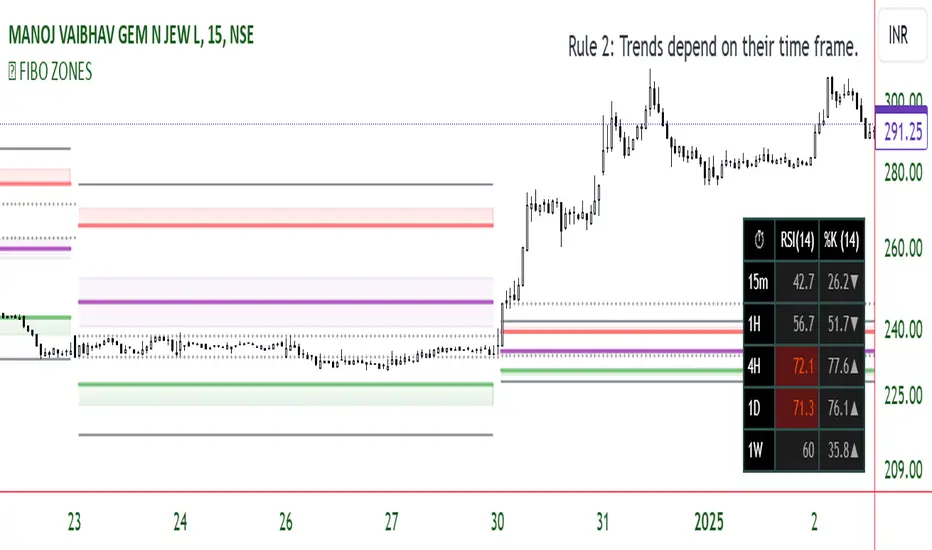
FIBO ZONESThe "Fibonacci ZONES" indicator combines Fibonacci ratio-derived zones(channels), together with a Fibonacci pattern of the Previous period high/low.
Auto Fibonacci tools are powerful ways designed to simplify your technical analysis by automatically drawing Fibonacci retracement and extension levels on your chart. This indicator is built to enhance your trading experience with clearer market moves and informative insights.
You can easily spot your waves and patterns when the percentages are moving with you.
Key Features:
Automated Fibonacci Levels: Plots Fibonacci retracement and extension levels based on recent price movements.
Multi-Timeframe Support: This indicator is your versatile companion, offering multi-timeframe functionality. You can seamlessly track Fibonacci levels across different resolutions, providing a comprehensive view of the market.
Two Types of Fibs: Retracement and Timeframe extension Fibonacci levels. Use retracements to identify potential reversal points and extensions to anticipate price targets, giving you a well-rounded perspective on market movements.
Benefits:
Save Time: No more manual Fibonacci drawing; It does this for you in real-time.
Enhanced Analysis: Gain a deeper understanding of potential support, resistance, and price targets.
User-Friendly: Suitable for traders of all levels, this indicator simplifies complex technical analysis.
Breakouts from a Fibonacci Channel are also indicated by labels, indicating a potential reversal.
Each range extremity/area can also be used as support/resistance.
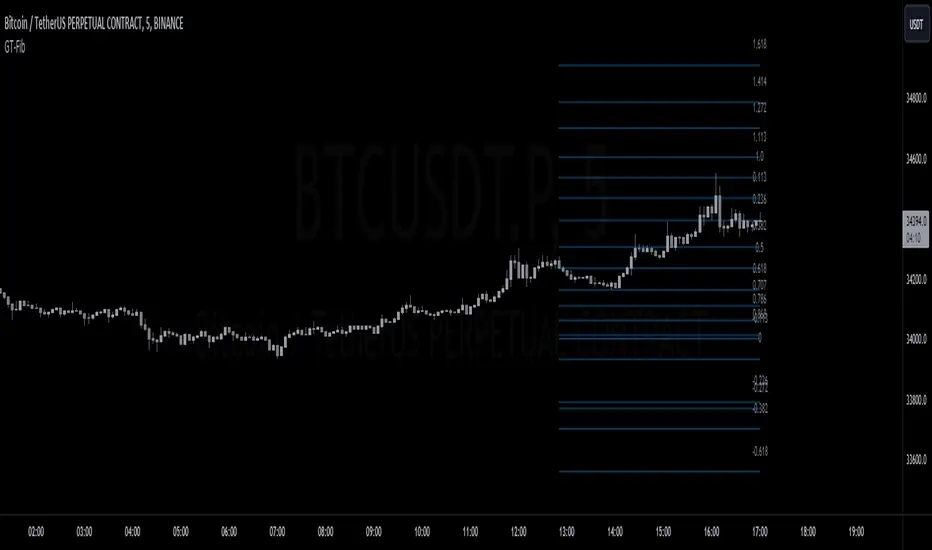
GT-FibThis code is declaring the script as an indicator named "GT-Fib" to be plotted on the main chart. The maximum number of lines it can create is limited to 500.
The indicator calculates Fibo using trend breaks. If the trend is not broken and the old trend continues, Fibo continues. However, sometimes you will witness that it does not draw Fibo. Indicates that there is no trend break yet. If current Fibo levels are behind us, it may be wise to wait for a trend change. For trend breaks, I partially benefited from the Lux team's trend lines with break indicator. For your information...
Settings:
A set of user inputs is defined to allow customization. These include lookback period, coefficient, calculation method, and an option to enable/disable backpainting. These inputs help the trader to adapt the script to different market conditions or trading strategies.
Style:
Colors and visual styles for the indicator are defined here, such as the colors for uptrends and downtrends.
Variables Initialization:
Various variables are initialized here. This section prepares the script for further calculations. Key concepts include the initialization of upper and lower boundaries, pivot highs (ph), pivot lows (pl), and a few other variables to track peaks and troughs for trendlines.
Trendline Peaks and Troughs:
The script identifies pivot highs and lows. Whenever a pivot high/low is found, it updates the trendline_top and trendline_bottom respectively.
Calculation Method:
Based on the user's choice, the script calculates a "cycle" value using one of three methods: ATR, Stdev, or Linreg.
Extended Lines:
These are dashed lines that get drawn when a pivot high or pivot low is identified. These lines can be used to visualize potential support or resistance areas.
plotFibRetracement Function:
This function is designed to draw Fibonacci retracement levels between the identified trendline top and bottom. The Fibonacci levels provide potential support and resistance levels that traders often use to make trading decisions.
Plotting Fibonacci using Trendline Peaks and Troughs:
If both trendline_top and trendline_bottom are not 'na' (not available), the script will draw the Fibonacci retracement using the defined function.
How to Use:
The script identifies and displays potential support and resistance zones using Fibonacci retracement levels based on the trendline peaks and troughs. Here's a suggested way to use it:
Adjust Settings: Depending on the instrument you're trading and the timeframe, you might want to adjust the lookback period, coefficient, and calculation method to fine-tune the script to your needs.
Identify Trends: Observe where the pivot highs and lows are formed. The presence of consecutive pivot highs or pivot lows can indicate a prevailing trend.
Use Fibonacci Levels: The Fibonacci retracement levels can act as potential support and resistance. For instance:
During an uptrend, if prices retract and approach a Fibonacci level, it might act as a support level where price could bounce back.
During a downtrend, Fibonacci levels might act as resistance where price could reverse downwards.
Combine with Other Indicators: For a more comprehensive analysis and to increase the reliability of trading signals, you can use this script in conjunction with other technical indicators.
Remember, like all trading tools and techniques, this script should be used in conjunction with proper risk management. It's also a good idea to test any strategy or tool in a demo environment before applying it to a live account.
Custom Fib by Dr. MauryaThis indicator is based on purely Fibonacci levels.
How it works:
Let's first understand the Fibonacci levels.
The main Fibonacci numbers are 0, 0.236, 0.392, 0.5, 0.618, 0.764, 1 whereas 0 equal to low and 1 equal to high.
As the market is moving in any direction, new lows or new highs are developing and hence Fibonacci levels are also changing throughout the time.
Sometime market retraces from various levels like 0.5, 0.618/0.382(mirror value), 0.762/0.236 (mirror value).
Retracement : The three mid-level 0.382, 0.5 and 0.618 are act as a retracement or like pivot levels for market. These levels are filled with green and red colors to attention the buyers and sellers to take a trade either side if any candlestick pattern are observed at these levels.
one direction trend takes support of 0.236/0.786(mirror value) (blue line in chart)
Sometime buy/sell on dip levels are happen at 0.762/0.392 (mirror value).
Targets: Target could be Fibonacci extension level lowest targets (1, 1.18, 1.23,), medium targets (1.39, 1.5, 1.61) and large target (2.0, 2.5.2.61, 3.0) as depended on your study volume levels and trend strength.
Stoploss: You can choose any preceding lines for stoploss: e.g. if you enter long on 0.618 or 0.5 levels you can set SL on 0.762
Previous day three mid-point 0.382, 0.5, 0.618 (filled with red and green color) as well as high and low could also act as resistance or support levels for current day market.
Lets understand the Input section of indicator
The first input section allowed to choose where you want to start developing Fibonacci : select session for intraday then weekly, monthly and yearly options are available.
Now you can set any Fibonacci levels (as you wish) you can set upto 20 levels.
By default, total 7 Fibonacci levels are plotted (0, 0.236, 0.392, 0.618, 0.762 and 1.
Further you can set Fibonacci extension level for long side (1.18, 1.23, 1.39, 1.5, 1.61, 2 etc).
You must be careful when you enter Fibonacci extension level lower side (short side). You need to enter value -0.5 (equal to 1.5 for long). -0.618 (equal to 1.618 for long), -1(equal to 2.0 for long).
You can fill color between any two adjacent lines from style sections.
You can also select labels from input tab if you want to see Fibonacci numbers on chart as labels.
You can also shift the labels from current bar to desired offset bar by changing the value in input section.
Conclusion
This indicator is highly customisable developing Fibonacci levels because everyone and different scripts works on different fib levels.
This indicator keeps the Fibonacci levels at a particular time and it plots only new lines when new low or high established without affecting the previous Fibonacci levels. Overall, as the market moves, you will find the trending plot goes which side.

[JL] Supertrend Zone Pivot Point with zigzag fibThis is an open-source Pine script that generates a Supertrend Zone Pivot Point with Zigzag Fib indicator for TradingView. The indicator displays the Supertrend Zone, pivot points, and Fibonacci levels on the chart.
One of the unique features of this indicator is that it uses a Zigzag that does not repaint, ensuring accurate high and low points for the pivot points.
Another feature is that when the Supertrend is in an uptrend, only the highest points are taken as pivot points, and when it's in a downtrend, only the lowest points are taken as pivot points.
The Fibonacci levels are calculated based on the previous high and low pivot points, with labels displaying the corresponding levels on the chart.
The indicator also includes options to show/hide the Zigzag and Fibonacci levels.
Overall, this indicator is useful for identifying key pivot points and Fibonacci levels in the Supertrend Zone, providing valuable information for traders to make informed decisions.

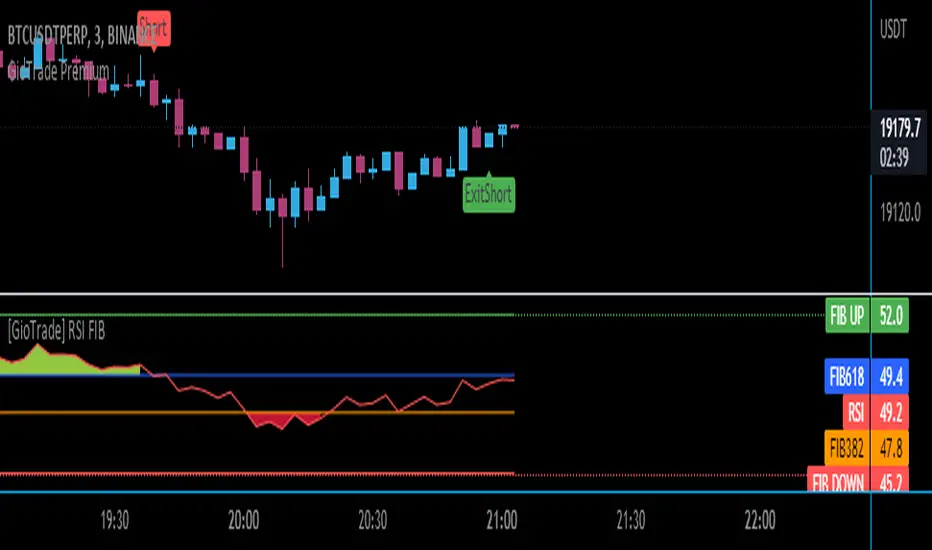
RSI FIB [G I O]BINANCE:BTCUSDT
A free indicator where you can see the fibonacci levels of the RSI.
Giotrade is aware of the importance of the RSI in trading and offers a new indicator that can guide you to conduct free market analysis.
The red and green zones warn of overbought and oversold, allowing you to predict the direction of price volatility.
Opening Range Breakout with Price TargetsJust publishing a version of the script amitgandhinz already created, which is amazing.
Added fib levels that amitgandhinz already started but commented out
Added mid point that is often found effective as a starting point, SL, etc
.srb suiteThe essential suite Indicator.
that are well integrated to ensure visibility of essential items for trading.
it is very cumbersome to put symbol in the Tradingview chart and combine essential individual indicators one by one.
Moreover even with such a combination, the chart is messy and visibility is not good.
This is because each indicator is not designed with the others in mind.
This suite was developed as a composite-solution to that situation, and will make you happy.
designed to work in the same pane with open-source indicator by default.
Recommended visual order ; Back = .srb suite, Front = .srb suite vol & info
individually turn on/off only what you need on the screen.
BTC-agg. Volume
4 BTC-spot & 4 BTC-PERP volume aggregated.
It might helps you don't miss out on important volume flows.
Weighted to spot trading volume when using PERP+spot volume .
If enabled, BTC-agg.Vol automatically applied when selecting BTC-pair.
--> This is used in calculations involving volumes, such as VWAP.
Moving Average
1 x JMA trend ribbon ; Accurately follow short-term trend changes.
3 x EMA ribbon ; zone , not the line.
MA extension line ; It provide high visibility to recognize the direction of the MA.
SPECIAL TOOLS
VWAP with Standard Deviation Bands
VWAP ruler
BB regular (Dev. 2.0, 2.5)
BB Extented (Dev. 2.5, 3.0, 3.5)
Fixed Range Volume Profile ; steamlined one, performace tuned & update.
SPECIAL TOOLS - Auto Fibonacci Retracement - New GUI
'built-in auto FBR ' has been re-born
It shows - retracement Max top/ min bottom ; for higher visibility
It shows - current retracement position ; for higher visibility
The display of the Fib position that exceeds the regular range is auto-determined according to the price.
tradingview | chart setting > Appearance > Top margin 0%, Bottom margin 0% for optimized screen usage
tradingview | chart setting > Appearance > Right margin 57
.srb suite vol & info --> Visual Order > Bring to Front
.srb suite vol & info --> Pin to scale > No scale (Full-screen)
Visual order ; Back = .srb suite, Front = .srb suite vol & info
1. Fib.Retracement core is from tradingview built-in FBR ---> upgrade new-type GUI, and performance tuned.
2. Fixed-range volume-profile core is from the open-source one ---> some update & perf.tuned.
---------------------------------------------------------------------------------------------------------------------------------------
if you have any questions freely contact to me by message on tradingview.
but please understand that responses may be quite late.
Special thanks to all of contributors of community.
The script may be freely distributed under the MIT license.

Rollin' pseudo-Bollinger Bands 5 linear regression curves and new highs/lows mixed together from the basis for this indicator. Using slightly different logic an upper boundary and lower boundary are formed. Then the boundary's are built upon to show price channels within the band using variations of fib levels and the distance between the initial boundary's. Dots plotted show the inverse of the close price relative to either the upper or lower boundary depending on where the close is relative to the center of the band. This shows the market's tendency for symmetry which is useful when looking for reversals etc. If it's too cluttered feel free to turn off some things in the options and keep what you feel is helpful.

Mean Shift Pivot ClusteringCore Concepts
According to Jeff Greenblatt in his book "Breakthrough Strategies for Predicting Any Market", Fibonacci and Lucas sequences are observed repeated in the bar counts from local pivot highs/lows. They occur from high to high, low to high, high to low, or low to high. Essentially, this phenomenon is observed repeatedly from any pivot points on any time frame. Greenblatt combines this observation with Elliott Waves to predict the price and time reversals. However, I am no Elliottician so it was not easy for me to use this in a practical manner. I decided to only use the bar count projections and ignore the price. I projected a subset of Fibonacci and Lucas sequences along with the Fibonacci ratios from each pivot point. As expected, a projection from each pivot point resulted in a large set of plotted data and looks like a huge gong show of lines. Surprisingly, I did notice clusters and have observed those clusters to be fairly accurate.
Fibonacci Sequence: 1, 2, 3, 5, 8, 13, 21, 34...
Lucas Sequence: 2, 1, 3, 4, 7, 11, 18, 29, 47...
Fibonacci Ratios (converted to whole numbers): 23, 38, 50, 61, 78, 127, 161...
Light Bulb Moment
My eyes may suck at grouping the lines together but what about clustering algorithms? I chose to use a gimped version of Mean Shift because it doesn't require me to know in advance how many lines to expect like K-Means. Mean shift is computationally expensive and with Pinescript's 500ms timeout, I had to make due without the KDE. In other words, I skipped the weighting part but I may try to incorporate it in the future. The code is from Harrison Kinsley . He's a fantastic teacher!
Usage
Search Radius: how far apart should the bars be before they are excluded from the cluster? Try to stick with a figure between 1-5. Too large a figure will give meaningless results.
Pivot Offset: looks left and right X number of bars for a pivot. Same setting as the default TradingView pivot high/low script.
Show Lines Back: show historical predicted lines. (These can change)
Use this script in conjunction with Fibonacci price retracement/extension levels and/or other support/resistance levels. If it's no where near a support/resistance and there's a projected time pivot coming up, it's probably a fake out.
Notes
Re-painting is intended. When a new pivot is found, it will project out the Fib/Lucas sequences so the algorithm will run again with additional information.
The script is for informational and educational purposes only.
Do not use this indicator by itself to trade!

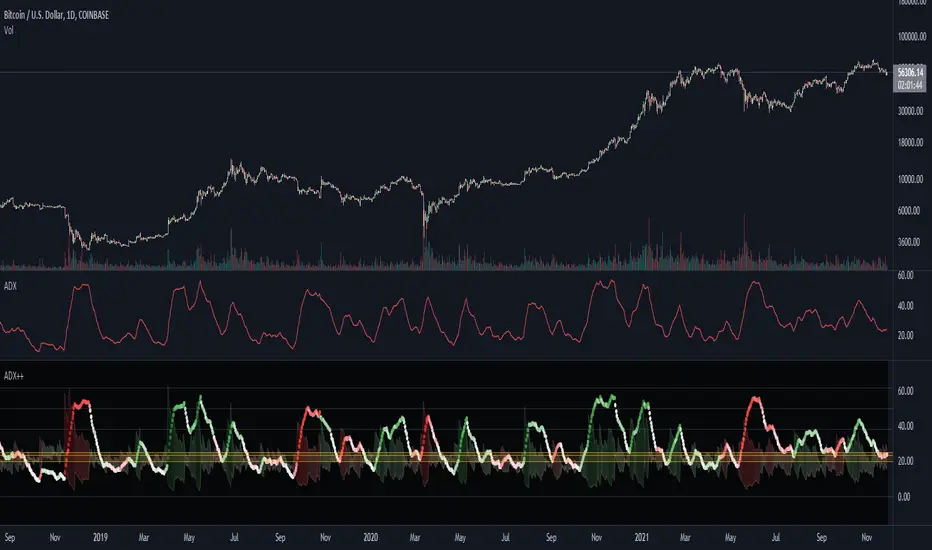
ADX Heatmap & Di's + Fib Referencial by [JohnnySnow]For quicker and easier interpretation, ADX line is displayed in a heatmap style. The more absolute difference between both DIs, the more intense the color.
Because some people use 20 ADX reference and others use 25 ADX reference to confirm the trend, I just add both as reference lines in a 'golden box'
Additionally, reference lines were added with default values set to Fib levels
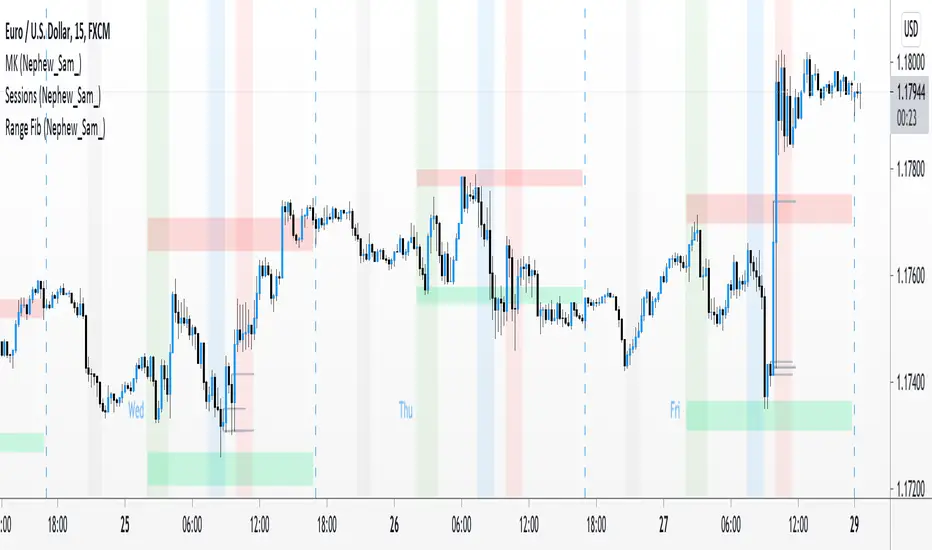
Range Fib (Nephew_Sam_)This indicator plots Fibonacci values based on a time range
Example: Asian session
If session time is 1700 - 0200, the indicator will find the high and low of that session then plot its fib extension lines and background outside of hours provided.
Currently supports 4 keys levels that can be changed under settings.
If you don't want the lines to display and only the background colors, you can uncheck the lines under the indicator settings -> styles.
[EG] Fib RSIExtrapolated Fibonacci MA (FMA) into an RSI
i.e. FMA(up) and FMA(dn) of lengths 2, 3, 5, 8, 13, 21, 34, 55, 89 etc. averaged into RSI values.
Keep in mind it does not use 'Length' - it uses 'Interval' - how many fib intervals to include in the RSI calculation.
I threw in Ehler's Smoothing as well - seems to work quite well, thanks to TV Community for inspiration and code to look at for help
(Standard RSI included for comparison)
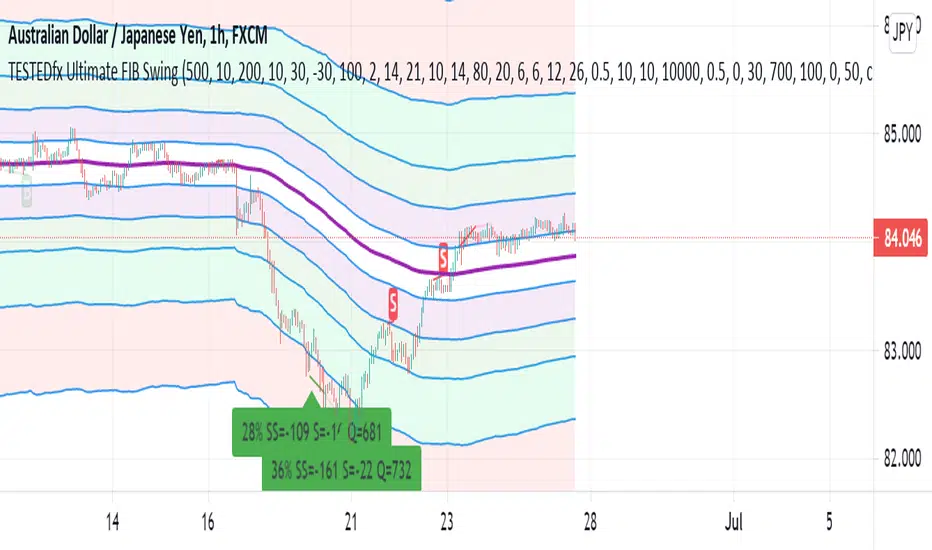
TESTEDfx Ultimate FIB SwingThis indicator displays FIB levels which price tends to respect and bounce off much of the time. It is not suitable to trade based on this indicator alone.
It was originally designed to augment our flagship Pitchfork Intersection tool but is useful with many trading systems. In our trading system we use it to confirm an already established precise entry point. The levels it produces on it's own are not precise enough to get 4R trades as we do with our pitchforks tool. Thus please only use it as a confirmation tool, not an entry tool.
I am releasing it to the tradingview community because it is useful as a confirmation tool with any other strategy which uses SR levels or pivot points. It can be used to confirm your signals.
It has has some built in signals based on RSI and divergences. These signals are experimental and should not be used to trade on their own.
If you like it please reach out to me and let me know. I would love to learn how it is benefitting you. Also if you would like to learn how I use it let me know that too.
Doug Collins
TESTEDfx