ZoneRadar by Chaitu50cZoneRadar
ZoneRadar is a tool designed to detect and visualize hidden buy or sell pressures in the market. Using a Z-Score based imbalance model, it identifies areas where buyers or sellers step in with strong momentum and highlights them as dynamic supply and demand zones.
How It Works
Z-Score Imbalance : Calculates statistical deviations in order flow (bull vs. bear pressure).
Buy & Sell Triggers: Detects when imbalances cross predefined thresholds.
Smart Zones: Marks potential buy (green) or sell (red) zones directly on your chart.
Auto-Merge & Clean: Overlapping or noisy zones are automatically merged to keep the chart clean.
History Control: Keeps only the most recent and strongest zones for focus.
Key Features
Customizable Z-Score level and lookback period
Cooldown filter to avoid over-signaling
Smart zone merging to prevent clutter
Adjustable price tolerance for merging overlapping zones (ticks)
Extend zones into the future with right extensions
Fully customizable colors and display settings
Alert conditions for Buy Pressure and Sell Pressure
Why ZoneRadar?
Simplifies complex order flow into clear, tradable zones
Helps identify high-probability reversal or continuation levels
Avoids noise by keeping only the cleanest zones
Works across any timeframe or market (stocks, futures, forex, crypto)
Disclaimer
This tool is designed for educational and informational purposes only. It does not provide financial advice. Always test on demo and combine with your own trading strategy.
Cari dalam skrip untuk "forex"

SESSIONS Golden Team SESSIONS — Multi-Session Forex Box & Range Analysis
This indicator displays the major Forex market sessions — London, New York, Tokyo, Sydney, and Frankfurt — directly on the chart. Each session is shown as a customizable colored box with optional Fibonacci levels and opening range markers.
It also calculates and displays the average pip range of each session over a user-defined number of past days, allowing traders to analyze volatility patterns for each trading period.
Key Features:
Configurable session times and time zones
Individual on/off toggle for each session
Custom colors, box transparency, and border styles
Optional Opening Range and Fibonacci retracement levels for each session
Average pip range table for quick volatility reference
Works on any intraday timeframe
How It Works:
The script identifies the start and end times of each session based on user settings.
A box is drawn around the high/low of the session period.
At the end of each session, the pip range is recorded, and an average is calculated over the last N sessions (default: 20).
The results are displayed in a statistics table showing average pips and whether the session is currently active.
Suggested Use:
Identify high-volatility sessions for breakout trading
Filter trades to active trading hours
Study historical volatility to refine entry timing

FX Sessions (DTS)FX Sessions (DST-Safe)
This indicator highlights the four main Forex trading sessions — Sydney, Tokyo, London, and New York — using the local timezone of each market.
• DST handled automatically: Sessions shift correctly when London or New York move clocks forward/back.
• Clear visualization: Light background shading for each session, with the London–New York overlap emphasized for peak liquidity.
• Customizable: Toggle individual sessions, labels, and the on-chart legend table.
• Intraday focus: Works best on lower timeframes (1m–1h) for identifying active trading hours and volatility windows.
Use this tool to instantly spot when liquidity and volatility are likely to increase, so you know where to focus your trading.

Multi-Timeframe HTS Retest Strategy v6Multi-Timeframe HTS Retest Strategy v6 is a trend-following tool designed to detect high-probability retest entries aligned with higher timeframe direction. The indicator applies HTS bands (short & long) on both the current and higher timeframe (4x–8x multiplier) to confirm market bias.
A strong trend is validated when HTS bands separate on the higher timeframe. On the lower timeframe, the strategy tracks price behavior relative to the bands: after breaking outside, price must retest either the fast (blue) or slow (red) band, confirmed by a rejection candle. This generates precise BUY or SELL retest signals.
Features include flexible average methods (RMA, EMA, SMA, etc.), customizable cross detection (final cross, 4 crosses, or both), volume-based retest conditions, and clear visual signals (dots for trend start, triangles for retests). Alerts are integrated for automation.
This strategy is suitable for forex, crypto, indices, and stocks, supporting both scalping and swing trading.

Triple Tap Sniper Triple Tap Sniper v3 – EMA Retest Precision System
Triple Tap Sniper is a precision trading tool built around the 21, 34, and 55 EMAs, designed to capture high-probability retests after EMA crosses. Instead of chasing the first breakout candle, the system waits for the first pullback into the EMA21 after a trend-confirming cross — the spot where professional traders often enter.
🔑 Core Logic
EMA Alignment → Trend defined by EMA21 > EMA34 > EMA55 (bullish) or EMA21 < EMA34 < EMA55 (bearish).
Cross Detection → Signals are only armed after a fresh EMA cross.
Retest Entry → Buy/Sell signals fire only on the first retest of EMA21, with trend still intact.
Pro Filters →
📊 Higher Timeframe Confirmation: Aligns signals with larger trend.
📈 ATR Volatility Filter: Blocks weak signals in low-vol chop.
📏 EMA Spread Filter: Ignores tiny “fake crosses.”
🕯️ Price Action Filter: Requires a proper wick rejection for valid entries.
🚀 Why Use Triple Tap Sniper?
✅ Filters out most false signals from sideways markets.
✅ Focuses only on clean trend continuations after pullbacks.
✅ Beginner-friendly visuals (Buy/Sell labels) + alert-ready for automation.
✅ Flexible: works across multiple timeframes & asset classes (stocks, crypto, forex).
⚠️ Notes
This is a signal indicator, not a full strategy. For backtesting and optimization, convert to a strategy and adjust filters per market/timeframe.
No indicator guarantees profits — use with sound risk management.

RSI Crossover AlertRSI Crossover Alert Indicator - User Guide
The RSI Crossover Alert Indicator is a comprehensive technical analysis tool that detects multiple types of RSI crossovers and generates real-time alerts. It combines traditional RSI analysis with signal lines, divergence detection, and multi-level crossing alerts.
1. Multiple Crossover Detection
- RSI/Signal Line Cross: Signals a primary trend change.
- RSI/Second Signal Cross: Confirmation signals for stronger trends.
- Level Crossings: Crosses of Overbought 70, Oversold 30, and Midline 50.
- Divergence Detection: Hidden and regular divergences for reversal signals.
2. Alert Types
- Alert: RSI > Signal
Description: Bullish momentum is building.
Signal: Consider long positions.
- Alert: RSI < Signal
Description: Bearish momentum is building.
Signal: Consider short positions.
- Alert: RSI > 70
Description: Entering the overbought zone.
Signal: Prepare for a potential reversal.
- Alert: RSI < 30
Description: Entering the oversold zone.
Signal: Watch for a bounce opportunity.
- Alert: RSI crosses 50
Description: A shift in momentum.
Signal: Trend confirmation.
3. Visual Components
- Lines: RSI blue, Signal orange, Second Signal purple
- Histogram: Visualizes momentum by showing the difference between RSI and the Signal line.
- Background Zones: Red overbought, Green oversold
- Markers: Up/down triangles to indicate crossovers.
- Info Table: Real-time RSI values and status.
Strategy 1: Classic Crossover
- Entry Long: RSI crosses above the Signal Line AND RSI is below 50.
- Entry Short: RSI crosses below the Signal Line AND RSI is above 50.
- Take Profit: On the opposite signal.
- Stop Loss: At the recent swing high/low.
Strategy 2: Extreme Zone Reversal
- Entry Long: RSI is below 30 and crosses above the Signal Line.
- Entry Short: RSI is above 70 and crosses below the Signal Line.
- Risk Management: Higher win rate but fewer signals. Use a minimum 2:1 risk-reward ratio.
Strategy 3: Divergence Trading
- Setup: Enable divergence alerts and look for price/RSI divergence. Wait for an RSI crossover for confirmation.
- Entry: Enter on the crossover after the divergence appears. Place the stop loss beyond the starting point of the divergence.
Strategy 4: Multi-Timeframe Confirmation
1. Check the higher timeframe e.g. Daily to identify the main trend.
2. Use the current timeframe e.g. 4H/1H for your entry.
3. Only enter in the direction of the main trend.
4. Use the RSI crossover as the entry trigger.
Optimal Settings by Market
- Forex Major Pairs
RSI Length: 14, Signal Length: 9, Overbought/Oversold: 70/30
- Crypto High Volatility
RSI Length: 10-12, Signal Length: 6-8, Overbought/Oversold: 75/25
- Stocks Trending
RSI Length: 14-21, Signal Length: 9-12, Overbought/Oversold: 70/30
- Commodities
RSI Length: 14, Signal Length: 9, Overbought/Oversold: 80/20
Risk Management Rules
1. Position Sizing: Never risk more than 1-2% on a single trade. Reduce size in ranging markets.
2. Stop Loss Placement: Place stops beyond the recent swing high/low for crossovers. Using an ATR-based stop is also effective.
3. Profit Taking: Take partial profits at a 1:1 risk-reward ratio. Switch to a trailing stop after reaching 2:1.
1. Filtering Signals
- Combine with volume indicators.
- Confirm the trend on a higher timeframe.
- Wait for candlestick pattern confirmation.
2. Avoid Common Mistakes
- Don't trade every single crossover.
- Avoid taking signals against a strong trend.
- Do not ignore risk management.
3. Market Conditions
- Trending Market: Focus on midline 50 crosses.
- Ranging Market: Look for reversals from overbought/oversold levels.
- Volatile Market: Widen the overbought/oversold levels.
- If you get too many false signals:
Increase the signal line period, add other confirmation indicators, or use a higher timeframe.
- If you are missing major moves:
Decrease the RSI length, shorten the signal line period, or check your alert settings.
Recommended Combinations
1. RSI + MACD: For dual momentum confirmation.
2. RSI + Bollinger Bands: For volatility-adjusted signals.
3. RSI + Volume: To confirm the strength of a signal.
4. RSI + Moving Averages: To use as a trend filter.
This indicator provides a comprehensive RSI analysis. Success depends on proper configuration, risk management, and combining signals with the overall market context. Start with the default settings, then optimize based on your trading style and market conditions.

Perfect Price-Anchored % Fib Grid This indicator generates support and resistance levels anchored to a fixed price of your choice.
You can also specify a percentage for the indicator to calculate potential highs and lows.
Commonly used values are 3.5% or 7%, as well as smaller decimal versions like 0.35% or 0.7%, depending on the volatility you expect.
In addition, the indicator can highlight potential stop-run levels in multiples of 27 — ranging from 0 up to 243. This automatically places the 243 GB range directly onto your chart.
The tool is versatile and can be applied not only to equities, but also to ES futures and Forex markets.

Big Orders Detector - Whale Activity SpotterDetect Institutional & Whale Trading Activity with Volume Analysis
This indicator helps traders identify significant buy/sell orders (whale activity) by analyzing volume spikes and price movements. Perfect for spotting institutional entries and exits.
📊 Key Features:
Volume Spike Detection - Identifies when volume exceeds average by customizable multiplier
Price Movement Analysis - Tracks significant price changes with adjustable threshold
Smart Direction Detection - Distinguishes between big buy and sell orders
Visual Markers - Clear arrows, background highlights, and detailed labels
Flexible Settings - Fully customizable parameters for different trading styles
Statistics Table - Optional real-time order count tracking
Alert System - Built-in alerts for automated notifications
⚙️ How It Works:
The indicator combines volume analysis with price movement detection to identify unusual market activity. When volume significantly exceeds the moving average AND price shows meaningful movement, it marks these as potential whale orders.
🎯 Best Used For:
Crypto markets with high volume activity
Forex pairs during major news events
Stock trading around earnings/announcements
Identifying institutional accumulation/distribution
📈 Settings Guide:
Volume Multiplier (3.0) - How many times above average volume (recommended minimum: 3.0)
Volume Period (20) - Moving average period for volume
Price Threshold (1.5%) - Minimum price change requirement
Visual Options - Toggle arrows, labels, and background highlights
💡 Trading Tips:
Use on liquid markets with consistent volume
Combine with support/resistance levels
Higher timeframes show more significant orders
Adjust sensitivity based on market volatility
⚠️ Important Notes:
Not financial advice - for educational purposes only
Past performance doesn't guarantee future results
Always use proper risk management
Test parameters on your specific markets
Perfect for swing traders, day traders, and anyone looking to spot whale activity in their favorite markets!

FibADX MTF Dashboard — DMI/ADX with Fibonacci DominanceFibADX MTF Dashboard — DMI/ADX with Fibonacci Dominance (φ)
This indicator fuses classic DMI/ADX with the Fibonacci Golden Ratio to score directional dominance and trend tradability across multiple timeframes in one clean panel.
What’s unique
• Fibonacci dominance tiers:
• BULL / BEAR → one side slightly stronger
• STRONG when one DI ≥ 1.618× the other (φ)
• EXTREME when one DI ≥ 2.618× (φ²)
• Rounded dominance % in the +DI/−DI columns (e.g., STRONG BULL 72%).
• ADX column modes: show the value (with strength bar ▂▃▅… and slope ↗/↘) or a tier (Weak / Tradable / Strong / Extreme).
• Configurable intraday row (30m/1H/2H/4H) + D/W/M toggles.
• Threshold line: color & width; Extended (infinite both ways) or Not extended (historical plot).
• Theme presets (Dark / Light / High Contrast) or full custom colors.
• Optional panel shading when all selected TFs are strong (and optionally directionally aligned).
How to use
1. Choose an intraday TF (30/60/120/240). Enable D/W/M as needed.
2. Use ADX ≥ threshold (e.g., 21 / 34 / 55) to find tradable trends.
3. Read the +DI/−DI labels to confirm bias (BULL/BEAR) and conviction (STRONG/EXTREME).
4. Prefer multi-TF alignment (e.g., 4H & D & W all strong bull).
5. Treat EXTREME as a momentum regime—trail tighter and scale out into spikes.
Alerts
• All selected TFs: Strong BULL alignment
• All selected TFs: Strong BEAR alignment
Notes
• Smoothing selectable: RMA (Wilder) / EMA / SMA.
• Percentages are whole numbers (72%, not 72.18%).
• Shorttitle is FibADX to comply with TV’s 10-char limit.
Why We Use Fibonacci in FibADX
Traditional DMI/ADX indicators rely on fixed numeric thresholds (e.g., ADX > 20 = “tradable”), but they ignore the relationship between +DI and −DI, which is what really determines trend conviction.
FibADX improves on this by introducing the Fibonacci Golden Ratio (φ ≈ 1.618) to measure directional dominance and classify trend strength more intelligently.
⸻
1. Fibonacci as a Natural Strength Threshold
The golden ratio φ appears everywhere in nature, growth cycles, and fractals.
Since financial markets also behave fractally, Fibonacci levels reflect natural crowd behavior and trend acceleration points.
In FibADX:
• When one DI is slightly larger than the other → BULL or BEAR (mild advantage).
• When one DI is at least 1.618× the other → STRONG BULL or STRONG BEAR (trend conviction).
• When one DI is 2.618× or more → EXTREME BULL or EXTREME BEAR (high momentum regime).
This approach adds structure and consistency to trend classification.
⸻
2. Why 1.618 and 2.618 Instead of Random Numbers
Other traders might pick thresholds like 1.5 or 2.0, but φ has special mathematical properties:
• φ is the most irrational ratio, meaning proportions based on φ retain structure even when scaled.
• Using φ makes FibADX naturally adaptive to all timeframes and asset classes — stocks, crypto, forex, commodities.
⸻
3 . Trading Advantages
Using the Fibonacci Golden Ratio inside DMI/ADX has several benefits:
• Better trend filtering → Avoid false DI crossovers without conviction.
• Catch early momentum shifts → Spot when dominance ratios approach φ before ADX reacts.
• Consistency across markets → Because φ is scalable and fractal, it works everywhere.
⸻
4. How FibADX Uses This
FibADX combines:
• +DI vs −DI ratio → Measures directional dominance.
• φ thresholds (1.618, 2.618) → Classifies strength into BULL, STRONG, EXTREME.
• ADX threshold → Confirms whether the move is tradable or just noise.
• Multi-timeframe dashboard → Aligns bias across 4H, D, W, M.
⸻
Quick Blurb for TradingView
FibADX uses the Fibonacci Golden Ratio (φ ≈ 1.618) to classify trend strength.
Unlike classic DMI/ADX, FibADX measures how much one side dominates:
• φ (1.618) = STRONG trend conviction
• φ² (2.618) = EXTREME momentum regime
This creates an adaptive, fractal-aware framework that works across stocks, crypto, forex, and commodities.
⚠️ Disclaimer : This script is provided for educational purposes only.
It does not constitute financial advice.
Use at your own risk. Always do your own research before making trading decisions.
Created by @nomadhedge

ATR% | Volatility NormalizerThis indicator measures true volatility by expressing the Average True Range (ATR) as a percentage of price. Unlike basic ATR plots, which show raw values, this version normalizes volatility to make it directly comparable across instruments and timeframes.
How it works:
Uses True Range (High–Low plus gaps) to capture actual market movement.
Normalizes by dividing ATR by the chosen price base (default: Close).
Multiplies by 100 to output a clean ATR% line.
Smoothing is flexible: choose from RMA, SMA, EMA, or WMA.
Optional Feature:
For comparison, you can toggle an auxiliary line showing the average absolute close-to-close % move, highlighting the difference between simplified and true volatility.
Why use it:
Track regime shifts: identify when volatility expands or contracts in % terms.
Compare volatility across different markets (equities, crypto, forex, commodities).
Integrate into risk management: position sizing, stop placement, or volatility filters for entries.
Interpretation:
Rising ATR% → expanding volatility, potential breakouts or unstable ranges.
Falling ATR% → contracting volatility, possible consolidation or range-bound conditions.
Sudden spikes → market “shocks” worth paying attention to.

Advanced Range Analyzer ProAdvanced Range Analyzer Pro – Adaptive Range Detection & Breakout Forecasting
Overview
Advanced Range Analyzer Pro is a comprehensive trading tool designed to help traders identify consolidations, evaluate their strength, and forecast potential breakout direction. By combining volatility-adjusted thresholds, volume distribution analysis, and historical breakout behavior, the indicator builds an adaptive framework for navigating sideways price action. Instead of treating ranges as noise, this system transforms them into opportunities for mean reversion or breakout trading.
How It Works
The indicator continuously scans price action to identify active range environments. Ranges are defined by volatility compression, repeated boundary interactions, and clustering of volume near equilibrium. Once detected, the indicator assigns a strength score (0–100), which quantifies how well-defined and compressed the consolidation is.
Breakout probabilities are then calculated by factoring in:
Relative time spent near the upper vs. lower range boundaries
Historical breakout tendencies for similar structures
Volume distribution inside the range
Momentum alignment using auxiliary filters (RSI/MACD)
This creates a live probability forecast that updates as price evolves. The tool also supports range memory, allowing traders to analyze the last completed range after a breakout has occurred. A dynamic strength meter is displayed directly above each consolidation range, providing real-time insight into range compression and breakout potential.
Signals and Breakouts
Advanced Range Analyzer Pro includes a structured set of visual tools to highlight actionable conditions:
Range Zones – Gradient-filled boxes highlight active consolidations.
Strength Meter – A live score displayed in the dashboard quantifies compression.
Breakout Labels – Probability percentages show bias toward bullish or bearish continuation.
Breakout Highlights – When a breakout occurs, the range is marked with directional confirmation.
Dashboard Table – Displays current status, strength, live/last range mode, and probabilities.
These elements update in real time, ensuring that traders always see the current state of consolidation and breakout risk.
Interpretation
Range Strength : High scores (70–100) indicate strong consolidations likely to resolve explosively, while low scores suggest weak or choppy ranges prone to false signals.
Breakout Probability : Directional bias greater than 60% suggests meaningful breakout pressure. Equal probabilities indicate balanced compression, favoring mean-reversion strategies.
Market Context : Ranges aligned with higher timeframe trends often resolve in the dominant direction, while counter-trend ranges may lead to reversals or liquidity sweeps.
Volatility Insight : Tight ranges with low ATR imply imminent expansion; wide ranges signal extended consolidation or distribution phases.
Strategy Integration
Advanced Range Analyzer Pro can be applied across multiple trading styles:
Breakout Trading : Enter on probability shifts above 60% with confirmation of volume or momentum.
Mean Reversion : Trade inside ranges with high strength scores by fading boundaries and targeting equilibrium.
Trend Continuation : Focus on ranges that form mid-trend, anticipating continuation after consolidation.
Liquidity Sweeps : Use failed breakouts at boundaries to capture reversals.
Multi-Timeframe : Apply on higher timeframes to frame market context, then execute on lower timeframes.
Advanced Techniques
Combine with volume profiles to identify areas of institutional positioning within ranges.
Track sequences of strong consolidations for trend development or exhaustion signals.
Use breakout probability shifts in conjunction with order flow or momentum indicators to refine entries.
Monitor expanding/contracting range widths to anticipate volatility cycles.
Custom parameters allow fine-tuning sensitivity for different assets (crypto, forex, equities) and trading styles (scalping, intraday, swing).
Inputs and Customization
Range Detection Sensitivity : Controls how strictly ranges are defined.
Strength Score Settings : Adjust weighting of compression, volume, and breakout memory.
Probability Forecasting : Enable/disable directional bias and thresholds.
Gradient & Fill Options : Customize range visualization colors and opacity.
Dashboard Display : Toggle live vs last range, info table size, and position.
Breakout Highlighting : Choose border/zone emphasis on breakout events.
Why Use Advanced Range Analyzer Pro
This indicator provides a data-driven approach to trading consolidation phases, one of the most common yet underutilized market states. By quantifying range strength, mapping probability forecasts, and visually presenting risk zones, it transforms uncertainty into clarity.
Whether you’re trading breakouts, fading ranges, or mapping higher timeframe context, Advanced Range Analyzer Pro delivers a structured, adaptive framework that integrates seamlessly into multiple strategies.

BBMA Enhanced Pro - Multi-Timeframe Band Breakout StrategyShort Title : BBMA Pro
Overview
The BBMA Enhanced Pro is a professional-grade trading indicator that builds on the Bollinger Bands Moving Average (BBMA) strategy, pioneered by Omar Ali , a Malaysian forex trader and educator. Combining Bollinger Bands with Weighted Moving Averages (WMA) , this indicator identifies high-probability breakout and reversal opportunities across multiple timeframes. With advanced features like multi-timeframe Extreme signal detection, eight professional visual themes, and a dual-mode dashboard, it’s designed for traders seeking precision in trending and consolidating markets. Optimized for dark chart backgrounds, it’s ideal for forex, stocks, and crypto trading.
History
The BBMA strategy was developed by Omar Ali (BBMA Oma Ally) in the early 2010s, gaining popularity in the forex trading community, particularly in Southeast Asia. Building on John Bollinger’s Bollinger Bands, Omar Ali integrated Weighted Moving Averages and a multi-timeframe approach to create a structured system for identifying reversals, breakouts, and extreme conditions. The BBMA Enhanced Pro refines this framework with modern features like real-time dashboards and customizable visualizations, making it accessible to both novice and experienced traders.
Key Features
Multi-Timeframe Extreme Signals : Detects Extreme signals (overbought/oversold conditions) on both current and higher timeframes simultaneously, a rare feature that enhances signal reliability through trend alignment.
Professional Visual Themes : Eight distinct themes (e.g., Neon Contrast, Fire Gradient) optimized for dark backgrounds.
Dual-Mode Dashboard : Choose between Full Professional (detailed metrics) or Simplified Trader (essential info with custom notes).
Bollinger Band Squeeze Detection : Identifies low volatility periods (narrow bands) signaling potential sideways markets or breakouts.
Confirmation Labels : Displays labels when current timeframe signals align with recent higher timeframe signals, highlighting potential consolidations or squeezes.
Timeframe Validation : Prevents selecting the same timeframe for current and higher timeframe analysis.
Customizable Visualization : Toggle signal dots, EMA 50, and confirmation labels for a clean chart experience.
How It Works
The BBMA Enhanced Pro combines Bollinger Bands (20-period SMA, ±2 standard deviations) with WMA (5 and 10 periods) to generate trade signals:
Buy Signal : WMA 5 Low crosses above the lower Bollinger Band, indicating a recovery from an oversold condition (Extreme buy).
Sell Signal : WMA 5 High crosses below the upper Bollinger Band, signaling a rejection from an overbought condition (Extreme sell).
Extreme Signals : Occur when prices or WMAs move significantly beyond the Bollinger Bands (±2σ), indicating statistically rare overextensions. These often coincide with Bollinger Band Squeezes (narrow bands, low standard deviation), signaling potential sideways markets or impending breakouts.
Multi-Timeframe Confirmation : The indicator’s unique strength is its ability to detect Extreme signals on both the current and higher timeframe (HTF) within the same chart. When the HTF generates an Extreme signal (e.g., buy), and the current timeframe follows with an identical signal, it suggests the lower timeframe is aligning with the HTF’s trend, increasing reliability. Labels appear only when this alignment occurs within a user-defined lookback period (default: 50 bars), highlighting periods of band contraction across timeframes.
Bollinger Band Squeeze : Narrow bands (low standard deviation) indicate reduced volatility, often preceding consolidation or breakouts. The indicator’s dashboard tracks band width, helping traders anticipate these phases.
Why Multi-Timeframe Extremes Matter
The BBMA Enhanced Pro’s multi-timeframe approach is rare and powerful. When the higher timeframe shows an Extreme signal followed by a similar signal on the current timeframe, it suggests the market is following the HTF’s trend or entering a consolidation phase. For example:
HTF Sideways First : If the HTF Bollinger Bands are shrinking (low volatility, low standard deviation), it signals a potential sideways market. Waiting for the current timeframe to show a similar Extreme signal confirms this consolidation, reducing the risk of false breakouts.
Risk Management : By requiring HTF confirmation, the indicator encourages traders to lower risk during uncertain periods, waiting for both timeframes to align in a low-volatility state before acting.
Usage Instructions
Select Display Mode :
Current TF Only : Shows Bollinger Bands and WMAs on the chart’s timeframe.
Higher TF Only : Displays HTF bands and WMAs.
Both Timeframes : Combines both for comprehensive analysis.
Choose Higher Timeframe : Select from 1min to 1D (e.g., 15min, 1hr). Ensure it differs from the current timeframe to avoid validation errors.
Enable Signal Dots : Visualize buy/sell Extreme signals as dots, sourced from current, HTF, or both timeframes.
Toggle Confirmation Labels : Display labels when current timeframe Extremes align with recent HTF Extremes, signaling potential squeezes or consolidations.
Customize Dashboard :
Full Professional Mode : View metrics like BB width, WMA trend, and last signal.
Simplified Trader Mode : Focus on essential info with custom trader notes.
Select Visual Theme : Choose from eight themes (e.g., Ice Crystal, Royal Purple) for optimal chart clarity.
Trading Example
Setup : 5min chart, HTF set to 1hr, signal dots and confirmation labels enabled.
Buy Scenario : On the 5min chart, WMA 5 Low crosses above the lower Bollinger Band (Extreme buy), confirmed by a recent 1hr Extreme buy signal within 50 bars. The dashboard shows narrow bands (squeeze), and a green label appears.
Action : Enter a long position, targeting the middle band, with a stop-loss below the recent low. The HTF confirmation suggests a strong trend or consolidation phase.
Sell Scenario : WMA 5 High crosses below the upper Bollinger Band on the 5min chart, confirmed by a recent 1hr Extreme sell signal. The dashboard indicates a squeeze, and a red label appears.
Action : Enter a short position, targeting the middle band, with a stop-loss above the recent high. The aligned signals suggest a potential reversal or sideways market.
Customization Options
BBMA Display Mode : Current TF Only, Higher TF Only, or Both Timeframes.
Higher Timeframe : 1min to 1D.
Visual Theme : Eight professional themes (e.g., Neon Contrast, Forest Glow).
Line Style : Smooth or Step Line for HTF plots.
Signal Dots : Enable/disable, select timeframe source (Current, Higher, or Both).
Confirmation Labels : Toggle and set lookback window (1-100 bars).
Dashboard : Enable/disable, choose mode (Full/Simplified), and set position (Top Right, Bottom Left, etc.).
Notes
Extreme Signals and Squeezes : Extreme signals often occur during Bollinger Band contraction (low standard deviation), signaling potential sideways markets or breakouts. Use HTF confirmation to filter false signals.
Risk Management : If the HTF shows a squeeze (narrow bands), wait for the current timeframe to confirm with an Extreme signal to reduce risk in choppy markets.
Limitations : Avoid trading Extremes in highly volatile markets without additional confirmation (e.g., volume, RSI).
Author Enhanced Professional Edition, inspired by Omar Ali’s BBMA strategy
Version : 6.0 Pro - Simplified
Last Updated : September 2025
License : Mozilla Public License 2.0
We’d love to hear your feedback! Share your thoughts or questions in the comments below.

Liquidity Sweep ReversalOverview
The Liquidity Sweep Reversal indicator is a sophisticated intraday trading tool designed to identify high-probability reversal opportunities after liquidity sweeps occur at key market levels. Based on Smart Money Concepts (SMC) and Institutional Order Flow analysis, this indicator helps traders catch market reversals when stop-loss clusters are hunted.
Key Features
🎯 Multi-Level Liquidity Analysis
Previous Day High/Low (PDH/PDL) detection
Previous Week High/Low (PWH/PWL) tracking
Session highs/lows for Asian, London, and New York markets
Real-time level validation and usage tracking
⚡ Advanced Signal Generation
CISD (Change In State of Delivery) detection algorithm
Engulfing pattern recognition at key levels
Liquidity sweep confirmation system
Directional bias filtering to avoid false signals
⏰ Kill Zone Integration
Pre-configured optimal trading windows
Asian Kill Zone (20:00-00:00 EST)
London Kill Zone (02:00-05:00 EST)
New York AM/PM Kill Zones (08:30-11:00 & 13:30-16:00 EST)
Optional kill zone-only trading mode
🛠 Customization Options
Multiple timezone support (NY, London, Tokyo, Shanghai, UTC)
Flexible HTF (Higher Time Frame) selection
Adjustable signal sensitivity
Visual customization for all levels and signals
Hide historical signals option for cleaner charts
How It Works
The indicator continuously monitors price action around key liquidity levels
When price sweeps liquidity (stop-loss hunting), it marks potential reversal zones
Confirmation signals are generated through CISD or engulfing patterns
Trade signals appear as arrows with color-coded candles for easy identification
Best Suited For
Intraday traders focusing on 1m to 15m timeframes
Smart Money Concepts (SMC) practitioners
Scalpers looking for high-probability reversal entries
Traders who understand liquidity and market structure
Usage Tips
Works best on liquid forex pairs and major indices
Combine with volume analysis for stronger confirmation
Use proper risk management - not all signals will be winners
Monitor higher timeframe bias for better accuracy
==============================================
日内流动性掠夺反向开单指标
指标简介
这是一款基于Smart Money概念(SMC)开发的高级日内交易指标,专门用于识别市场在关键价格水平扫除流动性后的反转机会。通过分析机构订单流和流动性分布,帮助交易者精准捕捉止损扫单后的市场反转点。
核心功能
多维度流动性分析
前日高低点(PDH/PDL)自动标记
前周高低点(PWH/PWL)动态跟踪
亚洲、伦敦、纽约三大交易时段高低点识别
关键位使用状态实时监控,避免重复信号
智能信号系统
CISD(Change In State of Delivery)算法检测
关键位吞没形态识别
流动性扫除确认机制
方向过滤系统,大幅降低虚假信号
黄金交易时段
内置Kill Zone时间窗口
支持亚洲、伦敦、纽约AM/PM四个黄金时段
可选择仅在Kill Zone内交易
时区智能切换,全球交易者适用
个性化设置
支持多时区切换(纽约/伦敦/东京/上海/UTC)
HTF周期自动适配或手动选择
信号灵敏度可调
所有图表元素均可自定义样式
历史信号隐藏功能,保持图表整洁
适用人群
日内短线交易者(1分钟-15分钟)
SMC交易体系践行者
追求高胜率反转入场的投机者
理解流动性和市场结构的专业交易者
使用建议
推荐用于主流加密货币、外汇对和股指期货
配合成交量分析效果更佳
严格止损,理性对待每个信号
关注更高时间框架的趋势方向
风险提示: 任何技术指标都不能保证100%准确,请结合自己的交易系统和风险管理使用。

Position Size CalculatorPosition Size Calculator
This open-source Pine Script® indicator helps traders manage risk by calculating position size, margin, and risk/reward based on account size, leverage, entry, stop-loss, and take-profit. It features a customizable table and optional chart lines/labels for clear trade planning across stocks, forex, crypto, and futures.
What It Does
- Position Size: Computes units to trade based on risk percentage and stop-loss distance, capped by leverage.
- Margin: Calculates initial margin in base currency and USD, with account size percentage.
- Risk/Reward: Shows risk-reward ratio, percentage price movements, and USD gains/losses.
- Visualization: Displays results in a table and optional chart lines/labels with customizable styles.
How It Works
- Precision: Adjusts price formatting using syminfo.mintick for accuracy across assets.
- Calculations: Position size = accountSize * (riskPercent / 100) / |entry - stoploss|, capped by accountSize * leverage / entry. Margin = positionSize / leverage. Risk-reward = |takeprofit - entry| / |stoploss - entry|.
- Display: Table shows metrics; optional lines/labels plot entry, stop-loss, and take-profit with percentage and USD details.
How to Use
- Set Inputs:
1- Account Size (USD): Your capital (e.g., 1000).
2- % Risk per Trade: Risk tolerance (e.g., 1%).
3- Leverage: Broker leverage (e.g., 1x, 10x).
4- Entry, Stop Loss, Take Profit: Trade prices.
5- Show Lines and Labels: Enable chart overlays.
- Customize: Adjust table position, colors, and line styles (Solid, Dashed, Dotted).
- View Results: Table shows position size, margin, and risk/reward. Chart lines/labels (if enabled) display prices, percentages, and USD outcomes.
- Apply: Use metrics for trade execution; modify code for custom features.
Notes
- Ensure valid inputs (entry ≠ stop-loss, both positive) to avoid “N/A”.
- Open-source: Inspect or extend the code for your needs.
- Contact the author via TradingView for feedback.

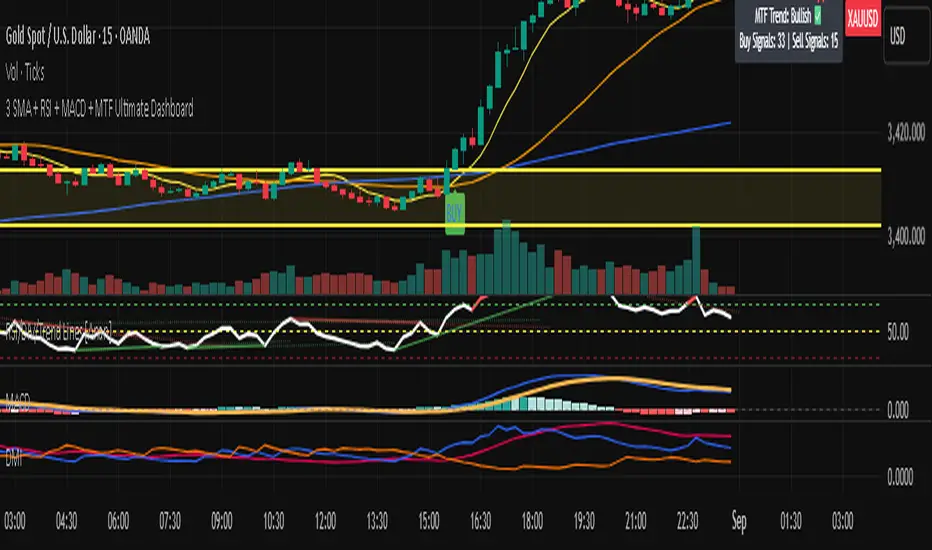
3 SMA + RSI + MACD + MTF Ultimate Dashboard🎯 Overview:
High-precision trading indicator combining trend, momentum, and multi-timeframe confirmation for reliable buy/sell signals in Forex, Crypto, and other markets.
🔹 Core Features:
📈 3 SMAs (7/25/99) – Short, Medium & Long-term trend detection
⚡ RSI Filter – Avoid weak signals (Buy >55 / Sell <45)
💎 MACD with Threshold – Reduce false crossovers
⏱️ Multi-Timeframe Trend (H4) – Confirm overall market direction
✅ Dashboard & Signals:
🟢 Clear Buy & Sell arrows on chart
📊 Live dashboard showing filter status & total signals
🔔 Audio & Push Alerts – Mobile/Desktop/Webhook
💎 Benefits:
⚡ Minimizes false signals
📈 Works on M15, H1, H4, Daily
🎯 Combines trend, momentum, and confirmation filters in one dashboard
⚠️ Note: Signals are generated only after candle close for maximum reliability.
