Hidden Liquidity Basic🟦 Hidden Liquidity Indicator – Basic Version
The Basic Version of the Hidden Liquidity Indicator expands on the Free version with advanced analytical features, full customization, and extended multi-timeframe capabilities.
Designed for professional and detail-oriented traders, it offers greater precision and control in identifying and interpreting Hidden Order Blocks (HOBs), Partial Hidden Order Blocks (PHOBs), and Partially Mitigated Hidden Order Blocks (PMHOBs).
🔍 Key Features
• Full Multi-Timeframe Analysis
Detect HOBs, PHOBs, and PMHOBs across up to 8 timeframes, allowing deep market structure comparison and multi-level confluence detection.
• Extended Visualization & Labelling Tools
• Extended boxes for clear structural mapping across larger chart areas.
• Merging labels to reduce clutter and improve readability.
• Multiple color schemes for clear differentiation between order block types.
• Advanced Customization Options
• Define individual ranges for each timeframe.
• Set a custom minimum HOB size to filter smaller or irrelevant zones.
• Adjust custom engulfing settings to fine-tune OB detection sensitivity.
• Create custom names for better chart management and strategy integration.
• Partial & Mitigation Analysis
The Basic version identifies and categorizes all hidden liquidity zones based on mitigation level:
• HOB (Hidden Order Block): Candle body fully within the FVG and untouched by wicks – a strong, valid liquidity block.
• PHOB (Partial Hidden Order Block): At least 50% of the candle body sits inside the FVG – representing partial liquidity presence.
• PMHOB (Partially Mitigated Hidden Order Block): Candle body mitigated by less than 50% – a partially weakened zone but still significant.
For all valid HOBs, the equilibrium (EQ) must be crossed by the corresponding FVG.
• Clustering Engine
Integrates a clustering system that automatically groups nearby or overlapping order blocks, creating a more organized and efficient visualization of liquidity concentrations.
🎨 Visual Consistency
All order blocks are color-coded for quick and intuitive recognition
⚙️ Summary
The Basic version is a professional-grade upgrade that combines advanced structure detection, customizable parameters, and a smart clustering engine for deeper liquidity insights.
With up to 8 timeframe support, extended visualization tools, and custom configuration options, it gives traders full control over how hidden liquidity is identified, displayed, and analyzed — empowering strategic precision and refined decision-making.
Cari dalam skrip untuk "fvg"

HUNT_line [Dr.Forexy]HUNT_line Indicator
📊 **Category:** Price Action & Market Structure
⏰ **Recommended Timeframe:** 5-minute and higher
🎯 **Purpose:** Advanced market structure visualization for professional traders
⸻
⚡ **Key Features:**
• Break of Structure (BOS) and Change of Character (CHOCH) detection
• Internal & Swing Market Structure analysis
• Order Blocks identification with smart filtering
• Fair Value Gaps (FVG) visualization
• Premium/Discount Zones
• Multi-timeframe support
• Real-time structure alerts
⸻
🛠 **How to Use:**
1. Apply on 5M or higher timeframes for best results
2. Monitor BOS/CHOCH for trend direction changes
3. Use Order Blocks as potential support/resistance areas
4. Watch for FVG fills as price inefficiency zones
5. Combine multiple confluences for higher probability setups
⸻
⚠️ **Risk Disclaimer:**
This indicator is for educational purposes only.
Not financial advice. Always conduct your own research.
⸻
🔹 **Credits:**
Inspired by LuxAlgo's "Smart Money Concepts" with custom improvements

SCTI - D14SCTI - D14 Comprehensive Technical Analysis Suite
English Description
SCTI D14 is an advanced multi-component technical analysis indicator designed for professional traders and analysts. This comprehensive suite combines multiple analytical tools into a single, powerful indicator that provides deep market insights across various timeframes and methodologies.
Core Components:
1. EMA System (Exponential Moving Averages)
13 customizable EMA lines with periods ranging from 8 to 2584
Fibonacci-based periods (8, 13, 21, 34, 55, 89, 144, 233, 377, 610, 987, 1597, 2584)
Color-coded visualization for easy trend identification
Individual toggle controls for each EMA line
2. TFMA (Multi-Timeframe Moving Averages)
Cross-timeframe analysis with 3 independent EMA calculations
Real-time labels showing trend direction and price relationships
Customizable timeframes for each moving average
Percentage deviation display from current price
3. PMA (Precision Moving Average Cloud)
7-layer moving average system with customizable periods
Fill areas between moving averages for trend visualization
Support and resistance zone identification
Dynamic color-coded trend clouds
4. VWAP (Volume Weighted Average Price)
Multiple anchor points (Session, Week, Month, Quarter, Year, Earnings, Dividends, Splits)
Standard deviation bands for volatility analysis
Automatic session detection and anchoring
Statistical price level identification
5. Advanced Divergence Detector
12 technical indicators for divergence analysis (MACD, RSI, Stochastic, CCI, Williams %R, Bias, Momentum, OBV, VW-MACD, CMF, MFI, External)
Regular and hidden divergences detection
Bullish and bearish signals with visual confirmation
Customizable sensitivity and filtering options
Real-time alerts for divergence formations
6. Volume Profile & Node Analysis
Comprehensive volume distribution analysis
Point of Control (POC) identification
Value Area High/Low (VAH/VAL) calculations
Volume peaks and troughs detection
Support and resistance levels based on volume
7. Smart Money Concepts
Market structure analysis with Break of Structure (BOS) and Change of Character (CHoCH)
Internal and swing structure detection
Equal highs and lows identification
Fair Value Gaps (FVG) detection and visualization
Liquidity zones and institutional flow analysis
8. Trading Sessions
9 major trading sessions (Asia, Sydney, Tokyo, Shanghai, Hong Kong, Europe, London, New York, NYSE)
Real-time session status and countdown timers
Session volume and performance tracking
Customizable session boxes and labels
Statistical session analysis table
Key Features:
Modular Design: Enable/disable any component independently
Real-time Analysis: Live updates with market data
Multi-timeframe Support: Works across all chart timeframes
Customizable Alerts: Set alerts for any detected pattern or signal
Professional Visualization: Clean, organized display with customizable colors
Performance Optimized: Efficient code for smooth chart performance
Use Cases:
Trend Analysis: Identify market direction using multiple EMA systems
Entry/Exit Points: Use divergences and structure breaks for timing
Risk Management: Utilize volume profiles and session analysis for better positioning
Multi-timeframe Analysis: Confirm signals across different timeframes
Institutional Analysis: Track smart money flows and market structure
Perfect For:
Day traders seeking comprehensive market analysis
Swing traders needing multi-timeframe confirmation
Professional analysts requiring detailed market structure insights
Algorithmic traders looking for systematic signal generation
---
中文描述
SCTI - D14是一个先进的多组件技术分析指标,专为专业交易者和分析师设计。这个综合套件将多种分析工具整合到一个强大的指标中,在各种时间框架和方法论中提供深度市场洞察。
核心组件:
1. EMA系统(指数移动平均线)
13条可定制EMA线,周期从8到2584
基于斐波那契的周期(8, 13, 21, 34, 55, 89, 144, 233, 377, 610, 987, 1597, 2584)
颜色编码可视化,便于趋势识别
每条EMA线的独立切换控制
2. TFMA(多时间框架移动平均线)
跨时间框架分析,包含3个独立的EMA计算
实时标签显示趋势方向和价格关系
每个移动平均线的可定制时间框架
显示与当前价格的百分比偏差
3. PMA(精密移动平均云)
7层移动平均系统,周期可定制
移动平均线间填充区域用于趋势可视化
支撑阻力区域识别
动态颜色编码趋势云
4. VWAP(成交量加权平均价格)
多个锚点(交易时段、周、月、季、年、财报、分红、拆股)
标准差带用于波动性分析
自动时段检测和锚定
统计价格水平识别
5. 高级背离检测器
12个技术指标用于背离分析(MACD、RSI、随机指标、CCI、威廉姆斯%R、Bias、动量、OBV、VW-MACD、CMF、MFI、外部指标)
常规和隐藏背离检测
看涨看跌信号配视觉确认
可定制敏感度和过滤选项
背离形成的实时警报
6. 成交量分布与节点分析
全面的成交量分布分析
控制点(POC)识别
价值区域高/低点(VAH/VAL)计算
成交量峰值和低谷检测
基于成交量的支撑阻力水平
7. 聪明钱概念
市场结构分析,包括结构突破(BOS)和结构转变(CHoCH)
内部和摆动结构检测
等高等低识别
公允价值缺口(FVG)检测和可视化
流动性区域和机构资金流分析
8. 交易时区
9个主要交易时段(亚洲、悉尼、东京、上海、香港、欧洲、伦敦、纽约、纽交所)
实时时段状态和倒计时器
时段成交量和表现跟踪
可定制时段框和标签
统计时段分析表格
主要特性:
模块化设计:可独立启用/禁用任何组件
实时分析:随市场数据实时更新
多时间框架支持:适用于所有图表时间框架
可定制警报:为任何检测到的模式或信号设置警报
专业可视化:清洁、有序的显示界面,颜色可定制
性能优化:高效代码确保图表流畅运行
使用场景:
趋势分析:使用多重EMA系统识别市场方向
入场/出场点:利用背离和结构突破进行时机选择
风险管理:利用成交量分布和时段分析进行更好定位
多时间框架分析:在不同时间框架间确认信号
机构分析:跟踪聪明钱流向和市场结构
适用于:
寻求全面市场分析的日内交易者
需要多时间框架确认的摆动交易者
需要详细市场结构洞察的专业分析师
寻求系统化信号生成的算法交易者

HTF SwingFind swing formations on HTF
See in a table which LTF FVG setups get unlocked
FVG color based on unlocked status of HTF swing

ICT Turtle Soup (Riz)The ICT Turtle Soup Complete System is an advanced implementation of the Inner Circle Trader's interpretation of the classic Turtle Soup pattern, designed to identify and trade liquidity sweeps at key market levels. This strategy capitalizes on the systematic stop-loss hunting behavior of institutional traders by detecting when price temporarily breaches significant support/resistance levels to trigger retail stop-losses, then quickly reverses direction.
Core Trading Logic
Liquidity Sweep Detection Method
The strategy monitors five critical liquidity pools where retail traders commonly place stop-loss orders:
⦁ Yesterday's High/Low: Previous daily session extremes
⦁ Daily High/Low: Rolling 20-day period extremes
⦁ 4-Hour High/Low: 30-period extremes on 4H timeframe
⦁ 1-Hour High/Low: 50-period extremes on hourly timeframe
⦁ Recent High/Low: Current timeframe extremes (20-40 bars based on trading mode)
Entry Signal Generation Process
Buy Signal (Sell-Side Liquidity Sweep):
1. Price penetrates below a key support level by a minimum threshold (5-15 ticks depending on signal quality settings)
2. The penetration bar must show strong rejection with at least 30-50% of the candle's range closing back above the swept level
3. Multi-timeframe confirmation checks for structure shift on lower timeframe (break of recent swing high)
4. Confluence scoring system evaluates 7 factors, requiring minimum 3 confirmations:
⦁ Liquidity sweep detected (weighted 2x)
⦁ Higher timeframe bullish market structure
⦁ Lower timeframe bullish break of structure
⦁ Bullish Fair Value Gap presence
⦁ Bullish Order Block formation
⦁ ICT Kill Zone timing alignment
Sell Signal (Buy-Side Liquidity Sweep):
Mirror opposite of buy signal logic, detecting sweeps above resistance levels with bearish rejection.
Risk Management & Position Sizing
Stop Loss Placement:
⦁ Calculated using ATR (Average True Range) multiplied by an adaptive factor
⦁ Base multipliers: Scalping (1.0x), Day Trading (1.5x), Swing Trading (2.0x)
⦁ Further adjusted by signal quality: Conservative (-20%), Balanced (0%), Aggressive (+20%)
⦁ Positioned beyond the liquidity sweep point to avoid re-sweeping
Take Profit Targets:
⦁ TP1: 2.0R (Risk-Reward ratio)
⦁ TP2: 3.5R
⦁ TP3: 5.0R
⦁ All levels rounded to tick precision for accurate order placement
Advanced Features & Filters
Multi-Timeframe Structure Analysis
The system performs top-down analysis across three timeframes:
⦁ Higher Timeframe (HTF): Determines primary trend bias
⦁ Medium Timeframe (MTF): Confirms intermediate structure
⦁ Lower Timeframe (LTF): Identifies precise entry triggers
ICT Kill Zones
Incorporates time-based filtering for optimal trading sessions:
⦁ Asian Session (8PM-12AM UTC)
⦁ London Session (2AM-5AM UTC)
⦁ New York Session (7AM-10AM UTC)
⦁ London Close (10AM-12PM UTC)
Smart Money Concepts Integration
⦁ Fair Value Gaps (FVG): Identifies and displays price inefficiencies that act as magnets
⦁ Order Blocks: Marks institutional accumulation/distribution zones
⦁ Mitigation Detection: Automatically removes FVGs and Order Blocks when price fills them
⦁ Duplicate Sweep Prevention: 10-bar lookback prevents multiple signals at same level
Adaptive Trading Modes
Three pre-configured modes automatically adjust all parameters:
⦁ Scalping: Tight stops, quick targets, 15-minute to 1-hour focus
⦁ Day Trading: Balanced approach, 4-hour to daily analysis
⦁ Swing Trading: Wide stops, extended targets, daily to weekly perspective
⦁ Custom Mode: Full manual control of all parameters
Signal Quality Management
⦁ Conservative: Requires 5/7 confluence factors, tighter sweep threshold (5 ticks), 50% minimum rejection
⦁ Balanced: Standard 3/7 confluence, moderate threshold (10 ticks), 30% rejection
⦁ Aggressive: Only 2/7 confluence needed, wider threshold (15 ticks), 20% rejection
Visual Components & Dashboard
Real-Time Information Panel
Displays current market conditions including:
⦁ Active trading mode and quality settings
⦁ Timeframe configuration (HTF/MTF/LTF)
⦁ Market bias from higher timeframes
⦁ Current kill zone status
⦁ Liquidity sweep detection status
⦁ Confluence scoring for both directions
⦁ Risk parameters and targets
Trade Visualization
⦁ Entry, stop-loss, and three take-profit levels with precise price labels
⦁ Automatic cleanup when targets are hit or new signals appear
⦁ Maximum of one active setup displayed for chart clarity
⦁ Color-coded boxes for Fair Value Gaps and Order Blocks
How to Use This Indicator
Recommended Timeframes
⦁ Scalping Mode: 1-minute to 5-minute charts
⦁ Day Trading Mode: 5-minute to 15-minute charts
⦁ Swing Trading Mode: 1-hour to 4-hour charts
Optimal Market Conditions
⦁ Works best in ranging or trending markets with clear support/resistance levels
⦁ Most effective during high-liquidity sessions (London/New York overlap)
⦁ Avoid using during major news events unless specifically targeting news-driven sweeps
Signal Interpretation
1. Wait for triangle signal (up/down) with confluence score
2. Verify the swept level shown in the dashboard
3. Confirm risk-reward ratios match your trading plan
4. Enter at market or set limit order at indicated entry level
5. Place stop-loss and take-profit orders at displayed levels
Customization Tips
⦁ Adjust Signal Quality based on market volatility (Conservative for volatile, Aggressive for quiet)
⦁ Modify sweep threshold if getting too many/few signals
⦁ Toggle individual liquidity levels based on their relevance to your timeframe
⦁ Use Kill Zone filter for session-specific trading
Risk Disclaimer
This indicator identifies potential trade setups based on liquidity sweep patterns but does not guarantee profitable outcomes. Past performance does not indicate future results. Always use proper risk management and never risk more than you can afford to lose. The indicator should be used as part of a comprehensive trading plan that includes your own analysis and risk tolerance assessment.

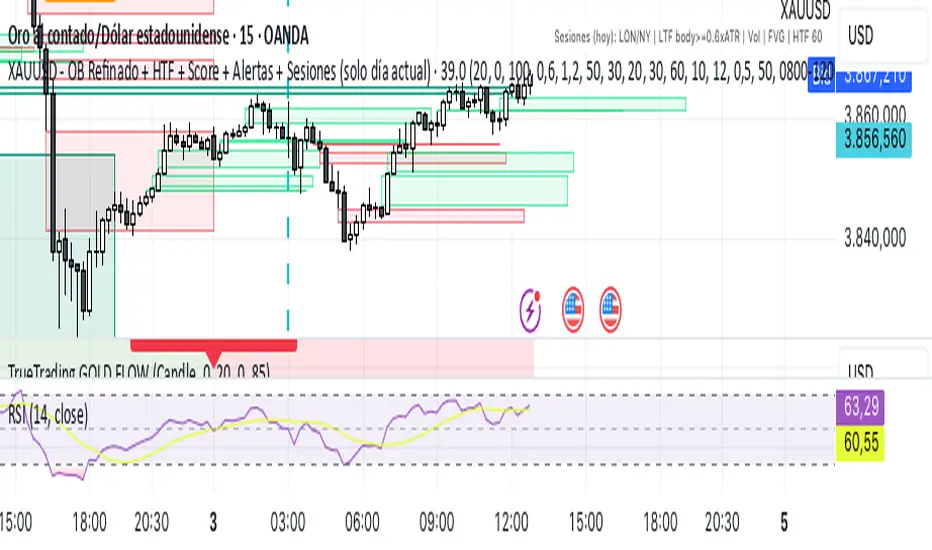
Xauusd DaudenIndicator for XAUUSD that values OB and FVG giving entry points for both purchases and sales in the NY and London sessions
Indicador para XAUUSD que valora los OB y FVG dando puntos de entrada tanto en compras como en ventas en las sesiones de NY y Londres
cd_indiCATor_CxGeneral:
This indicator is the redesigned, simplified, and feature-enhanced version of the previously shared indicators:
cd_cisd_market_Cx, cd_HTF_Bias_Cx, cd_sweep&cisd_Cx, cd_SMT_Sweep_CISD_Cx, and cd_RSI_divergence_Cx.
Within the holistic setup, the indicator tracks:
• HTF bias
• Market structure (trend) in the current timeframe
• Divergence between selected pairs (SMT)
• Divergence between price and RSI values
• Whether the price is in an important area (FVG, iFVG, and Volume Imbalance)
• Whether the price is at a key level
• Whether the price is within a user-defined special timeframe
The main condition and trigger of the setup is an HTF sweep with CISD confirmation on the aligned timeframe.
When the main condition occurs, the indicator provides the user with a real-time market status summary, enriched with other data.
________________________________________
What’s new?
-In the SMT module:
• Triad SMT analysis (e.g.: NQ1!, ES1!, and YM1!)
• Dyad SMT analysis (e.g.: EURUSD, GBPUSD)
• Alternative pair definition and divergence analysis for non-correlated assets
o For crypto assets (xxxUSDT <--> xxxUSDT.P) (e.g.: SOLUSDT.P, SOLUSDT)
o For stocks, divergence analysis by comparing the asset with its value in another currency
(BIST:xxx <--> BIST:xxx / EURTRY), (BAT:xxx <--> BAT:xxx / EURUSD)
-Special timeframe definition
-Configurable multi-option alarm center
-Alternative summary presentation (check list / status table / stickers)
________________________________________
Details and usage:
The user needs to configure four main sections:
• Pair and correlated pairs
• Timeframes (Auto / Manual)
• Alarm center
• Visual arrangement and selections
Pair Selections:
The user should adjust trading pairs according to their trade preferences.
Examples:
• Triad: NQ1!-ES1!-YM1!, BTC-ETH-Total3
• Dyad: NAS100-US500, XAUUSD-XAGUSD, XRPUSDT-XLMUSDT
Single pairs:
-Crypto Assets:
If crypto assets are not in the triad or dyad list, they are automatically matched as:
Perpetual <--> Spot (e.g.: DOGEUSDT.P <--> DOGEUSDT)
If the asset is already defined in a dyad list (e.g., DOGE – SHIB), the dyad definition takes priority.
________________________________________
-Stocks:
If stocks are defined in the dyad list (e.g.: BIST:THYAO <--> BIST:PGSUS), the dyad definition takes priority.
If not defined, the stock is compared with its value in the selected currency.
For example, in the Turkish Stock Exchange:
BIST:FENER stock, if EUR is chosen from the menu, is compared as BIST:FENER / OANDA:EURTRY.
Here, “OANDA” and the stock market currency (TRY) are automatically applied for the exchange rate.
For NYSE:XOM, its pair will be NYSE:XOM / EURUSD.
________________________________________
Timeframes:
By default, the menu is set to “Auto.” In this mode, aligned timeframes are automatically selected.
Aligned timeframes (LTF-HTF):
1m-15m, 3m-30m, 5m-1h, 15m-4h, 1h-D, 4h-W, D-M
Example: if monitoring the chart on 5m:
• 1h sweep + 5m CISD confirmation
• D sweep + 1h CISD confirmation (bias)
• 5m market structure
• 1h SMT and 1h RSI divergence analysis
For manual selections, the user must define the timeframes for Sweep and HTF bias.
FVG, iFVG, and Volume Imbalance timeframes must be manually set in both modes.
________________________________________
Alarm Center:
The user can choose according to preferred criteria.
Each row has options.
“Yes” → included in alarm condition.
“No” → not included in alarm condition.
If special timeframe criteria are added to the alarm, the hour range must also be entered in the same row, and the “Special Zone” tab (default: -4) should be checked.
Key level timeframes and plot options must be set manually.
Example alarm setup:
Alongside the main Sweep + CISD condition, if we also want HTF bias + Trend alignment + key level (W, D) and special timeframe (09:00–11:00), we should set up the menu as follows:
________________________________________
Visual Arrangement and Selections:
Users can control visibility with checkboxes according to their preferences.
In the Table & Sticker tab, table options and labels can be controlled.
• Summary Table has two options: Check list and Status Table
• From the HTF bias section, real-time bias and HTF sweep zone (optional) are displayed
• The RSI divergence section only shows divergence analysis results
• The SMT 2 sub-section only functions when triad is selected
Labels are shown on the bar where the sweep + CISD condition occurs, displaying the current situation.
With the Check box option, all criteria’s real-time status is shown (True/False).
Status Table provides a real-time summary table.
Although the menu may look crowded, most settings only need to be adjusted once during initial use.
________________________________________
What’s next?
• Suggestions from users
• Standard deviation projection
• Mitigation/order blocks (cd special mtg)
• PSP /TPD
________________________________________
Final note:
Every additional criterion in the alarm settings will affect alarm frequency.
Multiple conditions occurring at the same time is not, by itself, sufficient to enter a trade—you should always apply your own judgment.
Looking forward to your feedback and suggestions.
Happy trading! 🎉

RSI MA Cross + Divergence Signal (V2) Core Logic
RSI + Moving Average
The script calculates a standard RSI (default 14).
It then overlays a moving average (SMA/EMA/WMA, default 9).
When RSI crosses above its MA → bullish momentum.
When RSI crosses below its MA → bearish momentum.
Divergence Filter
Signals are only valid if there’s confirmed divergence:
Bullish divergence: Price makes a lower low, RSI makes a higher low.
Bearish divergence: Price makes a higher high, RSI makes a lower high.
Overbought / Oversold Filter
Optional extra:
Bullish signals only valid if RSI ≤ 30 (oversold).
Bearish signals only valid if RSI ≥ 70 (overbought).
This ensures signals happen in “stretched” conditions.
Risk & Trade Management
Entries taken only when all conditions align.
Exits can be managed with ATR stops, partial take-profits, breakeven moves, and trailing stops (we coded these in the strategy version).
Cooldown, session filters, and daily loss guard to keep risk tight.
🔹 Strengths
✅ High selectivity: Combining RSI cross + divergence + OB/OS means signals are rare but higher quality.
✅ Great at catching reversals: Divergence highlights where price may be running out of steam.
✅ Risk management baked in: ATR stops + partial exits smooth out equity curve.
✅ Works across markets: ES, FX, crypto — anywhere RSI divergences are respected.
✅ Flexible: You can loosen/tighten filters depending on aggressiveness.
🔹 Weaknesses
❌ Lag from pivots: Divergence only confirms after a few bars → you enter late sometimes.
❌ Choppy in ranges: In sideways markets, RSI divergences appear often and whipsaw.
❌ Filters reduce signals: With all filters ON (divergence + OB/OS + trend + session), signals can be very rare — may under-trade.
❌ Not standalone: Needs higher-timeframe context (trend, liquidity pools) to avoid counter-trend entries.
🔹 Best Ways to Trade It
Use Higher Timeframe Bias
Run the strategy on 15m/1H, but only trade in direction of higher timeframe trend (e.g., 4H EMA).
Example: If daily is bullish → only take bullish divergences.
Pair With Structure
Look for signals at key zones: HTF support/resistance, VWAP, or FVGs.
Divergence + RSI cross inside an FVG is a strong entry trigger.
Adjust OB/OS for Volatility
For crypto/FX: use 35/65 instead of 30/70 (markets trend harder).
For ES/S&P: 30/70 works fine.
Risk Management Is King
Use partial exits: take profit at 1R, trail rest.
Size by % of equity (we coded this into the strategy).
Avoid News Spikes
Divergences break down around CPI, NFP, Fed announcements — stay flat.
🔹 When It Shines
Trending markets that make extended pushes → clean divergences.
Reversal zones (oversold → bullish bounce, overbought → bearish fade).
Swing trading (15m–4H) — less noise than 1m/5m scalping.
🔹 When to Avoid
Low volatility chop → lots of false divergences.
During high-impact news → RSI swings wildly.
In strong one-way trends without pullbacks — divergence keeps calling tops/bottoms too early.
✅ Summary:
This is a reversal-focused RSI divergence strategy with strict filters. It’s powerful when combined with higher-timeframe bias + structure confluence, but weak if traded blindly in choppy or news-driven conditions. Best to treat it as a precision entry trigger, not a full system — layer it on top of your FVG/ORB framework for maximum edge.

ICT Entry Models (Riz)The ICT Entry Models Indicator is a complete framework built to help traders visualize and apply multiple Institutional concepts on a single chart. Instead of relying on one entry technique, this tool combines 14+ ICT entry models and evaluates them under a unified structure. Each model is detected independently but filtered through a multi-factor confluence engine that considers liquidity, higher-timeframe structure, premium/discount zones, and session context. This ensures only high-probability setups are highlighted.
What This Indicator Does
⦁ Detects and plots ICT-based entry models such as: Fair Value Gaps, Order Blocks, Breakers, Liquidity Grabs, Stop Hunts, Asian Range Breakouts, Silver Bullet setups, Power of Three, Judas Swing, Unicorn model, Market Maker models, Previous Day High/Low breaks, and others.
⦁ Automatically validates entries using higher timeframe confirmation and confluence filters.
⦁ Provides risk management tools with structural stop-loss, ATR-based SL, TP1/TP2 targets, and R:R calculations.
⦁ Displays visual trade labels showing direction, strength, and expected risk/reward.
⦁ Includes a performance dashboard that tracks win rates, session stats, and risk outcomes.
How It Works
Each entry model is activated through custom detection logic. The script checks for key conditions like displacement, imbalance, BOS/CHoCH, liquidity sweeps, and premium/discount zones. When multiple models align, the indicator assigns a signal strength rating.
⦁ Weak setups: Highlighted but marked lower confidence.
⦁ Strong setups: Require confluence of liquidity, structure, and time-based filters (e.g., killzones).
⦁ The indicator then calculates a safe stop-loss placement (always on the correct side of price) and take-profit levels based on Goldbach ratios and volatility expansion.
Inputs
⦁ Model Toggles: Enable/disable individual entry models (e.g., FVG only, OB only, or full confluence).
⦁ Confluence Filters: Higher-timeframe structure, premium/discount zones, volatility thresholds.
⦁ Risk Management Settings: ATR multiplier, fixed SL/TP options, R:R target adjustments.
⦁ Dashboard & Visuals: Choose which stats, labels, and levels appear on chart.
How to Use
1. Apply the indicator to any forex, crypto, or index chart.
2. Select your timeframe. For scalping, use 1–5m with HTF confirmation. For day/swing trades, use 15m–1H with HTF overlays.
3. Toggle your preferred entry models (e.g., FVG + Liquidity Sweep) or enable all for confluence.
4. Watch for strong confluence signals: entry marker + calculated SL/TP + dashboard confirmation.
5. Use the signals as decision support not as automated buy/sell triggers.
Notes & Tips
Best used in liquid markets (Majors, Gold, Indices, BTC/ETH).
HTF confirmation greatly improves accuracy e.g., align 1m entries with 15m structure.
Combining time-based models (Silver Bullet, Killzones) with structural models improves precision.
Disclaimer
This tool is for educational and research purposes only. It is not financial advice, nor does it guarantee profitability. All trading involves risk, and users should test thoroughly before applying live.

Trend FriendTrend Friend — What it is and how to use it
I built Trend Friend to stop redrawing the same trendlines all day. It automatically connects confirmed swing points (fractals) and keeps the most relevant lines in front of you. The goal: give you clean, actionable structure without the guesswork.
What it does (in plain English)
Finds swing highs/lows using a Fractal Period you choose.
Draws auto-trendlines between the two most recent confirmed highs and the two most recent confirmed lows.
Colours by intent:
Lines drawn from highs (potential resistance / bearish) = Red
Lines drawn from lows (potential support / bullish) = Green
Keeps the chart tidy: The newest lines are styled as “recent,” older lines are dimmed as “historical,” and it prunes anything beyond your chosen limit.
Optional crosses & alerts: You can highlight when price closes across the most recent line and set alerts for new lines formed and upper/lower line crosses.
Structure labels: It tags HH, LH, HL, LL at the swing points, so you can quickly read trend/rotation.
How it works (under the hood)
A “fractal” here is a confirmed pivot: the highest high (or lowest low) with n bars on each side. That means pivots only confirm after n bars, so signals are cleaner and less noisy.
When a new pivot prints, the script connects it to the prior pivot of the same type (high→high, low→low). That gives you one “bearish” line from highs and one “bullish” line from lows.
The newest line is marked as recent (brighter), and the previous recent line becomes historical (dimmed). You can keep as many pairs as you want, but I usually keep it tight.
Inputs you’ll actually use
Fractal Period (n): this is the big one. It controls how swingy/strict the pivots are.
Lower n → more swings, more lines (faster, noisier)
Higher n → fewer swings, cleaner lines (slower, swing-trade friendly)
Max pair of lines: how many pairs (up+down) to keep on the chart. 1–3 is a sweet spot.
Extend: extend lines Right (my default) or Both ways if you like the context.
Line widths & colours: recent vs. historical are separate so you can make the active lines pop.
Show crosses: toggle the X markers when price crosses a line. I turn this on when I’m actively hunting breakouts/retests.
Reading the chart
Red lines (from highs): I treat these as potential resistance. A clean break + hold above a red line often flips me from “fade” to “follow.”
Green lines (from lows): Potential support. Same idea in reverse: break + hold below and I stop buying dips until I see structure reclaim.
HH / LH / HL / LL dots: quick read on structure.
HH/HL bias = uptrend continuation potential
LH/LL bias = downtrend continuation potential
Mixed prints = rotation/chop—tighten risk or wait for clarity.
My H1 guidance (fine-tuning Fractal Period)
If you’re mainly on H1 (my use case), tune like this:
Fast / aggressive: n = 6–8 (lots of signals, good for momentum days; more chop risk)
Balanced (recommended): n = 9–12 (keeps lines meaningful but responsive)
Slow / swing focus: n = 13–21 (filters noise; better for trend days and higher-TF confluence)
Rule of thumb: if you’re getting too many touches and whipsaws, increase n. If you’re late to obvious breaks, decrease n.
How I trade it (example workflow)
Pick your n for the session (H1: start at 9–12).
Mark the recent red & green lines. That’s your immediate structure.
Look for interaction:
Rejections from a line = fade potential back into the range.
Break + close across a line = watch the retest for continuation.
Confirm with context: session bias, HTF structure, and your own tools (VWAP, RSI, volume, FVG/OB, etc.).
Plan the trade: enter on retest or reclaim, stop beyond the line/last swing, target the opposite side or next structure.
Alerts (set and forget)
“New trendline formed” — fires when a new high/low pivot confirms and a fresh line is drawn.
“Upper/lower trendline crossed” — fires when price crosses the most recent red/green line.
Use these to track structure shifts without staring at the screen.
Good to know (honest limitations)
Confirmation lag: pivots need n bars on both sides, so signals arrive after the swing confirms. That’s by design—less noise, fewer fake lines.
Lines update as structure evolves: when a new pivot forms, the previous “recent” line becomes “historical,” and older ones can be removed based on your max setting.
Not an auto trendline crystal ball: it won’t predict which line holds or breaks—it just keeps the most relevant structure clean and up to date.
Final notes
Works on any timeframe; I built it with H1 in mind and scale to H4/D1 by increasing n.
Pairs nicely with session tools and VWAP for intraday, or with supply/demand / FVGs for swing planning.
Risk first: lines are structure, not guarantees. Manage position size and stops as usual.
Not financial advice. Trade your plan. Stay nimble.

ICT SIlver Bullet Trading Windows UK times🎯 Purpose of the Indicator
It’s designed to highlight key ICT “macro” and “micro” windows of opportunity, i.e., time ranges where liquidity grabs and algorithmic setups are most likely to occur. The ICT Silver Bullet concept is built on the idea that institutions execute in recurring intraday windows, and these often produce high-probability setups.
🕰️ Windows
London Macro Window
10:00 – 11:00 UK time
This aligns with a major liquidity window after the London equities open settles and London + EU traders reposition.
You’re looking for setups like liquidity sweeps, MSS (market structure shift), and FVG entries here.
New York Macro Window
15:00 – 16:00 UK time (10:00 – 11:00 NY time)
This is right after the NY equities open, a key ICT window for volatility and liquidity grabs.
Power Hour
Usually 20:00 – 21:00 UK time (3pm–4pm NY time), the last trading hour of NY equities.
ICT often refers to this as another manipulation window where setups can form before the daily close.
🔍 What the Indicator Does
Draws session boxes or shading: so you can visually see the London/NY/Power Hour windows directly on your chart.
Macro vs. Micro time frames:
Macro windows → The ones you set (London & NY) are the major daily algo execution windows.
Micro windows → Within those boxes, ICT expects smaller intraday setups (like a Silver Bullet entry from a sweep + FVG).
Guides your trade selection: it tells you when not to hunt trades everywhere, but instead to wait for price action confirmation inside those boxes.
🧩 How This Fits ICT Silver Bullet Trading
The ICT Silver Bullet strategy says:
Wait for one of the macro windows (London or NY).
Look for liquidity sweep → market structure shift → FVG.
Enter with defined risk inside that hour.
This indicator essentially does step 1 for you: it makes those high-probability windows visually obvious, so you don’t waste time trading random hours where algos aren’t active.

智能资金BOS指标“智能资金BOS指标”是一个复杂的主图指标,整合了多种市场分析工具,基于智能资金(Smart Money)理念,分析市场结构(Market Structure)、订单块(OB)、公平价值缺口(FVG)以及溢价/折扣区域
The "Smart Money BOS Indicator" is a complex main chart indicator that integrates multiple market analysis tools. Based on the concept of Smart Money, it analyzes market structure, order block (OB), fair value gap (FVG), and premium/discount areas

Cnagda Liquidit Trading SystemCnagda Liquidit Trading System helps spot where price is likely to trap traders and reverse, then gives simple, actionable Level to entry, place SL, and take profits with confidence. It blends imbalance zones, trend bias, order blocks, liquidity pools, high-probability fake Signal, and context-aware candle patterns into one clean workflow.
🟩🟥 Imbalance boxes: “Crowd rushed, gaps left”
What it is: Green/red boxes mark fast, one-sided moves where price “skipped” orders—think FVG-like zones that often get revisited.
Why it helps: Price frequently pulls back to “fill” these zones, creating clean retest entries with logical stops.
⏩How to use:
Green box = potential demand retest; Red box = potential supply retest. Enter on pullback into box, not on first impulse. Put stop on far side of box and aim first targets at recent swing points.
↕️ Swing bias (HH/HL vs LH/LL): “Which way is the road?”
What it is: Higher-highs/higher-lows = up-bias; Lower-highs/lower-lows = down-bias. system plots Buy/Sell OB levels aligned with that bias.
Why it helps: Trading with the broader flow reduces “hero trades” against institutions. Bias gives clearer entries and cleaner drawdowns.
⏩How to use:
Up-bias: look for long on Buy OB retests. Down-bias: look for short on Sell OB retests. Wait for a small rejection/engulfing to confirm before triggering.
🧱Order blocks: “Where big players remember”
What it is: last opposite-colored candle before an impulsive move—these zones often hold memory and reaction. system plots these as Buy/Sell OB lines.
Why it helps: Many breakouts pull back to the origin. Good entries often happen on retest, not on the breakout chase.
⏩ How to use:
Let price return into the OB, show wick rejection, and decent volume. Enter with stop beyond OB; define risk-reward before entry.
📊Volume coloring: “How Volume is move?”
What it is: Bar color reflects relative volume; inside bars are black. The dashboard also shows Volume and “Volume vs Prev.”
Why it helps: Patterns without volume often fade; volume validates strength and intent of moves.
⏩ How to use:
Favor entries where imbalance/OB/liquidity-grab coincide with higher volume. If volume is weak, reduce size or skip.
🧲 BSL/SSL liquidity pools: “Fishing for stops”
What it is: Equal highs cluster stops above (BSL); equal lows cluster stops below (SSL). system plots these and highlights the nearest one (“magnet”).
Why it helps: Price often sweeps these pools to trigger stops before reversing. This is a prime trap-reversal location.
⏩ How to use:
Watch nearest BSL/SSL. If price wicks through and closes back inside, anticipate a reversal. Trade reaction, not first poke. When price closes beyond, consider that pool mitigated and move on.
🟢🔴 Advanced liquidity grab: “Catch fakeout”
What it is: Bullish grab = makes a new low beyond a prior low but closes back above it, with a long lower wick, small body, and higher volume. Bearish is mirror. Labeled automatically.
Why it helps: It exposes trap moves (stop hunts) and often precedes true direction.
⏩ How to use:
Best when it aligns with a nearby imbalance/OB and supportive volume. Enter on reversal candle break or on retest. Stop goes beyond sweep wick.
🧠 Smart candlestick patterns (only in right place)
What it is: Engulfing, Hammer, Shooting Star, Hanging Man, Doji (with high volume), Morning/Evening Star, Piercing—but marked “effective” only if context (swing/trend/location) agrees.
Why it helps: same pattern in the wrong place is noise; in the right place, it’s signal.
⏩ How to use:
Location first (BSL/SSL/OB/imbalance), then pattern. Treat pattern as trigger/confirmation—one fresh label shows to keep chart clean.
🧭 Dashboard: “Context in a glance”
⏩ Reversal Level: current swing anchor—expect turns or reactions nearby; great for alerts and planning.
⏩ Volume vs Prev + Volume: Strength meter for signal candle—higher adds conviction.
⏩ Nearest Pool: next “magnet” area—look for sweeps/rejections there.
🧩Step-by-step trading flow (with mindset)
⏩ Set bias: HH/HL = long bias, LH/LL = short bias. Counter-trend only on clean sweeps with strong confirmation.
⏩ Find magnet: Check Nearest Pool (BSL/SSL). Focus attention there; it saves screen time.
⏩ Wait for event: Look for a sweep/grab label, or sharp rejection at pool/OB/imbalance. Avoid FOMO.
⏩ Add confluence: Stack 2–3 of these—imbalance box, OB, contextual pattern, supportive volume.
⏩Plan entry: Bullish: trigger above reversal candle high or take retest of FVG/OB. Stop below sweep wick/zone. Target at least 1:1.5–1:2.
Bearish: mirror above.
⏩Manage smartly: Take partials, move to breakeven or trail thoughtfully. Don’t drag stops inside zone out of emotion.
🎛️ Parameter tuning (to reduce human error)
⏩ swingLen: Smaller = faster but noisier; larger = cleaner but slower. Backtest first, then go live.
⏩ Tolerance (ATR or percent): ATR tolerance adapts to volatility (good for fast markets and lower TFs). Start around 0.15–0.30. In calm markets, try percent 0.05–0.15%.
⏩ minBarsGap: Start with 3–5 so equal highs/lows are truly equal—reduces false pools.
❌Common mistakes → ✅ Better habits
⏩Chasing every breakout → Wait for sweep/rejection, then confirm.
⏩Ignoring volume → Validate strength; cut size or skip on weak volume.
⏩Losing history of pools → If reviewing/backtesting, keep mitigated pools visible (dashed/faded).
⏩Over-tight tolerance/too small swingLen → Increases false signals; backtest to find balance.
📝 checklist (before entry)
⏩ Is there a nearby BSL/SSL and did a sweep/grab happen there?
⏩ Is there a close imbalance/OB that price can retest?
⏩ Do we have an effective pattern plus supportive volume?
⏩Is the stop beyond the wick/zone and RR ≥ 1:1.5?
•?((¯°·._.• 🎀 𝐻𝒶𝓅𝓅𝓎 𝒯𝓇𝒶𝒹𝒾𝓃𝑔 🎀 •._.·°¯((?•

ICT OTE (Optimal Trade Entry) IndicatorWhat This Indicator Does:
This is an ultra-clean ICT (Inner Circle Trader) indicator that shows only ONE high-probability signal at a time when multiple confluences perfectly align. It eliminates chart clutter and focuses on the absolute best trading opportunities.
How It Takes Positions:
🔍 Signal Requirements (ALL Must Align):
Market Structure Break - Significant swing high/low break with volume confirmation
Fair Value Gap (FVG) - Large price imbalance/gap (minimum 0.5% size)
Order Block - Institutional supply/demand zone from recent rejection candle
OTE Sweet Spot - Price retraces to 70.5% Fibonacci level (optimal entry zone)
Volume Confirmation - 50% above 50-bar average volume
Rejection Candle - Proper candle formation showing rejection at the level
📊 Position Entry Logic:
BUY Signal Triggers When:
Price breaks above a significant swing high (bullish structure break)
Price retraces back down into a Fair Value Gap or Order Block
Retracement reaches exactly the 70.5% optimal level
Volume spike confirms institutional interest
Rejection candle forms (closes higher than it opened during retracement)
No other signal has been active in the last 50 bars (cooldown system)
SELL Signal Triggers When:
Price breaks below a significant swing low (bearish structure break)
Price retraces back up into a Fair Value Gap or Order Block
Retracement reaches exactly the 70.5% optimal level
Volume spike confirms institutional interest
Rejection candle forms (closes lower than it opened during retracement)
No other signal has been active in the last 50 bars (cooldown system)
⚡ Key Features:
Ultra-Strict Filtering: Only 2-4 signals per month on average (quality over quantity)
One Signal Rule: Only one active signal at a time - no confusion
50-Bar Cooldown: Prevents signal spam and overtrading
Perfect Confluence: Requires 3+ ICT concepts to align simultaneously
Clean Chart: No boxes, lines, or visual clutter - just clear BUY/SELL labels
🎯 Trading Strategy:
Wait for Signal: Large BUY or SELL label appears on chart
Entry: Enter immediately when signal appears (all confluences already confirmed)
Stop Loss: Place beyond the Fair Value Gap or Order Block (typically 1-2% risk)
Take Profit: Target previous swing high/low or major liquidity levels
Risk Management: Only trade when signal appears - no guessing or early entries
💡 Why It Works:
This indicator combines ICT's most powerful concepts (market structure, FVGs, order blocks, optimal retracements) into one confluence-based system. It only signals when institutional money is likely moving, giving you the highest probability entries with minimal noise.
Perfect for: Swing traders, day traders, and anyone wanting clean, high-probability ICT signals without chart clutter.
XAUUSD Strength Dashboard with VolumeXAUUSD Strength Dashboard with Volume Analysis
📌 Description
This advanced Pine Script indicator provides a multi-timeframe dashboard for XAUUSD (Gold vs. USD), combining price action analysis with volume confirmation to generate high-probability trading signals. It detects:
✅ Break of Structure (BOS)
✅ Fair Value Gaps (FVG)
✅ Change of Character (CHOCH)
✅ Trendline Breaks (9/21 SMA Crossover)
✅ Volume Spikes (Confirmation of Strength)
The dashboard displays strength scores (0-100%) and action recommendations (Strong Buy/Buy/Neutral/Sell/Strong Sell) across multiple timeframes, helping traders identify confluences for better trade decisions.
🎯 How It Works
1. Multi-Timeframe Analysis
Fetches data from 1m, 5m, 15m, 30m, 1h, 4h, Daily, and Weekly timeframes.
Compares trend direction, BOS, FVG, CHOCH, and volume spikes across all timeframes.
2. Volume-Confirmed Strength Score
The Strength Score (0-100%) is calculated using:
Trend Direction (25 points) → 9 SMA vs. 21 SMA
Break of Structure (20 points) → New highs/lows with momentum
Fair Value Gaps (10 points) → Imbalance zones
Change of Character (10 points) → Shift in market structure
Trendline Break (20 points) → SMA crossover confirmation
Volume Spike (15 points) → High volume confirms moves
Score Interpretation:
≥75% → Strong Buy (High confidence bullish move)
60-74% → Buy (Bullish but weaker confirmation)
40-59% → Neutral (No strong bias)
25-39% → Sell (Bearish but weaker confirmation)
≤25% → Strong Sell (High confidence bearish move)
3. Dashboard & Chart Markers
Dashboard Table: Shows Trend, BOS, Volume, CHOCH, TL Break, Strength %, Key Level, and Action for each timeframe.
Chart Markers:
🟢 Green Triangles → Bullish BOS
🔴 Red Triangles → Bearish BOS
🟢 Green Circles → Bullish CHOCH
🔴 Red Circles → Bearish CHOCH
📈 Green Arrows → Bullish Trendline Break
📉 Red Arrows → Bearish Trendline Break
"Vol↑" (Lime) → Bullish Volume Spike
"Vol↓" (Maroon) → Bearish Volume Spike
🚀 How to Use
1. Dashboard Interpretation
Higher Timeframes (D/W) → Show the dominant trend.
Lower Timeframes (1m-4h) → Help with entry timing.
Strength Score ≥75% or ≤25% → Look for high-confidence trades.
Volume Spikes → Confirm breakouts/reversals.
2. Trading Strategy
📈 Long (Buy) Setup:
Higher TFs (D/W/4h) show bullish trend (↑).
Current TF has BOS & Volume Spike.
Strength Score ≥60%.
Key Level (Low) holds as support.
📉 Short (Sell) Setup:
Higher TFs (D/W/4h) show bearish trend (↓).
Current TF has BOS & Volume Spike.
Strength Score ≤40%.
Key Level (High) holds as resistance.
3. Customization
Adjust Volume Spike Multiplier (Default: 1.5x) → Controls sensitivity to volume spikes.
Toggle Timeframes → Enable/disable higher/lower timeframes.
🔑 Key Benefits
✔ Multi-Timeframe Confluence → Avoids false signals.
✔ Volume Confirmation → Filters low-quality breakouts.
✔ Clear Strength Scoring → Removes emotional bias.
✔ Visual Chart Markers → Easy to spot key signals.
This indicator is ideal for gold traders who follow institutional order flow, market structure, and volume analysis to improve their trading decisions.
🎯 Best Used With:
Support/Resistance Levels
Fibonacci Retracements
Price Action Confirmation
🚀 Happy Trading! 🚀

smcCore Positioning
A comprehensive trading tool integrating trend tracking, price action, and Smart Money Concepts (SMC). Suitable for multiple assets like cryptocurrencies and forex, it specializes in scalping and swing trading, directly usable on the TradingView platform.
Key Features
Trend Identification
Supertrend: Generates buy/sell signals (🚀 for long, 🐻 for short) when price crosses the trend channel, indicating trend direction.
Cirrus Cloud: Green denotes bullish trends, red for bearish trends, visually reflecting trend strength.
Market Structure Analysis
Identifies BOS (Break of Structure) and CHoCH (Change of Character) to mark short-term (internal structure) and long-term (swing structure) price turning points.
Order Blocks (OB) & Fair Value Gaps (FVG): Highlights institutional capital concentration zones and price gaps, signaling potential support/resistance levels.
Risk Management
Automatically calculates 3 take-profit levels (TP1-TP3) and 1 stop-loss (SL), dynamically adjusted based on ATR. Specific prices and lines are displayed on the chart.
Auxiliary Tools
ADX Indicator: Judges trend strength; purple marks sideways ranges (low signal reliability).
Multi-timeframe compatibility: Optimized for 15-minute charts to adapt to high volatility in cryptocurrencies, with adjustable parameters to filter noise.
Use Cases
Scalping: Combine 15-minute FVG fills and order block breakouts for quick entries/exits.
Swing Trading: Leverage trend cloud + structure breakout signals to capture medium-term trends.
Suitability: Ideal for traders comfortable with short-term volatility and basic technical analysis.
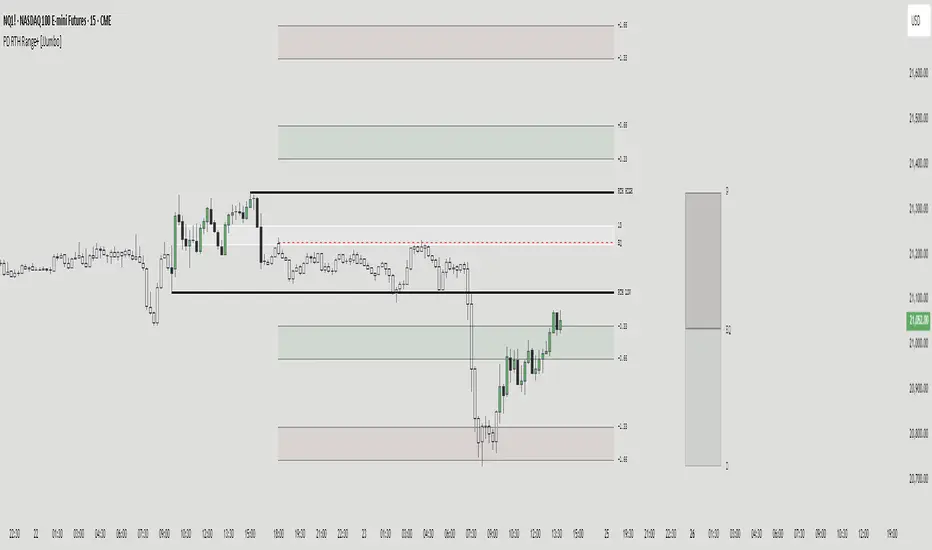
PD RTH Range+ [JJumbo]Introduction:
The PD RTH Range+ indicator is a powerful tool designed to visualize and track previous day and previous day's Regular Trading Hours (RTH) ranges for futures markets. This indicator identifies and plots automatically key price levels established during standard US trading hours (9:30 AM - 4:15 PM ET "RTH") and Globex hours, helping traders identify important key levels and fair value zones.
Just like my other time based range indicator "SDRange+" it works around the same idea but with a different context and different ranges in use, range deviations are still a big part in this framework.
Key features:
Range functions and plot modes:
This tool is equipped with two modes "RTH" range and "Previous day" range, which help you visualize previous day's points of interest and swing high and low essentially helping you framing the current day's daily candle in relation to previous day ranges both RTH and previous day.
Projections feature:
The projection feature in the tool also has two plot modes "Fixed" and "Custom", the Fixed mode projections make use of the rule of thirds (just like the SDRange+) but with two areas 0.33-0.66 and 1.33-1.66, here is where most deviations happen and price exhausts above/below the range.
These are your actionable areas to expect price lose momentum and retrace back into the range.
Dynamic Premium&Discount visualization:
This feature will allow you to identify fair value and equilibrium at current price dynamically updating until out projections or levels have been met and and swing high/low has formed, helping you identify the equilibrium of the market at the current state and where premium or discounted prices are.
Automatic First presentation Fair Value Gap:
A concept idea originated from The Inner Circle Trader (ICT), the feature in the indicator will automatically plot the first presented fair value gap (first FVG present of Regular trading hours) dynamically changing time-frame as well, showing the first presented FVG in any time frame you are visualizing.
This can be used as you area of action as well or targets (during RTH hours).
ETH (Eletronic Trading Hours) candles transparency:
This feature is important for define ETH and RTH hours, removing the color out of the the ETH hours candles helping visualize better the RTH hours, which is where you want base your trading day on.
Customizable inputs:
Fully customizable aesthetics in the input menu
How can traders use this framework and tool effectively in their trading:
Trading range sequences:
This framework is based on IF-THEN statements sequences, it will generate your daily bias by following the sequences.
Sequences: EQ > high/low, high/low > EQ,EQ > fixed projections, fixed projections >EQ.
When following these sequences, you will easily find you daily direction, which are also data-backed by statistics (you can see about it in my X profile, you will find the link in my Trading View profile)
Trading retracements/reversals:
Retracements are often taken from the projections areas until Equilibrium of the dynamic premium and discount feature in the indicator, often participating in the moves to fair value from the deviation of the range.
Reversals are often taken from the projections areas until opposing levels of the range (EQ or high/low)
Terms & Conditions
Our charting tools are products provided for informational and educational purposes only and do not constitute financial, investment, or trading advice. Our charting tools are not designed to predict market movements or provide specific recommendations. Users should be aware that past performance is not indicative of future results and should not be relied upon for making financial decisions. By using our charting tools, the purchaser agrees that the seller and the creator are not responsible for any decisions made based on the information provided by these charting tools. The purchaser assumes full responsibility and liability for any actions taken and the consequences thereof, including any loss of money or investments that may occur as a result of using these products. Hence, by purchasing these charting tools, the customer accepts and acknowledges that the seller and the creator are not liable nor responsible for any unwanted outcome that arises from the development, the sale, or the use of these products. We hold no reimbursement, refund, or chargeback policy. Once these Terms and Conditions are accepted by the Customer, before purchase, no reimbursements, refunds or chargebacks will be provided under any circumstances.
By continuing to use these charting tools, the user acknowledges and agrees to the Terms and Conditions outlined in this legal disclaimer.
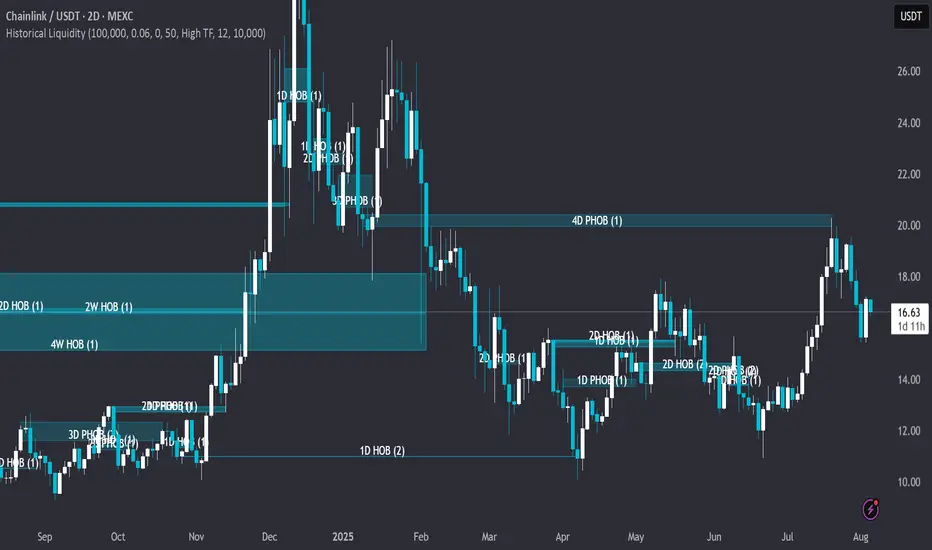
Historical LiquidityHistorical Liquidity Indicator – Backtesting Mitigated Hidden Order Blocks
🟠OVERVIEW: Historical Liquidity Indicator This script is a powerful backtesting tool and companion to our "Hidden Liquidity Indicator." It visualizes mitigated liquidity zones that have already been touched by price action. By showing a historical record of these events, it allows traders to systematically analyze past market structure, evaluate the effectiveness of liquidity zones, and refine their mitigation-based trading strategies.
🟠CORE LOGIC: The Connection to Hidden Liquidity The indicator's core logic is built upon the same proprietary methodology as our "Hidden Liquidity Indicator," which focuses on the relationship between Fair Value Gaps (FVGs) and candle bodies. The central idea is to identify institutional footprints—specifically, where hidden order blocks form—before the price revisits and "mitigates" them.
The process involves two main steps:
1. Detection of Liquidity Zones: The script identifies and classifies a liquidity zone based on specific, rule-based criteria:
o Hidden Order Block (HOB): A strong zone where a candle body fits 100% inside a Fair Value Gap, and is untouched by any wicks. For an HOB to be considered valid, its equilibrium (midpoint) must be crossed by the FVG.
o Partial Hidden Order Block (PHOB): A weaker, but still significant, zone where a candle body fits at least 50% inside the FVG.
2. Tracking Mitigation: The indicator then continuously tracks these detected zones. A zone is considered mitigated when a subsequent candle's wick or body touches or enters at least 50% of that zone.
Once a zone is detected and subsequently mitigated according to these rules, the indicator stores this information and visualizes it historically on the chart. This allows traders to see exactly where and how these hidden liquidity zones influenced past price action.
🟠SETTINGS & CUSTOMIZATION The indicator offers extensive customization to adapt to various trading styles and analysis needs.
• General & Candle Settings:
o Show Partial HOB: Toggle the visibility of Partial Hidden Order Blocks (PHOBs).
o Candle back count: Determines the number of historical bars to be analyzed.
o BB Deviation / BB Min Size Perc: These settings allow for fine-tuning the underlying volatility calculation, which helps in identifying the specific conditions for HOB formation.
o Partial Min Size in FVG Perc: Customizes the percentage (default 50%) required for a candle body to be considered a PHOB.
• Multi-Timeframe (MTF) Analysis: The indicator can check for liquidity zones on different timeframes. Users can select from pre-defined Low, Mid, or High Timeframe sets, or customize which specific timeframes are checked for analysis (e.g., 5m, 15m, 1h, 4h, 1D).
• Color & Visualization:
o HOBs and PHOBs: Users can customize the distinct colors for each type of liquidity zone.
o Box Border: Option to display or hide the border around the detected zones.
o Labels: Customize the color and text size of the labels describing each zone.
🟠PURPOSE & USAGE This indicator is specifically designed for systematic backtesting and strategic development. It is not intended to provide live trading signals. Its value lies in:
• Quantifying Success: It enables traders to measure the success rate of different HOB types across various timeframes and market conditions.
• Post-Mitigation Analysis: Users can analyze price behavior after a mitigation event, e.g., whether it led to continuation, reversal, or a retest.
• Identifying Support/Resistance: It helps to identify historical support and resistance levels that were formed by previously respected liquidity blocks, offering a data-driven alternative to traditional S/R methods.
🟠WHY IT MATTERS This indicator transforms subjective order block analysis into an objective, data-driven process. By providing a clear, visual history of which liquidity zones were actually respected or invalidated by the market, it empowers traders to build and validate their strategies on a foundation of empirical evidence rather than on intuition alone.
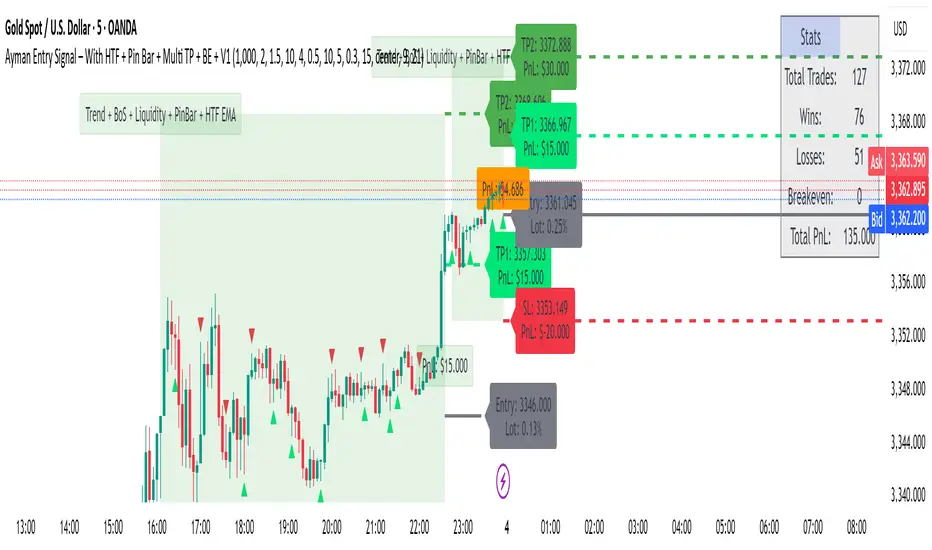
AymaN Entry Signal – With HTF + Pin Bar + Multi TP + BE + V1Ayman Entry Signal – Indicator Description
Overview
Ayman Entry Signal – With HTF + Pin Bar + Multi TP + BE + Stats Panel (V1)
This is a professional-grade Pine Script indicator designed for scalping and intraday trading, with full trade management, multi-confirmation logic, and advanced visualization. The tool is ideal for traders focused on XAUUSD (Gold), Forex, and other volatile instruments who seek both precision entries and structured exits with dynamic risk control.
Main Features
Advanced Entry Logic:
- EMA fast/slow crossovers (configurable)
- Optional conditions: Break of Structure (BoS), Order Block (OB), Fair Value Gap (FVG), Liquidity sweeps, Pin Bars
- HTF confirmation using EMA or BoS
- Real-time entry condition display
Trade Management:
- Dynamic calculation of Entry, SL (with ATR buffer), TP1, TP2
- Supports Partial Close and Break Even logic after TP1
- Visual PnL label (dynamic and color-coded)
Statistics Panel:
- Shows total trades, win/loss/breakeven count, cumulative PnL
- Filter by custom date or session
- Fully customizable panel appearance
Trade Visualization:
- Trade box includes all trade levels (Entry, SL, TP1, TP2)
- Visual display of trade conditions and PnL result
- Option to keep previous trades on chart
Alert System:
- Alerts for Buy and Sell entries
- Compatible with webhook automation systems like MT5/MT4
Customization & Inputs
- Capital & risk per trade
- Value per pip/point
- SL buffer (ATR-based)
- Manual EMA override
- Enable/disable: EMA, BoS, OB, FVG, Liquidity, Pin Bars
- HTF: timeframe + confirmation logic
- Trade box/labels visibility
- Full color customization
- PnL label position: top, center, or bottom
Recommended Use
- Ideal for Gold scalping (XAUUSD), also effective for Forex
- Best on 1m–15m charts; use HTF confirmation from 15m–4H
- Pairs well with semi-automated systems using alerts and webhooks
Disclaimer
Note: This is a non-executing indicator. It does not place trades but provides visual and statistical guidance for professional manual or semi-automated trading.

EURUSD Kill Zone [Plazo Sullivan Roche Capital]EUR/USD Kil Zone
Core Logic: Navigating the New‑York Kill‑Zone
The EUR/USD Killzone is designed to exploit repeatable patterns that occur during the overlap of the London and New‑York trading sessions. Research shows that the New‑York “kill zone”—roughly 07:00–09:00 EST—produces the most dramatic moves in EUR‑ and USD‑linked currency pairs
During this window, large institutions often sweep out liquidity resting above or below the Asian and early‑London session extremes , triggering sharp reversals before a new intraday trend emerges. This is in contrast to the single pre-market sweeps occuring for GOLD/
This modeul uses ICT/Smart Money Concepts to read these patterns and waits for three confirmations before signalling a trade:
Liquidity Sweep & Rejection. Price must spike beyond the combined Asian and early‑London range and then reject that area (a sharp wick and opposite‑coloured candle), signalling that stops have been cleared. The module defines the Asian range from 00:00–05:00 EST and the London range from 02:00–05:00 EST, following the guideline that overlapping sessions produce the greatest volatility
Market Structure Break. It then waits for the 5‑minute price to close beyond the most recent swing high/low (pivot), confirming that a genuine shift in order flow has occurred rather than a simple stop‑run.
Fair‑Value‑Gap (FVG) Re‑Test. Upon the break, the script records the high and low of that 5‑minute “displacement” candle and defines a fair‑value gap—the imbalance between buyers and sellers. Rather than entering immediately, it sets a virtual limit order at the 50 % level of this gap. A trade is only triggered once price retraces to this mid‑point, providing a high‑probability, high‑reward entry.
These three filters help avoid common pitfalls when trading kill zones, such as false breakouts and news‑driven whipsaws. The indicator also monitors higher‑timeframe bias (4‑hour and daily charts) using 50‑ and 200‑period moving averages to gauge whether the intraday signal aligns with the broader trend.
Feature Set
The indicator provides a suite of visual and analytical tools to support disciplined trading:
Session Range Mapping: automatically draws the Asian (00:00–05:00 EST) and London (02:00–05:00 EST) session highs and lows, making it easy to see when price sweeps these levels.
Kill‑Zone Monitoring: a built‑in timer isolates the 07:30–09:00 EST window and limits the indicator to one trade per session to avoid over‑trading.
Pivot‑Break Detection: uses 5‑minute swing highs/lows to confirm that order flow has shifted before looking for entries.
Fair‑Value‑Gap Re‑test: defines an FVG from the displacement candle and waits for a 50 % retrace before triggering a signal. This improves risk‑to‑reward by entering at a discount (for longs) or premium (for shorts).
Higher‑Timeframe Dashboard: displays bullish/bearish/neutral biases on the 4‑hour and daily charts, plus a confidence rating (0–2) indicating how many of these timeframes agree with the signal direction.
Alerts: optional alerts can be configured for buy‑only, sell‑only or either‑direction signals.
Best Practices for Use
Align with Major Volatility Windows. The indicator is most effective during the New‑York kill zone. Avoid trading outside this window, and be aware of high‑impact news (e.g., FOMC announcements) that can distort price action
Check Higher‑Timeframe Bias. Use the dashboard to ensure the intraday signal aligns with the 4‑hour and daily trends. For instance, a long signal that aligns with a bullish daily bias carries higher conviction than one going against it.
Manage Risk Responsibly. Even with multiple filters, no strategy is foolproof. Use stop‑loss orders just beyond the liquidity sweep and size positions appropriately.
Combine with Fundamental Awareness. Check your economic calendar for European and U.S. data releases. If an important release occurs during the kill zone, consider standing aside or reducing risk.
Back‑test and Forward‑Test. Always validate the strategy across different market conditions and broker feeds. Pay attention to how spreads, volatility and news events influence the indicator.
Use as Part of a Toolkit. Consider combining the indicator with other confirmation tools such as momentum oscillators, volume analysis or price‑action patterns to refine entries further. Smart‑Money Concepts often use confluence, not a single signal.
What's in It for You?
The EUR/USD Liquidity Sweep Indicator distils institutional concepts—liquidity hunts, market‑structure shifts and fair‑value gaps—into an intuitive, automated tool. By waiting for a retrace into the displacement candle’s imbalance, it helps capture trades where risk‑to‑reward is skewed strongly in your favour. The dashboard encourages you to trade with the higher‑timeframe trend, and built‑in alerts ensure you never miss an opportunity.
In volatile kill‑zone environments, discipline and patience are vital. This indicator enforces both: it tracks session ranges, confirms structure, waits for a retrace, and triggers only when multiple conditions align. Coupled with sound risk management and your own judgement, it can become a cornerstone of a high‑probability trading plan.
Always remember that markets evolve. Continue to refine the indicator and your strategy as you gather more experience and data. The learning journey never ends, but this tool is designed to accelerate it.

Ayman Entry Signal – With HTF + Pin Bar
A professional and versatile trading indicator combining classic technical analysis with Smart Money Concepts to detect high-probability entry points.
Designed especially for scalping gold and forex pairs on lower timeframes. Fully customizable to suit any trading style.
✅ Key Features:
EMA Trend Confirmation
Break of Structure (BoS) Detection
Order Block Zone Recognition
Fair Value Gap (FVG) Confirmation
Liquidity Sweep Detection
Pin Bar Candlestick Confirmation
Higher Timeframe Confirmation (HTF EMA + HTF BoS)
🎯 Smart Risk Management:
Automatically calculates Stop Loss (SL) and Take Profit (TP) based on the selected timeframe.
Dynamically adjusts lot size based on account capital and risk percentage.
📈 How It Works:
The indicator triggers a Buy or Sell signal only when a selected set of conditions are met, including:
Trend direction (EMA crossover)
Break of structure
Presence within strong supply/demand zones
Confirmation from higher timeframe
Reversal Pin Bar pattern
🛎 Alerts:
Built-in alert system notifies you instantly when a valid Buy or Sell signal is triggered.
⚙️ Customizable Settings:
Risk Percentage
Capital Size
HTF timeframe
Enable/Disable individual filters (EMA, BoS, OB, FVG, Liquidity, Pin Bar, HTF)
📌 Best Timeframes:
1-min, 5-min, and 15-min – especially during high-volume sessions like London or New York.
🔸 Note:
This is not financial advice. Always backtest and use manual confirmations before live trading.
Midnight 30min High/LowMidnight 30min High/Low — Overnight Liquidity Range Tracker
Capture the Overnight Session: A Strategic Level Identification Tool from Professional Trading Methodology
This indicator captures the high and low prices during the critical 30-minute midnight session (12:00-12:30 AM EST) and projects these levels forward as key support and resistance zones. These overnight ranges often contain significant liquidity and serve as crucial reference points for intraday price action, representing areas where institutional activity may have established important levels.
🔍 What This Script Does:
Identifies Critical Overnight Session Levels
- Automatically detects the 12:00-12:30 AM EST session window
- Captures the highest and lowest prices during this 30-minute period
- Projects these levels forward for multiple trading days
Creates Dynamic Support/Resistance Zones
- Extends midnight high/low levels as horizontal lines with customizable projection periods
- Fills the area between high and low to create a visual trading range
- Updates automatically each trading day with new overnight levels
Provides Clear Visual Reference Points
- Optional session start markers (●) highlight when the midnight session begins
- Color-coded lines distinguish between high and low levels
- Transparent fill area creates an easy-to-identify trading zone
Real-Time Level Tracking
- Updates levels in real-time during the active midnight session
- Maintains historical levels for reference and backtesting
- Compatible with data window for precise level values
⚙️ Customization Options:
Extend Days (1-30):** Control how many days forward the levels are projected (default: 5 days)
High Line Color:** Customize the midnight high line color (default: blue)
Low Line Color:** Customize the midnight low line color (default: orange)
Fill Color:** Adjust the transparency and color of the range area (default: light aqua, 80% transparency)
Show Session Markers:** Toggle yellow session start indicators on/off (default: enabled)
💡 How to Use:
Deploy on lower timeframes (1m-15m) for precise level identification and reaction monitoring**
Watch for key price interactions:
- Rejection at midnight high levels (potential resistance)
- Bounce from midnight low levels (potential support)
- Range-bound trading between the high and low levels
Combine with liquidity concepts:
- Monitor for stop hunts above/below these levels
- Look for false breakouts that snap back into the range
- Use as confluence with other ICT concepts like FVGs and Order Blocks
Strategic Applications:
- Range trading between midnight levels
- Breakout confirmation when price closes decisively outside the range
- Support/resistance validation for entry and exit planning
🔗 Combine With These Tools for Complete Market Structure Analysis:
✅ First FVG — Opening Range Fair Value Gap Detector.
✅ ICT Turtle Soup (Liquidity Reversal)— Spot stop hunts and false breakout scenarios
✅ ICT Macro Zones (Grey Box Version)- It tracks real-time highs and lows for each Silver Bullet session
✅ ICT SMC Liquidity Grabs and OBs- Liquidity Grabs, Order Block Zones, and Fibonacci OTE Levels, allowing traders to identify institutional entry models with clean, rule-based visual signals.
Together, these tools create a comprehensive Smart Money Concepts (SMC) framework — helping traders identify, anticipate, and capitalize on institutional-level price movements with precision and confidence during critical overnight sessions.

Mohammad - OBs, BOS, S/R, Elliott Waves & Trend LinesProfessional Trading Indicator System - Technical Analysis Suite
Overview
Advanced technical analysis system integrating ICT/SMC methodologies with classical analysis tools. Features seven analytical components for comprehensive market structure analysis.
Components
1. Order Blocks (ICT/SMC)
Identifies institutional accumulation/distribution zones acting as future support/resistance.
Detection: Automatic identification based on price rejection patterns
Management: Dynamic updates and removal of invalidated blocks
Configuration: Sensitivity levels (High/Medium/Low), ATR-based parameters
Visual: Green support, red resistance with transparency
2. Break of Structure (BOS)
Detects significant structural breaks indicating trend changes.
Method: 5-bar swing point formation
Display: White horizontal lines with labels
Range: 50-bar maximum lookback
3. Support & Resistance
Classical horizontal levels from significant price pivots.
Analysis: 300-bar historical scan
Filter: 10-point duplicate tolerance
Display: Maximum 15 levels within 5% of current price
4. Fair Value Gaps (FVG)
Price inefficiencies that often get filled on return.
Types: Bullish gaps (up) and bearish gaps (down)
Size: Minimum 0.1 ATR or 5 points
Management: Auto-removal when filled
5. Elliott Wave Analysis
Advanced pattern recognition for impulse and corrective waves.
Patterns: 5-wave impulse (1-2-3-4-5), 3-wave corrective (A-B-C)
Adaptive: Auto-adjusts to timeframe (3-10 depth range)
Display: Small dots with large numbers, starts from hidden point 0
6. 45-Degree Momentum Lines
Revolutionary projection system based on consecutive candle sequences.
Bearish Lines (Red):
Trigger: 5+ consecutive red candles
Start: HIGH of first red candle
Labels: B1-B5
Bullish Lines (Green):
Trigger: 5+ consecutive green candles
Start: LOW of first green candle
Labels: T1-T5
Specifications:
Angle: 45° using ATR * 0.15
Extension: 30 bars forward
Display: 5 most recent patterns
7. Classical Trend Lines
Multi-touch diagonal support/resistance detection.
Validation: Minimum touch requirements
Tolerance: ATR-based touch detection
Display: Blue lines with optional labels
Configuration Summary
Global Settings:
Show/hide each component individually
Customizable colors and line widths
Label size options
Performance:
50-bar periodic cleanup
Maximum object limits (500 each)
Conditional processing on bar close
Trading Applications
Scalping: Order Blocks + FVGs + 45° Lines
Day Trading: All components with BOS emphasis
Swing Trading: Elliott Waves + Trend Lines
Position Trading: Major levels + Elliott Waves
Key Strategies:
Use 45° line bounces for entries
Combine Order Blocks with 45° lines for confluence
Confirm BOS breaks with 45° line violations
Place stops beyond projection lines
Technical Requirements
Platform: TradingView Pine Script v5
Minimum: 300 historical bars
Optimal: 15m-4H timeframes
Performance: Moderate CPU usage
Color Scheme
Green: Bullish/Support (#26a69a)
Red: Bearish/Resistance (#ef5350)
White: BOS/S&R lines
Blue: Elliott Waves/Trend Lines
Customizable: 45° projection lines
Risk Disclaimer
Educational tool only. Not financial advice. Combine with risk management and personal analysis. Past performance doesn't guarantee future results. Trading involves substantial risk.
