ZynIQ Order Block Master Pro v2 - (Pro Plus Pack)Overview
ZynIQ Order Block Master Pro v2 identifies areas where price showed strong displacement and left behind significant zones of interest. It highlights potential reaction areas, continuation blocks and mitigation zones based on structural behaviour and directional flow.
Key Features
• Automatic detection of bullish and bearish order block zones
• Optional refinement filters for higher-quality zones
• Displacement-aware logic to reduce weak signals
• Optional mitigation markers when price revisits a zone
• Configurable sensitivity for different markets and timeframes
• Clean labels and minimal chart clutter
• Complements structure, liquidity and FVG tools
Use Cases
• Highlighting key reaction areas based on previous strong moves
• Tracking potential continuation or reversal zones
• Combining order blocks with BOS/CHOCH and liquidity mapping
• Building confluence with breakout or volume tools
Notes
This tool provides contextual price zones based on displacement and structural movement. It is not a standalone trading system. Use with your own confirmation and risk management.
Cari dalam skrip untuk "fvg"

ZynIQ Liquidity Master Pro v2 - (Pro Pack)Overview
ZynIQ Liquidity Master v2 (Pro) identifies key liquidity pools and sweep zones using automated swing logic, equal-high/low detection and multi-level liquidity mapping. It provides a clear view of where liquidity may be resting above or below price, helping traders understand potential sweep or mitigation behaviour.
Key Features
• Automatic detection of EQH/EQL (equal highs/lows)
• Mapping of major swing liquidity zones
• Optional PDH/PDL (previous day high/low) and weekly levels
• Detection of potential liquidity sweep areas
• Clean labels for swing points and liquidity clusters
• Configurable sensitivity for different markets or timeframes
• Lightweight visuals with minimal clutter
Use Cases
• Identifying major liquidity pools above or below price
• Spotting potential sweep conditions before reversals
• Anchoring market structure or FVG tools with liquidity context
• Understanding where price may target during expansion moves
Notes
This tool identifies areas of resting liquidity based on swing and equal-high/low logic. It is not a standalone trading system. Use with your preferred confirmation and risk management.

ZynIQ Market Structure Master v2 - (Pro Pack)Overview
ZynIQ Market Structure Master v2 (Pro) maps structural shifts in price action using automated BOS/CHOCH detection, swing analysis and directional flow. It provides a clear view of when the market transitions between expansion, pullback and reversal phases.
Key Features
• Automated BOS (Break of Structure) and CHOCH detection
• Swing high/low mapping with optional filtering
• Directional flow logic for identifying trend vs reversal phases
• Optional EQ levels and mitigation markers
• Configurable structure sensitivity for different timeframes
• Clean labels and minimal clutter for fast interpretation
• Suitable for intraday and swing structure analysis
Use Cases
• Identifying key structural shifts in trend
• Spotting early reversal signals via CHOCH
• Assessing trend continuation vs distribution/accumulation
• Combining structure with liquidity, FVG or breakout tools
Notes
This tool provides structural context using break-of-structure and swing logic. It is not a trading system by itself. Use alongside your own confirmation and risk management.

CS Institutional X-Ray (Perfect Sync)Title: CS Institutional X-Ray
Description:
CS Institutional X-Ray is an advanced Order Flow and Market Structure suite designed to reveal what happens inside Japanese candles.
Most traders only see open and close prices. This indicator utilizes VSA (Volume Spread Analysis) algorithms and Synthetic Footprint Logic to detect institutional intervention, liquidity manipulation, and market exhaustion.
🧠 1. The Mathematical Engine: Synthetic Footprint
The core of this indicator is not based on moving average crossovers, but on market physics: Effort vs. Result.
The script scans every candle and calculates:
Buy/Sell Pressure: Analyzes the close position relative to the total candle range and weights it by volume.
Synthetic Delta: Calculates the net difference between buyer and seller aggression.
Volume Anomalies: Detects when volume is abnormally high (Institutional) or low (Retail).
The Absorption Logic: The indicator hunts for divergences between candle color and internal flow.
Example: If price drops hard (Red Candle) with massive volume, but the close moves away from the low, the algorithm detects that massive LIMIT orders absorbed the selling pressure. Result: Institutional Buy Signal.
📊 2. The Institutional Semaphore (Visual Guide)
The indicator automatically recolors candles to show the real state of the auction:
🔵 CYAN (Whale Buy): Bullish Absorption. Institutions buying aggressively or absorbing selling pressure at support.
🟣 MAGENTA (Whale Sell): Bearish Absorption. Institutions selling into strength or stopping a rally with sell walls.
⚪ GREY (Exhaustion/Zombie): "No-Trade" Zone. Volume is extremely low. The movement lacks institutional backing and is prone to failure.
🟢/🔴 Normal: Market in equilibrium.
🛡️ 3. Smart Zone System (Market Memory)
The indicator draws and manages Support and Resistance levels based on volume events, not just pivots.
Virgin Zones (Bright): When a "Whale" appears, a solid line is projected. If price has not touched it again, it is a high-probability bounce zone.
Automatic Mitigation: The exact moment price touches a line, the indicator detects the mitigation. The line turns Grey and Dotted, and the label dims. This keeps the chart clean, showing only what is relevant now.
☠️ 4. Manipulation Detector (Liquidity Grabs)
The system distinguishes between a normal reversal and a "Stop Hunt".
Signal: ☠️ GRAB
Logic: If price breaks a previous Low/High to sweep liquidity and closes with an absorption candle (Whale), it is marked as a "Grab." This is the system's most powerful reversal signal.
🧱 5. FVG with Liquidity Score
The indicator draws Fair Value Gaps (Imbalances) and assigns them a volume score.
"Vol: 3.0x": Indicates that the gap was created with 3 times the average volume, making it a much stronger price magnet than a standard FVG.
🚀 How to Trade with CS Institutional X-Ray
Identify the Footprint: Wait for a Cyan or Magenta candle to appear.
Validate the Trap: If the signal comes with a "☠️ GRAB" label, the probability of success increases drastically.
The Retest (Entry): Do not chase price. Place a Limit order on the generated Zone Line or at the edge of the FVG.
Management: Use opposite zones or mitigated zones (grey) as Take Profit targets.
Included Settings:
Fully configurable Alerts for Whales, Grabs, and Retests.
Total customization of colors and styles.

Prime-Time × Vortex (3/6/9) — Ace (clean v3)1️⃣ Prime-Time Index (PT)
A bar becomes Prime-Time when the count satisfies the formula:
4·n − 3 is a perfect square
This generates the sequence:
1, 3, 7, 13, 21, 31, 43, 57, 73, 91, …
These are time windows where price is more likely to form:
Shifts in market structure
Impulses
Reversals
Liquidity expansions
These PT bars are drawn as small circles above the candle.
If labels are enabled, the counter value (n) is also shown.
2️⃣ Vortex 3/6/9 Digital-Root Timing
Every bar also has a digital root, calculated from the counter:
If n → digitalRoot(n) = 3, 6, or 9,
the bar is considered a Vortex bar.
These moments often align with:
Swing highs / swing lows
Micro shifts
Mini-reversals
Minor liquidity grabs
When a Prime-Time bar is also a 3/6/9 bar → high-probability timing.
These bars are highlighted in green by default.
3️⃣ Filters & Display
You can customize:
Anchor time → when counting begins
Reset daily → restart counter each new trading day
Show only 3/6/9 → hides normal PT hits
Label offset → distance above the candle
Color themes
This makes the indicator usable on:
1Min
5Min
15Min
1H
Any timeframe you want
4️⃣ How To Apply It in Trading
Use it as a time confluence tool, not a signal generator.
✔ Best ways to use:
Look for MSS, sweeps, OB retests, FVG reactions when
they occur on or near a Prime-Time or 3/6/9 bar
Expect volatility increases after PT bars
Use 3/6/9 hits to anticipate internal turning points
Combine with:
Session High/Low
Killzones (London, NYO, PM)
Purge Protocol
MMXM Execution
✔ Example:
If price sweeps a level and prints a 3/6/9 vortex bar inside a PT window →
you have a very strong timing alignment for reversal.
5️⃣ Simple Summary
Feature Meaning
Prime-Time Hit (PT) Major time window where price often shifts
3/6/9 Vortex Bar Micro-timing for internal swings
PT + 3/6/9 together High-probability timing for entries
Reset Daily Perfect for intraday models like NYO & London
Anchor Time Defines the entire cycle structure

CRT MTF + HTF Candles - Milana TradesCRT MTF + HTF Candles is an educational tool that helps you visualize higher-timeframe CRT and HTF candles on your intraday chart
The script automatically tracks key HTF levels and shows three types of CRT events:
1. Pending CRT
When a higher-timeframe candle breaks the previous high or low, the indicator marks this as a “pending” CRT.
This helps you see potential liquidity grabs and where price is currently trapped inside the HTF range
2. Completed CRT
A CRT becomes “completed” when price reaches the opposite side of the previously broken level
3. Invalid CRT
If price closes outside the HTF range before completion, the CRT is marked as invalid.
This helps you identify failed breaks and possible reversals.
Multi-Timeframe HTF Candles
The script draws clean higher-timeframe candles directly on your lower timeframe chart.
Each candle includes:
Body and wicks
HTF open & close
Swing high/low markers
Timeframe labels
Optional timers (showing time remaining in the candle)
Optional imbalances (FVG / volume imbalance)
Optional Midpont line (0.5)
HTF candle spacing
You can adjust candle width, spacing, and alignment so HTF candles fit nicely over lower-TF bars.
Gaps & Imbalances
The tool can highlight:
Fair value gaps
Volume imbalance
Swing Sweep line
When price tried update swing but closed inside the candle cange
Equlibrium line (Midpoint 0.5)
Timeframe tags & timers
Shows clear labels for each HTF candle
You can choose which timeframes to show (1H, 2H, 4H, Daily, etc.) and how many candles should be displayed
Trade smart, stay disciplined, and keep improving every day
Enjoy :)

MM Trap Reversal System [TradeHawk]MM TRAP REVERSAL SYSTEM by Timmy741
The only indicator that doesn't just show arrows — it gives you the full battle plan.
Detects real Market Maker stop hunts (liquidity sweeps) and tells you exactly:
WHAT TO DO → BUY / SELL / WAIT
WHEN TO ENTER → Exact trigger candle
WHERE TO ENTER → Current close (or better on pullback)
WHERE YOUR STOP GOES → ATR or wick-based
YOUR TARGETS → 1:2, 1:3, 1:4+ calculated automatically
CONFIDENCE → Filtered by volume, trend, chop, overextension
NO TRADE ZONES → When to stay the hell out (this saves accounts)
FEATURES
• Real swing high/low breach + rejection detection
• Strong wick requirement (default 50%+ of candle)
• Volume confirmation option
• Smart filters: kills trades in chop, low volume, overextended moves
• ADX + VWAP + deviation filters
• Full risk:reward calculation per trade
• Clean trade instruction panel (no clutter)
This is the system professional prop traders use to catch reversals after stop runs.
Works on all markets: Forex, Stocks, Futures, Crypto
Best on 15m – 4H timeframes
No repainting | No future leak | No magic
Just pure price action + liquidity concepts.
Released under MPL 2.0 — fully open source because real traders share the real stuff.
#mmtrap #stophunt #liquidity #reversal #smartmoney #ict #orderblock #fairvaluegap #fvg #propfirm #proptrading #reversalsystem

Support Line [by rukich]🟠 OVERVIEW
The indicator displays a floating line that acts as a support level. It's important to remember that any support level can be broken.
🟠 COMPONENTS
The indicator is based on the percentage difference between the closes of the n-th bar back and the current bar. The resulting percentage is smoothed to remove noise.
The indicator is displayed as a green-red line (the colors don’t carry meaning — they are used just for visual variety). When the price touches the support level, the bar background turns green.
For convenience, there is a label on the right side of the indicator showing the current value of the line.
🟠 HOW TO USE
The indicator includes several settings that can be adjusted, though optimal defaults are provided.
Settings:
Timeframe — specifies which timeframe’s data is used to calculate the line.
Candles back — specifies how many bars back from the current one are used.
The indicator should be used according to general support-zone logic. Since no support zone guarantees a price bounce, the optimal approach is to confirm the reaction after the price touches the line.
Example of use:
In the current example, the Timeframe in the indicator settings is set to 1 hour, and the currently open chart is 5 minutes. This means that on the 5-minute chart we see a 1-hour line. After the price touches the support line, you need to see a confirmation of the reaction to understand whether the support zone is holding the price.
In the examples, reaction confirmation is shown through: the formation of an M5 shift and the invalidation of an FVG M5- (the latter is more risky than the M5 shift):
🟠 CONCLUSION
The indicator shows a floating support zone, and when tested, you should confirm the reaction on a lower timeframe.

4H EMA 21/30 Cloud on 15mThis indicator displays the 4-hour EMA 21 and EMA 30 as a dynamic cloud directly on the 15-minute chart, providing a clean and reliable higher-timeframe trend filter for intraday and scalping setups.
The cloud turns:
Green when EMA21 > EMA30 → bullish HTF trend
Red when EMA21 < EMA30 → bearish HTF trend
Because the 4H EMA 21/30 combination tracks mid-term momentum and trend structure extremely well, this indicator helps traders avoid counter-trend trades, time pullbacks more effectively, and align entries with dominant higher-timeframe flow.
Perfect for traders using:
Price Action
FVG / Imbalance concepts
CHOCH/BOS structure
Liquidity-based models
ICT-style intraday execution
Use the 4H cloud as your HTF bias anchor, and execute trades using your own entry model on the 15m timeframe.

Ryan Liquidity Hunt Algo Premium Liquidity Hunt Algo — detects institutional swing liquidity, order blocks, and premium/discount zones.
Shows auto-drawn swing boxes, liquidity lines (daily/weekly/monthly), FVG gaps, and optional OI/volume filters to highlight high-probability areas — designed for clear structure-based trade decisions and visual clarity.

Forex Sessions [Fax Academy]Forex Sessions — Precision Session Mapping for Professional Traders
Overview
Highlights the four major FX sessions — Sydney, Tokyo, London, New York — directly on your chart.
Kill Zones: high-impact windows around the session open (default 10 minutes).
Timezone-aware with full DST support — sessions that cross midnight shade correctly.
Engineered for clean intraday context, overlap visibility, and professional session-based execution.
What It Shows
Kill Zones — bold-tinted windows around each session's open.
Full Session Shading — lighter background for the entire active window.
London–New York Overlap highlight for maximum-liquidity hours.
Inputs
Timezone
Exchange • UTC • Europe/London • America/New_York • Asia/Tokyo • Australia/Sydney
Use Exchange to automatically align with instrument time.
Per-Session Controls for Sydney, Tokyo, London, New York:
Kill Zone toggle + custom minutes (default 10)
Full Session toggle
Start/End hour (24h format)
How To Use
Set the Timezone first — regional options auto-adjust for DST (London/New York).
Enable Kill Zones to expose opening-volatility spikes and liquidity sweeps.
Tune session hours to match your broker if schedules differ from the global standard.
Watch the London–NY overlap for directional moves, breakouts, and trend continuation.
Practical Tips
Intraday Bias : Favor setups inside or shortly after Kill Zones that align with higher-timeframe structure.
Overlap Hours : Often produce the day’s key breakout/continuation legs.
Combine with:
EMA — pullback precision inside session windows.
FVG — imbalance-based entries during high-liquidity periods.
Defaults
Kill Zones: 10 minutes at each session open.
Full sessions: standard global FX windows (fully adjustable).
Color scheme: bold tint for Kill Zones, subtle tint for session ranges.
Notes
Non-repainting — all shading is based on confirmed chart bars.
Works on any instrument and any timeframe.
If a session’s opening bar is missing (holiday/limited trading), shading is automatically skipped.
Brand
Built by Fax Academy to elevate timing, clarity, and execution in the FX markets.
For educational and analytical use only — always validate with backtesting and disciplined risk management.

Josh FXJoshFX Multi-Timeframe Levels & Fair Value Gap Indicator
This powerful TradingView indicator provides a comprehensive view of key market levels and trends across multiple timeframes. Designed for traders who want precise entries and market context, it includes:
Previous Daily Levels: Automatically marks the previous day’s High, Low, and 50% midpoint.
Multi-Timeframe Trend: Displays the trend direction for 5-minute, 15-minute, 1-hour, and 4-hour charts directly on your current chart.
Daily Candle Display: Shows the current daily candle for quick visual reference.
Pivot Points: Accurately marks technical highs and lows (pivot points) to the exact unit on the chart.
Fair Value Gaps (FVGs): Highlights areas of imbalance for potential high-probability trade setups.
JoshFX Telegram Watermark: Includes branding for the JoshFX community.
This all-in-one tool is perfect for traders combining price action, liquidity concepts, and multi-timeframe analysis to find high-quality setups efficiently.

Arkham ORB Indicator 3.815-Minute ORB Breakout Indicator with Volume Confirmation & Dynamic Risk Management
This closed-source indicator identifies high-probability breakout opportunities during the New York session open (8:30-9:30 AM ET) using a systematic Opening Range Breakout methodology combined with volume validation and adaptive volatility-based risk management.
Core Methodology - How It Works
Opening Range Framework
The indicator establishes the Opening Range by tracking the high and low of the first 15 minutes of the trading session (8:30-8:45 AM ET). This range represents the initial price discovery zone where early participants establish equilibrium. Breakouts above the high or below the low signal potential directional moves as liquidity enters the market during the full NY session.
Volume-Based Breakout Validation
To distinguish genuine breakouts from false moves, the indicator employs a rolling volume analysis system. It calculates a 12-period median of volume and applies a 1.2x threshold multiplier. Only price movements accompanied by volume exceeding this threshold are flagged as valid breakout signals. This approach filters out low-conviction breakouts that often occur in choppy, low-participation conditions and significantly reduces false signals at ORB levels.
Adaptive Volatility-Based Stop Loss Calculation
Unlike fixed-point stop losses, this indicator uses a dynamic calculation based on a 10-day lookback of historical ORB ranges. The stop loss is derived by analyzing recent Opening Range sizes and applying a 0.5x multiplier to the average. This creates three key advantages:
Compression adaptation: When recent ORBs shrink (low volatility), stops automatically tighten to reduce risk exposure
Expansion adaptation: When recent ORBs expand (high volatility), stops widen to prevent premature exits on legitimate moves
Hybrid intelligence: The system detects outlier volatility days by comparing current ORB size to the 10-day average. When divergence exceeds 50%, it recognizes abnormal conditions and adjusts stop placement accordingly rather than blindly using historical averages
Multi-Entry Risk Framework
The indicator recognizes that different traders enter at different points relative to the ORB level. It provides simultaneous risk calculations for three entry strategies:
Direct ORB Entry (0-point offset): Immediate breakout entries at the ORB high/low
Pullback Entry 1 (default 5.5 points): Conservative entries waiting for initial retracements
Pullback Entry 2 (default 11.0 points): Deeper retest entries for very conservative approaches
Each entry type displays independently calculated metrics (stop loss distance, contract sizing, take profit levels) that account for the actual entry point's distance from the ORB level. This ensures accurate position sizing and risk/reward ratios regardless of which entry method you use.
Smart Volatility Detection & Alerts
The indicator continuously compares the current day's ORB size against the 10-day historical average. When divergence exceeds a configurable threshold (default 50%), it alerts you to abnormal market conditions:
Compression warnings: When today's ORB is 50%+ smaller than average (potential low-volatility trap)
Expansion warnings: When today's ORB is 50%+ larger than average (potential news event or unusual volatility)
This allows you to adjust expectations and position sizing based on whether current conditions match your backtested historical environment.
Risk Management Safeguards
Min/Max Stop Loss Caps
To prevent extreme stop placements in unusual conditions:
Minimum stop: 35 points (prevents overly tight stops that get hit by noise)
Maximum stop: 75 points (caps risk exposure during extreme volatility events)
Both caps are fully adjustable and can be toggled on/off
Contract Rounding & Risk Display
The indicator automatically rounds to whole contracts and displays real-time risk metrics including:
Suggested stop loss level (adjusted for entry offset + volatility)
Number of contracts (sized to your account risk parameters)
Suggested take profit level (maintains your configured risk/reward ratio)
Dollar risk and potential profit for each entry type
What Makes This Original
This indicator combines several methodological elements that work together as a cohesive risk management system:
Volume confirmation prevents trading every ORB breakout indiscriminately
Adaptive volatility stops ensure your risk scales with current market conditions, not fixed assumptions
Multi-entry framework provides accurate calculations for various entry styles without requiring separate indicators
Outlier detection warns when today's conditions deviate significantly from your backtested norms
Integrated position sizing removes the mental math from determining contracts and risk/reward
Rather than simply plotting ORB levels or using fixed stops, this system adapts to changing volatility while validating breakouts with participation metrics.
How to Use It
Apply to a 5-minute chart of futures instruments (optimized for MNQ/NQ)
Set your account risk parameters in settings (account size, risk per trade %)
Monitor the ORB formation period (8:30-8:45 AM ET) - levels will be drawn
Watch for breakout signals during 8:45-9:30 AM ET with volume confirmation
Choose your entry style from the three displayed options based on your risk tolerance
Use the suggested stops and targets from the real-time risk table
Pay attention to volatility warnings - adjust position sizing if conditions are abnormal
Fully Customizable Settings
All parameters used in the indicator's calculations are user-adjustable, allowing you to adapt the system to your trading style and risk tolerance:
ORB Configuration
ORB formation period start/end times
Entry offset distances (Entry 1 and Entry 2 point values)
Display toggles for each entry type
Volume Analysis
Volume lookback period (default: 12)
Volume multiplier threshold (default: 1.2x)
Toggle volume filtering on/off
Stop Loss Calculation
Historical lookback period (default: 10 days)
Stop loss multiplier (default: 0.5x)
Calculation method: Historical Average, Current Day ORB, or Hybrid
Minimum stop cap (default: 35 points)
Maximum stop cap (default: 75 points)
Toggle min/max caps on/off
Volatility Alerts
Divergence threshold for outlier detection (default: 50%)
Alert display toggles
Risk Management
Account size
Risk percentage per trade
Risk/reward ratio for take profit calculations
Display Options
Table positions and sizes (compact mode)
Color schemes
Show/hide individual components
This flexibility allows you to backtest different parameter combinations and optimize the indicator for current market conditions or your specific trading approach. You are in full control of the calculations - the indicator simply automates the math based on your inputs.
Ideal For
Futures traders (MNQ/NQ) seeking a systematic, rule-based approach to NY session open breakouts with pre-calculated risk parameters that automatically adapt to changing market volatility. Particularly useful for traders who want to eliminate emotional decision-making around stop placement and position sizing.
Important Disclaimers
No Financial Advice
This indicator is provided for educational and informational purposes only. It does not constitute financial advice, investment advice, trading advice, or any other sort of advice. You should not treat any of the indicator's content, outputs, or signals as such. The author is not a licensed financial advisor.
Risk Warning
Trading futures and derivatives involves substantial risk of loss and is not suitable for all investors. Past performance of any trading system or methodology is not necessarily indicative of future results. You should carefully consider whether trading is appropriate for you in light of your experience, objectives, financial resources, and other relevant circumstances.
No Performance Guarantees
While this indicator is designed to identify high-probability setups based on historical analysis, there is no guarantee of profitable results. Market conditions change, and what worked in backtesting may not work in live trading. Due to the leveraged nature of futures trading, losses can significantly exceed your initial investment.
Use at Your Own Risk
All trading decisions made based on this indicator are your sole responsibility. The author assumes no responsibility for your trading results, losses, or any damages resulting from the use of this indicator. Always use proper risk management and never risk more than you can afford to lose.
Backtesting vs. Live Trading
Results generated from backtesting may not reflect actual trading performance due to factors including but not limited to: slippage, commissions, market liquidity, emotional decision-making, and differences between historical and real-time data.
Not a Guarantee of Accuracy
While efforts have been made to ensure the indicator functions as described, no software is perfect. You are responsible for verifying the indicator's calculations and outputs before making any trading decisions.

Daily Weekly Highs & LowsOverview
This indicator automatically plots the previous day’s and previous week’s Highs and Lows, giving you instant clarity on the most important market liquidity levels. These levels often act as magnets for price and serve as key decision zones for intraday and swing traders.
Whether you're looking for liquidity sweeps, breakout confirmations, or simple bias alignment — this tool gives you an immediate visual edge.
Features
Precise anchoring from HH/LL
Lines begin exactly at the previous High/Low with no delays or offsets, ensuring clean and accurate structure visualization.
Visual breakout detection
The indicator highlights where price has broken above or below the previous day/week levels, helping you instantly spot liquidity grabs and market intent.
How It Works
Automatically detects the previous day’s High/Low.
Automatically detects the previous week’s High/Low.
Plots clean horizontal levels starting from the original HH/LL point.
Monitors price in real time and marks the exact candle that breaks the level.
Optionally highlights sweeps or simple breaks, depending on your trading style.
How to Use
Use previous day High/Low for intraday bias, liquidity sweeps, and breakout plays.
Use previous week High/Low for swing bias and higher-timeframe liquidity targets.
Combine breaks with your entry model (FVG, BOS/CHOCH, displacement, etc.).
Watch for fakeouts (liquidity sweeps) followed by reversal signals on lower timeframes.
Monitor alert notifications to avoid staring at the chart all day.
Alerts
Receive notifications the moment price interacts with key levels:
Previous Day High Break
Previous Day Low Break
Previous Week High Break
Previous Week Low Break
(Alerts trigger exactly at the level break — no repainting.)

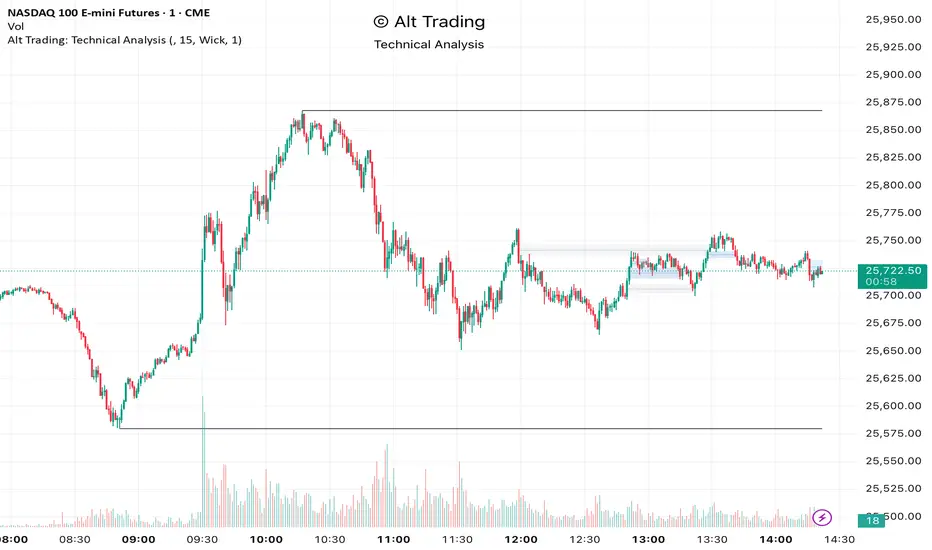
Alt Trading: Technical Analysis
A streamlined, high-quality indicator that displays the essential intraday levels. It highlights the Current Day High/Low (CDH/CDL), Previous Day High/Low (PDH/PDL), Current Week High/Low (CWH/CWL), and the most recent Fair Value Gaps (FVGs or iFVGs) on any selected timeframe—providing clear structural context for informed intraday decision-making.
BifaneiroSinaleiro V3 ULTIMATEBifaneiroSinaleiro V3 ULTIMATE - Complete ICT Analysis System & Signal Generator
This isn't just an indicator - it's your 24/7 ICT analyst that does the manual work for you.
━━━━━━━━━━━━━━━━━━━━━━━━━━━━━━━━━━━━━━
🔥 WHAT IT DOES FOR YOU:
━━━━━━━━━━━━━━━━━━━━━━━━━━━━━━━━━━━━━━
✅ Marks ALL ICT Concepts Automatically:
- Fair Value Gaps (LTF + HTF with priority)
- Market Structure (BOS/CHoCH in real-time)
- Breaker Blocks (validated with volume + killzone)
- Liquidity Sweeps (Asian High/Low runs)
- Premium/Discount Arrays + OTE Zones
- Institutional Sessions (London, NY Silver Bullets)
✅ Advanced Pattern Recognition:
- Turtle Soup (sweep + reversal)
- Unicorn Model (sweep → BOS → FVG)
- SMT Divergences (monitors correlated pairs)
- PO3/AMD Phases (Accumulation → Manipulation → Distribution)
✅ Intelligent Scoring System:
- 12+ confluence factors analyzed
- Minimum score 12 for signals (configurable)
- Score 20+ = EXTREME (enables 2nd trade in session)
- Visual score display on every signal
✅ Professional Trade Management:
- 1 trade per session (London, NY AM, NY PM) = max 3/day
- EXTREME mode: 2 trades per session = max 6/day
- Automatic stop loss (session range-based)
- Dynamic take profit (score-adjusted multiplier)
- Auto breakeven after 2.5x move
- EOD close (23:59) with P&L label
- Weekend close (Fri 23:55) with P&L label
✅ 100% ICT Pure Methodology:
- NO EMAs, NO ATR, NO lagging indicators
- Pure price action: High/Low/Range only
- HTF confirmation via Premium/Discount (not EMAs!)
- Stop loss via Asian Range (not ATR!)
━━━━━━━━━━━━━━━━━━━━━━━━━━━━━━━━━━━━━━
⚡ WHY IT'S DIFFERENT:
━━━━━━━━━━━━━━━━━━━━━━━━━━━━━━━━━━━━━━
Traditional indicators show 1-2 concepts. This shows 10+ simultaneously.
Manual ICT takes 2-3 hours per session. This does it in milliseconds.
Other systems guess. This scores with objective confluence.
You save hours daily. You trade better. You profit more consistently.
━━━━━━━━━━━━━━━━━━━━━━━━━━━━━━━━━━━━━━
📊 WHAT YOU GET:
━━━━━━━━━━━━━━━━━━━━━━━━━━━━━━━━━━━━━━
- Real-time dashboard (scores, confluences, structure)
- Precision signals (only in killzones, only with confluences)
- Trade tracking (win rate, RR, P&L by session)
- Multi-timeframe analysis (automatic)
- News block filter (configurable)
- Full customization (colors, thresholds, sessions)
- Comprehensive alerts (8+ types)
Works on: Forex, Indices, Commodities, Crypto
Best on: 1m-5m for execution, 15m+ for swing
Timezone: Configured for CET (UTC+1), easily adjustable
⚠️ This is a professional tool requiring ICT/SMC understanding.
Not magic - it's methodology, automated.
🚀 Stop drawing. Start trading. Add to chart now.

(CRT) MTF Candle Range Theory Model# 🚀 **CASH Pro MTF – Candle Range Theory (CRT) Indicator**
**The Smart Money ICT Setup Detector** 🔥
Hey Traders!
Here is the **ultimate Pine Script indicator** that automatically detects one of the most powerful Smart Money / ICT setups: **Candle Range Theory (CRT)**
---
### What is Candle Range Theory – CRT?
**CRT** is a high-probability price action model based on **liquidity grabs** and **range expansion**.
Price loves to:
1️⃣ Raid the low/high of the previous candle (take stop-losses)
2️⃣ Then reverse and run to the opposite side of the range (or beyond)
When this happens near a **key higher-timeframe level**, magic happens!
### Bullish CRT Model
- Price touches a **strong HTF support**
- Previous candle closes near that support
- Next candle **sweeps the low** (grabs liquidity)
- Current candle **closes above the raided low AND breaks the high** of the sweep candle
**Result → Aggressive bullish move expected!**
**Entry:** On close above the high (or on retest + MSS)
**Stop Loss:** Below the swept low
**Take Profit:** CRT High or next liquidity pool
### Bearish CRT Model
- Price touches a **strong HTF resistance**
- Previous candle closes near resistance
- Next candle **sweeps the high** (grabs buy stops)
- Current candle **closes below the raided high AND breaks the low** of the sweep candle
**Result → Strong bearish expansion!**
**Entry:** On close below the low
**Stop Loss:** Above the swept high
**Take Profit:** CRT Low or next downside liquidity
This whole setup can form in **just 3 candles**… or sometimes more if price consolidates after the sweep.
---
### Why This Indicator is Special
This is **NOT** a simple 3-candle pattern scanner!
This is a **true CRT + MTF confluence beast** with:
- **Multi-Timeframe Confirmation** (default 4H – fully customizable)
- **Built-in RSI Filter** (avoid fake moves in overbought/oversold)
- **Day-2 High/Low Levels** automatically drawn (the exact CRT range!)
- **Clean “LONG” / “SHORT” labels** right on the candle (no ugly arrows or offset)
- **Background highlight** on signal
- **Fully grouped inputs** – super clean settings panel
---
### Features at a Glance
| Feature | Included |
|--------------------------------|----------|
| Higher Timeframe Confirmation | Yes |
| RSI Overbought/Oversold Filter | Yes |
| Day-2 High/Low Lines + Labels | Yes |
| Clean Text Signals (no offset) | Yes |
| Background Highlight | Yes |
| Fully Customizable Colors & Text| Yes |
| Works on All Markets & TFs | Yes |
---
### How to Use
1. Add the indicator to your chart
2. Wait for a **LONG** or **SHORT** label to appear
3. Confirm price is near a **key HTF level** (order block, FVG, etc.)
4. Enter on close or retest (your choice)
5. Manage risk with the drawn Day-2 levels
**Pro Tip:** Combine with ICT Market Structure Shift (MSS) or Fair Value Gaps for even higher accuracy!

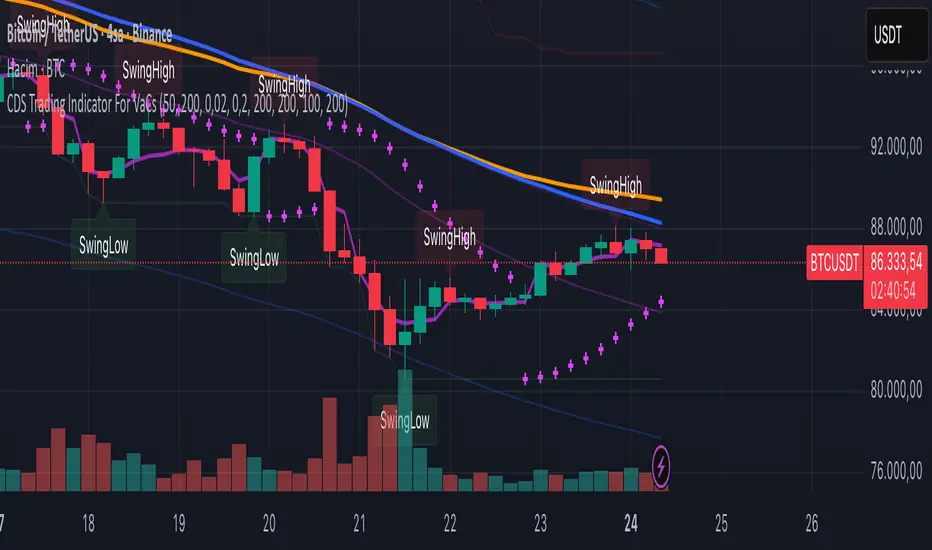
VaCs, Trade Indic## 🎛 **MAIN PRICE CHART (Primary Panel)**
Overlay on the main candlestick chart:
* 200 EMA + 50 EMA trend ribbons
* Parabolic SAR
* Logarithmic Growth Curves (LGC / LGH)
* Stock-to-Flow (S2F) bands
* Linear, Log, and Polynomial Regression Channels
* Liquidity mapping:
* Buyside liquidity
* Sellside liquidity
* Fair Value Gaps (FVG)
* Order Blocks
* Imbalance Zones
* Smart Money Concepts (SMC):
* HH, HL, LH, LL structure
* BOS (Break of Structure)
* CHOCH (Change of Character)
* Whale Accumulation Layers:
* Wallet cohorts (1–10 / 10–100 / 100–1K / 1K–10K)
* Whale inflow/outflow
* Exchange net positions
* On-chain macro layers:
* NUPL
* MVRV
* SOPR
* Realized price bands
* Miner Position Indicator
* Hash Ribbons
* Market cycle markers:
* Halving cycles
* Accumulation, Markup, Distribution, Markdown phases
* Fundamental macro overlays:
* Fed interest rate events
* CPI releases
* ETF inflow/outflow markers
* Major global news catalysts
---
## 📊 **SUB-PANEL #1 — Momentum Oscillators**
Add a clearly separated lower panel containing:
* MACD (standard)
* RSI (14) **with divergence lines**
* Stochastic RSI
* MFI (Money Flow Index)
This panel must be independent and **not overlayed** on the main chart.
---
## 📊 **SUB-PANEL #2 — Volume & Flow Analytics**
A second independent lower panel showing:
* Volume Profile
* On-Balance Volume (OBV)
* **VWAP** (Volume Weighted Average Price)
* Must be clean, visible, and used for trend confirmation
* Use logic equivalent to TradingView Pine Script v6 **ta.vwap()**
* Represents a stable VWAP line across the full dataset
* Funding Rate
* Open Interest (OI)
* CVD (Cumulative Volume Delta)
---
## 📊 **SUB-PANEL #3 — On-Chain Analytics Panel**
Add a dedicated panel for:
* Exchange inflow/outflow
* Miner flow
* Realized profits vs realized losses
* Stablecoin Supply Ratio (SSR)
* Any high-frequency on-chain volatility signals
---
Checklist Trade-Setup (TRAIVEND)
This tool professionalizes your trade execution and ensures maximum discipline in the market. It serves as a visual reassurance to minimize emotional errors and objectify the trading process.
Benefits for your trading:
Prevention of Overtrading & Revenge Trading:
You only trade when your criteria are met. No checkmarks mean no trade. This filter forces patience, protects your capital from impulsive decisions born of boredom or frustration, and ensures you only take valid setups.
Objectivity instead of Uncertainty:
Through clearly defined criteria (e.g., MSS, FVG, Liq-Sweep), you eliminate hesitation before entry. The decision is no longer based on feelings, but on facts. Once the checklist is confirmed, you have clear permission for execution.
Psychological Stability within the Trade:
In volatile phases, glancing at the checklist helps maintain calm. It visually reminds you that the entry was rule-compliant. This strengthens trust in the setup and prevents you from closing positions too early out of fear.
How it works:
This is a manual overlay tool designed for process optimization. Up to 10 individual criteria can be defined via the settings and validated using checkboxes. There is no automatic signaling; the tool serves strict adherence to one's own trading rules (Compliance).

ICT Macro w/ AlertsWhat it does :
- Highlights the exact 20-minute ICT Macro windows (09:50–10:10, 10:50–11:10, etc.) in real New York time
- One-click “ALL xx:50–xx:10 every hour” mode for London, Asian, or full-day trading
- Optional orange background + black “ICT MACRO” label
- Powerful alert functions that only fire from Sunday 6:00pm to Friday 5:00 PM EST.
How to use it as a perfect filter:
1) Add this script to your chart
2) Add your main strategy (FVG, Order Block, Silver Bullet, etc.)
3) Create alert on your main strategy → in the condition dropdown choose
“Inside Active ICT Macro”
Result: dramatically higher win rate because you only trade when institutions are most active.

ZOBAKAFXAI – SMART STRUCTURE CLEAN MODE V4.1 (Gold Edition)ZOBAKAFXAI – Institutional Smart Structure (Gold Edition) is an advanced, professional trading indicator built for traders who want to trade with clarity, structure, and precision.
This indicator is designed around Smart Money Concepts (SMC) and Institutional Market Structure, helping traders clearly see where the market is trending, where liquidity sits, and where high-probability trading opportunities exist.
Unlike traditional indicators, this tool focuses on price action behavior, structure shifts, and institutional-style logic rather than lagging signals.
🔥 WHAT THIS INDICATOR DOES
This indicator automatically detects and plots:
• Break of Structure (BOS)
• Change of Character (CHOCH)
• Swing Highs and Swing Lows
• Order Blocks
• Breaker Blocks
• Fair Value Gaps (FVG)
• Institutional Premium / Discount Zones
• Trend-based market direction
Everything is displayed in a clean, minimal, and gold-themed interface for easy chart reading.
✅ WHO THIS INDICATOR IS FOR
This tool is perfect for:
• Forex traders
• Gold (XAUUSD) traders
• Indices traders
• Crypto traders
• Funded account traders
• Beginners who want structure
• Advanced traders who want precision
It works perfectly on:
✓ MT4/MT5 chart analysis
✓ TradingView Web & Mobile
✓ Low and high timeframes
⚙ HOW TO USE
• Wait for structure confirmation (BOS or CHOCH)
• Trade from Premium zones (for sells)
• Trade from Discount zones (for buys)
• Follow the trend direction
• Use proper risk management
This indicator is a decision-support tool, not a magic system.
⚠ RISK DISCLAIMER
This indicator is for educational and analysis purposes only.
Trading involves risk.
Past results do not guarantee future performance.
Always use stop loss and proper risk management.
📲 COMMUNITY & SUPPORT
Join our community for updates and support:
👉 t.me
© ZOBAKAFXAI
All rights reserved.

NeuraEdge ORB Professional Opening Range Breakout Indicator-15m🚀 NeuraEdge ORB - Professional Opening Range Breakout Indicator
We're excited to release this clean, effective Opening Range Breakout (ORB) indicator for the trading community. The 15-minute ORB is one of the most time-tested intraday strategies, and we've built this tool to make it simple and actionable.
━━━━━━━━━━━━━━━━━━━━━━━━━━━━━━━━━━━━━━━━━━━━━━━━━━━━
📖 WHAT IS THE 15-MINUTE ORB STRATEGY?
The Opening Range Breakout strategy captures the initial price range established in the first 15 minutes of market open (9:30-9:45 AM ET). This range often sets the tone for the trading day, as institutional order flow and overnight gap reactions play out during this window.
The concept is simple:
- Mark the HIGH and LOW of the first 15 minutes
- Trade the breakout when price breaks above or below this range
- Use the opposite side of the range as your stop loss
━━━━━━━━━━━━━━━━━━━━━━━━━━━━━━━━━━━━━━━━━━━━━━━━━━━━
⚙️ HOW TO USE THIS INDICATOR
1️⃣ SETUP
• Apply to SPY, QQQ, IWM, or any liquid stock/ETF
• Recommended timeframes: 1-minute or 5-minute charts
• The indicator automatically detects the 9:30-9:45 AM ET session
2️⃣ WAIT FOR THE RANGE
• A blue box will form showing the Opening Range
• Wait for the 15-minute period to complete (marked "✅ COMPLETE" in dashboard)
• Note the range size - larger ranges often mean stronger moves
3️⃣ TRADE THE BREAKOUT
• 🟢 LONG: When price closes above the Opening Range High
• 🔴 SHORT: When price closes below the Opening Range Low
• Signals appear automatically with entry, stop loss (SL), and take profit (TP) levels
4️⃣ MANAGE YOUR TRADE
• Stop Loss: Placed at opposite side of range (default) or midpoint
• Take Profit: Based on your selected Risk:Reward ratio
• The indicator tracks win rate automatically
━━━━━━━━━━━━━━━━━━━━━━━━━━━━━━━━━━━━━━━━━━━━━━━━━━━━
🎯 ENTRY TYPES
BREAKOUT MODE (Default)
- Enters immediately when price breaks the range
- More signals, catches the initial move
- Best for: Trending days, high momentum
RETEST MODE
- Waits for price to break out, then pull back to the range
- Fewer signals, better entry price
- Best for: Choppy days, tighter stops
━━━━━━━━━━━━━━━━━━━━━━━━━━━━━━━━━━━━━━━━━━━━━━━━━━━━
📊 SETTINGS EXPLAINED
Display Settings:
- Show Signals - Toggle buy/sell signals
- Show Opening Range Box - Visual box around the 15-min range
- Show Dashboard - Information panel with status and stats
Opening Range Settings:
- Opening Range Minutes - Default 15, adjustable 5-60
- Stop Trading After - Prevents late-day trades (default 3PM ET)
Entry Settings:
- Entry Type - Breakout or Retest
- Require Volume Confirmation - Only signals on above-average volume
- Require FVG Confluence - Adds Fair Value Gap filter for extra confirmation
Risk Management:
- Stop Loss Placement - Opposite Side / Midpoint / ATR Based
- Risk:Reward Ratio - Set your target (1.5 recommended)
━━━━━━━━━━━━━━━━━━━━━━━━━━━━━━━━━━━━━━━━━━━━━━━━━━━━
💡 TIPS FOR BEST RESULTS
✅ DO:
- Trade liquid instruments (SPY, QQQ, major stocks)
- Use 1-5 minute charts for better entry precision
- Respect the stop loss - the range defines your risk
- Pay attention to range size (0.5-1.5x ATR is ideal)
- Be patient - only 1-2 setups per day
❌ AVOID:
- Trading both directions on the same day
- Taking trades after 2-3 PM ET
- Very small ranges (likely to get chopped out)
- Low volume breakouts (often fail)
━━━━━━━━━━━━━━━━━━━━━━━━━━━━━━━━━━━━━━━━━━━━━━━━━━━━
📈 DASHBOARD INFORMATION
The dashboard shows:
- OR Status - Forming / Complete / Waiting
- OR High/Low - The range levels
- Range Size - In points and ATR multiples
- Breakout Direction - Long / Short / None
- Volume Status - High or Normal
- Win Rate - Tracked automatically
- W/L Record - Wins and losses count
━━━━━━━━━━━━━━━━━━━━━━━━━━━━━━━━━━━━━━━━━━━━━━━━━━━━
🔔 ALERTS INCLUDED
- Opening Range Complete - Notifies when the 15-min range is set
- ORB Long Signal - Buy signal triggered
- ORB Short Signal - Sell signal triggered
- Breakout Up/Down - Range broken (even without signal)
━━━━━━━━━━━━━━━━━━━━━━━━━━━━━━━━━━━━━━━━━━━━━━━━━━━━
⚠️ DISCLAIMER
This indicator is for educational and informational purposes only. Past performance does not guarantee future results. Always use proper risk management and never risk more than you can afford to lose. This is not financial advice.
━━━━━━━━━━━━━━━━━━━━━━━━━━━━━━━━━━━━━━━━━━━━━━━━━━━━
━━━━━━━━━━━━━━━━━━━━━━━━━━━━━━━━━━━━━━━━━━━━━━━━━━━━
We hope you find this indicator valuable in your trading journey!
💬 Questions or feedback? Leave a comment below.
🌐 Check out our full Indicator Suite: www.neura-edge.com
📧 Support: support@neura-edge.com
Happy Trading!

Chop Meter + Trade Filter 1H/30M/15M (Ace PROFILE v3)💪 How to Actually Use This (The MMXM Way)
1️⃣ Check the Status Before ANY trade
If it says NO TRADE → Do not fight it.
Your psychology stays clean.
2️⃣ If TRADE (1M NO TRADE – 15M CHOP)
Avoid:
1M SIBI/OB
1M BOS/CHOCH
1M SMT
1M Silver Bullet windows
Use only higher-timeframe breaks.
3️⃣ If ALL THREE are NORMAL → Full Go Mode
Every tool is unlocked:
1M microstructure
1M FVG snipes
Killzones
Silver Bullet
SMT timing
MMXM purge setups
This is where your best trades come from.
4️⃣ If 30M is CHOP
Sit tight.
It’s a trap day or compression box.
This one filter alone will save you:
FOMO losses
False expansion traps
Microstructure whipsaws
News fakeouts
Reversal cliffs
Algo snapbacks
🧠 Why This Indicator Works
No indicators.
No RSI.
No Bollinger.
No volume bullshit.
Just structure, time, and compression — exactly how the algorithm trades volatility.
When this tool says NO TRADE, it is telling you:
“This is NOT the moment the algorithm will expand.”
And that’s the whole game.
🔥 Summary
Condition Meaning Action
30M = CHOP 30M box active No trading at all
2+ TF CHOP HTF compression No trading
15M CHOP Micro compression No 1M entries
All NORMAL Expansion conditions Full Go Mode
