Gann swings [promuckaj]This indicator is a tool that could help the users what the market trend is at any time, based on legendary trader, Mr. William D. Gann .
Gann it self called this the “Trendline Indicator”, but modern traders call it Swing.
Gann’s primary use his techniques in correlation with this trading tool helping him achieve his phenomenal trading results.
Gann swings automatically displays the swing chart and trend on any timeframe you choose. There is option to set desired color and width of the trend line.
There is 3 types of settings to determine the swings, from 1 to 3 which represent the number of bars as confirmation for the swing bar. Default is 2.
There is labels on bars that gives information about each bar, is it up, down, inside or outside bar. This can be turned off/on.
🡱 - Up bar
🡳 - Down bar
⬍ - Outside bar
x - Inside bar
Indicator is also fully customizable to display break-out lines, which indicate potential trend changes ahead of time. There is option to choose whether you want to mark only first breaks in a row or you want all of them in case there is multiple ones in the same direction.
Gann swings is an indicator that EVERY trader and investor should have, it can provide vital information that can help to determine the trend of any market and information about the upswings and downswings.
Everyone enjoy trading !
P.S.:
I have in my mind some additional features as upgrade that can include data about each swing, like data for tops/bottoms date, time, price, range in % between swings, and bar count of each swing that is formed on the chart.
Cari dalam skrip untuk "gann"

nifty gann & 100 levelsnifty gannlevels with 100 points defference
gann levels with manual entry of cuurent gann level
manual entry of diffeence between two gann levels

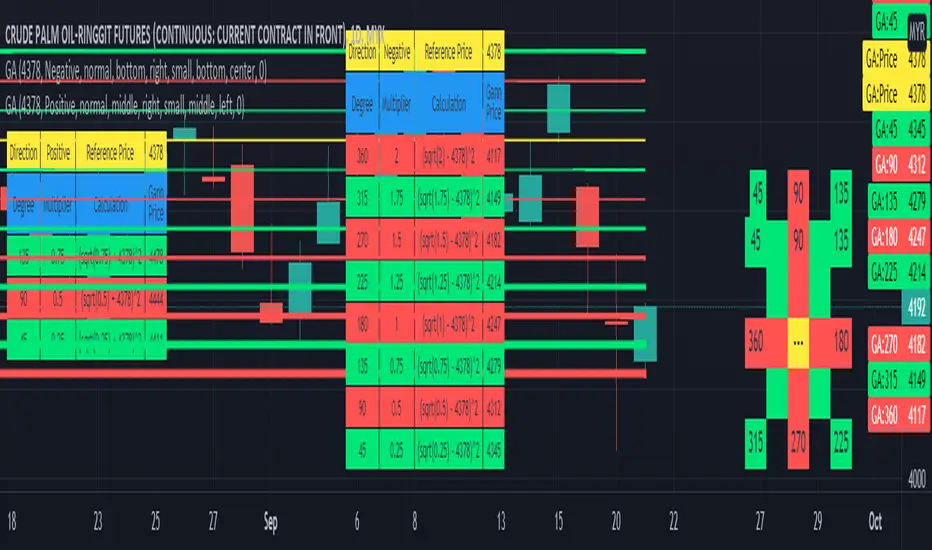
Gann Angle Table Calculator PlotterThis indicator was build upon based on Gann Angle and Gann Multiplier as refered of The Tunnel Thru The Air Or Looking Back From 1940, written by WD Gann .
Credits to FaizHebat for calculation.
Indicator features :
1. Font size from tiny to huge.
2. Table position.
3. Color for cell table and plot can be input or reversed.
4. Plot can be show or hide and also price can be track.
5. Able show currency and decimal price.
6. Gann table and Calculation table can show or hide.
7. Each Gann point can be hide including plot and calculation.
8. For desktop display only, not for mobile.
Pros :
1. Can be used as single or more indicator. (Chart show 2 same indicator with different setup)
Cons :
1. Price must be input before selecting any Gann Point.
FAQ
1. Credits
WD Gann , The Tunnel Thru The Air Or Looking Back From 1940
FaizHebat
2. Code Usage
Free to use for personal usage.
Positive direction with Currency and Decimal
Positive direction with Currency and Decimal
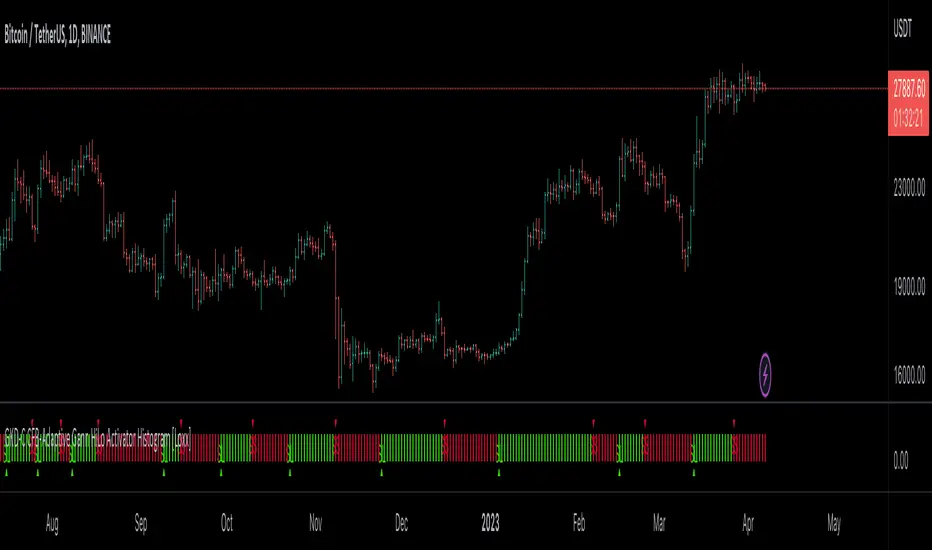
GKD-C CFB-Adaptive Gann HiLo Activator Histogram [Loxx]Giga Kaleidoscope GKD-C CFB-Adaptive Gann HiLo Activator Histogram is a Confirmation module included in Loxx's "Giga Kaleidoscope Modularized Trading System".
█ Giga Kaleidoscope Modularized Trading System
What is Loxx's "Giga Kaleidoscope Modularized Trading System"?
The Giga Kaleidoscope Modularized Trading System is a trading system built on the philosophy of the NNFX (No Nonsense Forex) algorithmic trading.
What is the NNFX algorithmic trading strategy?
The NNFX (No-Nonsense Forex) trading system is a comprehensive approach to Forex trading that is designed to simplify the process and remove the confusion and complexity that often surrounds trading. The system was developed by a Forex trader who goes by the pseudonym "VP" and has gained a significant following in the Forex community.
The NNFX trading system is based on a set of rules and guidelines that help traders make objective and informed decisions. These rules cover all aspects of trading, including market analysis, trade entry, stop loss placement, and trade management.
Here are the main components of the NNFX trading system:
1. Trading Philosophy: The NNFX trading system is based on the idea that successful trading requires a comprehensive understanding of the market, objective analysis, and strict risk management. The system aims to remove subjective elements from trading and focuses on objective rules and guidelines.
2. Technical Analysis: The NNFX trading system relies heavily on technical analysis and uses a range of indicators to identify high-probability trading opportunities. The system uses a combination of trend-following and mean-reverting strategies to identify trades.
3. Market Structure: The NNFX trading system emphasizes the importance of understanding the market structure, including price action, support and resistance levels, and market cycles. The system uses a range of tools to identify the market structure, including trend lines, channels, and moving averages.
4. Trade Entry: The NNFX trading system has strict rules for trade entry. The system uses a combination of technical indicators to identify high-probability trades, and traders must meet specific criteria to enter a trade.
5. Stop Loss Placement: The NNFX trading system places a significant emphasis on risk management and requires traders to place a stop loss order on every trade. The system uses a combination of technical analysis and market structure to determine the appropriate stop loss level.
6. Trade Management: The NNFX trading system has specific rules for managing open trades. The system aims to minimize risk and maximize profit by using a combination of trailing stops, take profit levels, and position sizing.
Overall, the NNFX trading system is designed to be a straightforward and easy-to-follow approach to Forex trading that can be applied by traders of all skill levels.
Core components of an NNFX algorithmic trading strategy
The NNFX algorithm is built on the principles of trend, momentum, and volatility. There are six core components in the NNFX trading algorithm:
1. Volatility - price volatility; e.g., Average True Range, True Range Double, Close-to-Close, etc.
2. Baseline - a moving average to identify price trend
3. Confirmation 1 - a technical indicator used to identify trends
4. Confirmation 2 - a technical indicator used to identify trends
5. Continuation - a technical indicator used to identify trends
6. Volatility/Volume - a technical indicator used to identify volatility/volume breakouts/breakdown
7. Exit - a technical indicator used to determine when a trend is exhausted
What is Volatility in the NNFX trading system?
In the NNFX (No Nonsense Forex) trading system, ATR (Average True Range) is typically used to measure the volatility of an asset. It is used as a part of the system to help determine the appropriate stop loss and take profit levels for a trade. ATR is calculated by taking the average of the true range values over a specified period.
True range is calculated as the maximum of the following values:
-Current high minus the current low
-Absolute value of the current high minus the previous close
-Absolute value of the current low minus the previous close
ATR is a dynamic indicator that changes with changes in volatility. As volatility increases, the value of ATR increases, and as volatility decreases, the value of ATR decreases. By using ATR in NNFX system, traders can adjust their stop loss and take profit levels according to the volatility of the asset being traded. This helps to ensure that the trade is given enough room to move, while also minimizing potential losses.
Other types of volatility include True Range Double (TRD), Close-to-Close, and Garman-Klass
What is a Baseline indicator?
The baseline is essentially a moving average, and is used to determine the overall direction of the market.
The baseline in the NNFX system is used to filter out trades that are not in line with the long-term trend of the market. The baseline is plotted on the chart along with other indicators, such as the Moving Average (MA), the Relative Strength Index (RSI), and the Average True Range (ATR).
Trades are only taken when the price is in the same direction as the baseline. For example, if the baseline is sloping upwards, only long trades are taken, and if the baseline is sloping downwards, only short trades are taken. This approach helps to ensure that trades are in line with the overall trend of the market, and reduces the risk of entering trades that are likely to fail.
By using a baseline in the NNFX system, traders can have a clear reference point for determining the overall trend of the market, and can make more informed trading decisions. The baseline helps to filter out noise and false signals, and ensures that trades are taken in the direction of the long-term trend.
What is a Confirmation indicator?
Confirmation indicators are technical indicators that are used to confirm the signals generated by primary indicators. Primary indicators are the core indicators used in the NNFX system, such as the Average True Range (ATR), the Moving Average (MA), and the Relative Strength Index (RSI).
The purpose of the confirmation indicators is to reduce false signals and improve the accuracy of the trading system. They are designed to confirm the signals generated by the primary indicators by providing additional information about the strength and direction of the trend.
Some examples of confirmation indicators that may be used in the NNFX system include the Bollinger Bands, the MACD (Moving Average Convergence Divergence), and the MACD Oscillator. These indicators can provide information about the volatility, momentum, and trend strength of the market, and can be used to confirm the signals generated by the primary indicators.
In the NNFX system, confirmation indicators are used in combination with primary indicators and other filters to create a trading system that is robust and reliable. By using multiple indicators to confirm trading signals, the system aims to reduce the risk of false signals and improve the overall profitability of the trades.
What is a Continuation indicator?
In the NNFX (No Nonsense Forex) trading system, a continuation indicator is a technical indicator that is used to confirm a current trend and predict that the trend is likely to continue in the same direction. A continuation indicator is typically used in conjunction with other indicators in the system, such as a baseline indicator, to provide a comprehensive trading strategy.
What is a Volatility/Volume indicator?
Volume indicators, such as the On Balance Volume (OBV), the Chaikin Money Flow (CMF), or the Volume Price Trend (VPT), are used to measure the amount of buying and selling activity in a market. They are based on the trading volume of the market, and can provide information about the strength of the trend. In the NNFX system, volume indicators are used to confirm trading signals generated by the Moving Average and the Relative Strength Index. Volatility indicators include Average Direction Index, Waddah Attar, and Volatility Ratio. In the NNFX trading system, volatility is a proxy for volume and vice versa.
By using volume indicators as confirmation tools, the NNFX trading system aims to reduce the risk of false signals and improve the overall profitability of trades. These indicators can provide additional information about the market that is not captured by the primary indicators, and can help traders to make more informed trading decisions. In addition, volume indicators can be used to identify potential changes in market trends and to confirm the strength of price movements.
What is an Exit indicator?
The exit indicator is used in conjunction with other indicators in the system, such as the Moving Average (MA), the Relative Strength Index (RSI), and the Average True Range (ATR), to provide a comprehensive trading strategy.
The exit indicator in the NNFX system can be any technical indicator that is deemed effective at identifying optimal exit points. Examples of exit indicators that are commonly used include the Parabolic SAR, the Average Directional Index (ADX), and the Chandelier Exit.
The purpose of the exit indicator is to identify when a trend is likely to reverse or when the market conditions have changed, signaling the need to exit a trade. By using an exit indicator, traders can manage their risk and prevent significant losses.
In the NNFX system, the exit indicator is used in conjunction with a stop loss and a take profit order to maximize profits and minimize losses. The stop loss order is used to limit the amount of loss that can be incurred if the trade goes against the trader, while the take profit order is used to lock in profits when the trade is moving in the trader's favor.
Overall, the use of an exit indicator in the NNFX trading system is an important component of a comprehensive trading strategy. It allows traders to manage their risk effectively and improve the profitability of their trades by exiting at the right time.
How does Loxx's GKD (Giga Kaleidoscope Modularized Trading System) implement the NNFX algorithm outlined above?
Loxx's GKD v1.0 system has five types of modules (indicators/strategies). These modules are:
1. GKD-BT - Backtesting module (Volatility, Number 1 in the NNFX algorithm)
2. GKD-B - Baseline module (Baseline and Volatility/Volume, Numbers 1 and 2 in the NNFX algorithm)
3. GKD-C - Confirmation 1/2 and Continuation module (Confirmation 1/2 and Continuation, Numbers 3, 4, and 5 in the NNFX algorithm)
4. GKD-V - Volatility/Volume module (Confirmation 1/2, Number 6 in the NNFX algorithm)
5. GKD-E - Exit module (Exit, Number 7 in the NNFX algorithm)
(additional module types will added in future releases)
Each module interacts with every module by passing data between modules. Data is passed between each module as described below:
GKD-B => GKD-V => GKD-C(1) => GKD-C(2) => GKD-C(Continuation) => GKD-E => GKD-BT
That is, the Baseline indicator passes its data to Volatility/Volume. The Volatility/Volume indicator passes its values to the Confirmation 1 indicator. The Confirmation 1 indicator passes its values to the Confirmation 2 indicator. The Confirmation 2 indicator passes its values to the Continuation indicator. The Continuation indicator passes its values to the Exit indicator, and finally, the Exit indicator passes its values to the Backtest strategy.
This chaining of indicators requires that each module conform to Loxx's GKD protocol, therefore allowing for the testing of every possible combination of technical indicators that make up the six components of the NNFX algorithm.
What does the application of the GKD trading system look like?
Example trading system:
Backtest: Strategy with 1-3 take profits, trailing stop loss, multiple types of PnL volatility, and 2 backtesting styles
Baseline: Hull Moving Average
Volatility/Volume: Hurst Exponent
Confirmation 1: CFB-Adaptive Gann HiLo Activator Histogram as shown on the chart above
Confirmation 2: Williams Percent Range
Continuation: Fisher Transform
Exit: Rex Oscillator
Each GKD indicator is denoted with a module identifier of either: GKD-BT, GKD-B, GKD-C, GKD-V, or GKD-E. This allows traders to understand to which module each indicator belongs and where each indicator fits into the GKD protocol chain.
Giga Kaleidoscope Modularized Trading System Signals (based on the NNFX algorithm)
Standard Entry
1. GKD-C Confirmation 1 Signal
2. GKD-B Baseline agrees
3. Price is within a range of 0.2x Volatility and 1.0x Volatility of the Goldie Locks Mean
4. GKD-C Confirmation 2 agrees
5. GKD-V Volatility/Volume agrees
Baseline Entry
1. GKD-B Baseline signal
2. GKD-C Confirmation 1 agrees
3. Price is within a range of 0.2x Volatility and 1.0x Volatility of the Goldie Locks Mean
4. GKD-C Confirmation 2 agrees
5. GKD-V Volatility/Volume agrees
6. GKD-C Confirmation 1 signal was less than 7 candles prior
Continuation Entry
1. Standard Entry, Baseline Entry, or Pullback; entry triggered previously
2. GKD-B Baseline hasn't crossed since entry signal trigger
3. GKD-C Confirmation Continuation Indicator signals
4. GKD-C Confirmation 1 agrees
5. GKD-B Baseline agrees
6. GKD-C Confirmation 2 agrees
1-Candle Rule Standard Entry
1. GKD-C Confirmation 1 signal
2. GKD-B Baseline agrees
3. Price is within a range of 0.2x Volatility and 1.0x Volatility of the Goldie Locks Mean
Next Candle:
1. Price retraced (Long: close < close or Short: close > close )
2. GKD-B Baseline agrees
3. GKD-C Confirmation 1 agrees
4. GKD-C Confirmation 2 agrees
5. GKD-V Volatility/Volume agrees
1-Candle Rule Baseline Entry
1. GKD-B Baseline signal
2. GKD-C Confirmation 1 agrees
3. Price is within a range of 0.2x Volatility and 1.0x Volatility of the Goldie Locks Mean
4. GKD-C Confirmation 1 signal was less than 7 candles prior
Next Candle:
1. Price retraced (Long: close < close or Short: close > close )
2. GKD-B Baseline agrees
3. GKD-C Confirmation 1 agrees
4. GKD-C Confirmation 2 agrees
5. GKD-V Volatility/Volume Agrees
PullBack Entry
1. GKD-B Baseline signal
2. GKD-C Confirmation 1 agrees
3. Price is beyond 1.0x Volatility of Baseline
Next Candle:
1. Price is within a range of 0.2x Volatility and 1.0x Volatility of the Goldie Locks Mean
3. GKD-C Confirmation 1 agrees
4. GKD-C Confirmation 2 agrees
5. GKD-V Volatility/Volume Agrees
█ GKD-C CFB-Adaptive Gann HiLo Activator Histogram
What is Composite Fractal Behavior?
Composite Fractal Behavior is a technical analysis concept developed by Mark Jurik that describes the behavior of financial markets as a combination of various fractal patterns.
Fractal patterns are repeating patterns that occur at different scales and are present in many natural and man-made systems. In financial markets, fractal patterns can be observed in the price movements of various timeframes, from short-term intraday movements to long-term trends.
The concept of Composite Fractal Behavior suggests that by analyzing and combining different fractal patterns from various timeframes, a more accurate prediction of market behavior can be made. Jurik developed various indicators and algorithms based on this concept, such as the JMA (Jurik Moving Average) and the JFB (Jurik Fractal Bands) indicator.
What is the Gann HiLo Activator?
The Gann HiLo Activator is a trend-following indicator that is used to identify the direction of a trend and to generate trading signals based on the price movements. The indicator was created by W.D. Gann, a famous trader and analyst, who developed a number of technical analysis tools and trading strategies.
The Gann HiLo Activator is based on the principle of moving averages and is designed to provide a visual representation of the trend. It consists of two lines, the Gann HiLo Activator line and the Gann HiLo Activator offset line. The Gann HiLo Activator line is calculated by taking the average of the high and low prices for a given period, and the offset line is calculated by taking the difference between the Gann HiLo Activator line and a moving average of the Gann HiLo Activator line.
The Gann HiLo Activator line acts as a signal line, and when the price is above the Gann HiLo Activator line, the trend is considered to be bullish, and when the price is below the Gann HiLo Activator line, the trend is considered to be bearish. The offset line is used to generate trading signals, and when the price crosses above the offset line, it is considered to be a buy signal, and when the price crosses below the offset line, it is considered to be a sell signal.
The Gann HiLo Activator is used by traders and analysts to identify trends and to generate trading signals based on the price movements. It is a popular indicator among technical analysts and is used in a variety of trading strategies, including swing trading, trend following, and momentum trading. The indicator can be used on any time frame and can be applied to any market, including stocks, futures, currencies, and commodities.
What is CFB-Adaptive Gann HiLo Activator Histogram?
This indicator makes the Gann HiLo Activator fractal-adaptive by injecting Composite Fractal Behavior measured periods into the Activator. These period inputs vary bar-by-bar.
Requirements
Inputs
Confirmation 1 and Solo Confirmation: GKD-V Volatility / Volume indicator
Confirmation 2: GKD-C Confirmation indicator
Outputs
Confirmation 2 and Solo Confirmation Complex: GKD-E Exit indicator
Confirmation 1: GKD-C Confirmation indicator
Continuation: GKD-E Exit indicator
Solo Confirmation Simple: GKD-BT Backtest strategy
Additional features will be added in future releases.
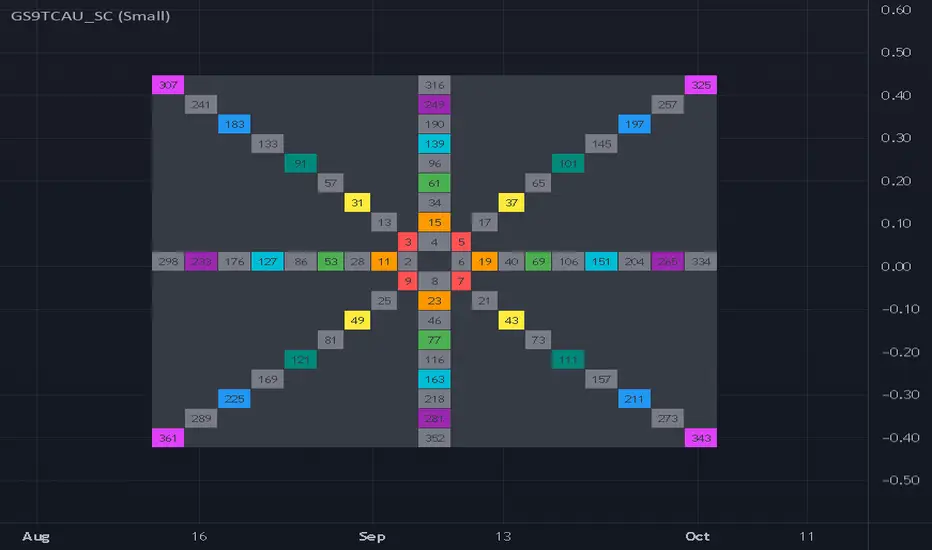
Gann Square 9 Table Concept Alternate UIThis indicator was intended as educational purpose only for Gann Square 4, specifically to show Cross Cardinal.
This indicator was build upon The Tunnel Thru The Air Or Looking Back From 1940, written by WD Gann .
This build was improved by grouping similar values after selected to save time.
User Interface also was improved.
Indikator ini bertujuan sebagai pendidikan sahaja untuk Gann Square 4, khusus untuk menunjukkan Cross Cardinal.
Indikator ini dibina berdasarkan buku The Tunnel Thru The Air Or Looking Back From 1940, ditulis oleh WD Gann .
Binaan ini telah ditambah baik engan mengumpulkan nilai yang sama setelah dipilih untuk menjimatkan masa.
User Interface juga telah ditambah baik.
Indicator features :
1. Font size from tiny to huge.
2. For desktop display only, not for mobile.
3. All values can be selected by group.
Kemampuan indikator :
1. Saiz font dari paling kecil ke paling besar.
2. Untuk paparan desktop sahaja, bukan untuk mobile.
3. Semua nilai boleh dipilih secara berkumpulan.
FAQ
1. Credits / Kredit
WD Gann , The Tunnel Thru The Air Or Looking Back From 1940
Ganzilla
2. Page involved / Muka Surat terlibat
195 - 198
3. Code Usage / Penggunaan Kod
Free to use for personal usage.
Bebas untuk kegunaan peribadi.
4. Previous build / Binaan sebelum ini
Gann Square 9 Cross Cardinal Table Concept
5. Related build / Binaan berkaitan
Gann Square 4 Cross Cardinal Table Concept
Gann Square 4 Table Concept Alternate UI
Left : Even array number / Kiri : Array nombor genap
Right : Odd array number / Kanan : Array nombor ganjil
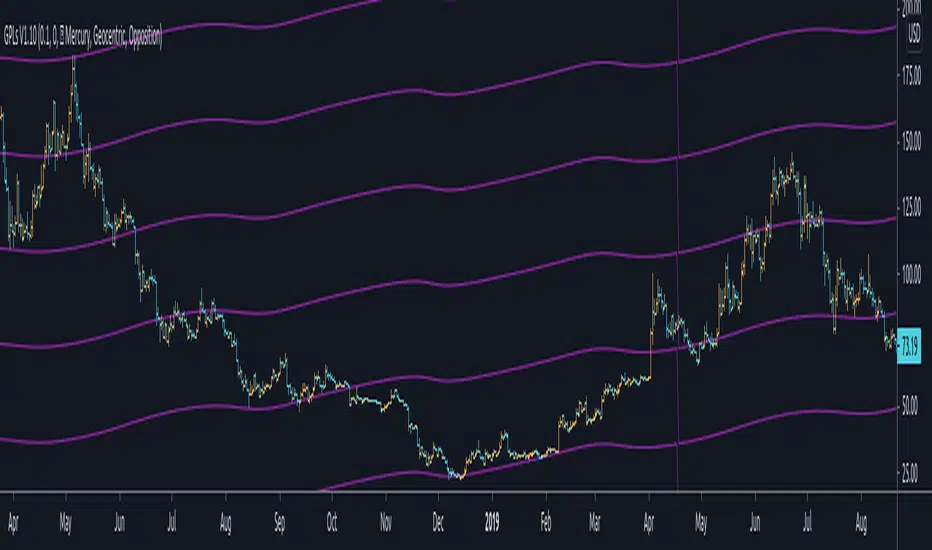
Gann Planetary Lines█ OVERVIEW
Gann Planetary Lines is one of the most powerful Gann Tools that converts planetary longitude angles into price. This script can be used in many different ways, methods, and trading systems.
This Script allows you to Plot Mercury, Venus, Mars, Jupiter, Saturn, Uranus, Neptune, and Pluto. While also allowing you to select the planetary line mode "Heliocentric" or "Geocentric"
One more important feature about this script. It also allows you to plot in the harmonics of these planetary lines : "Wheel of 24" ,"Semi-Sextile", "Semi-Square", "Sextile", "Quintile", "Square", "Trine", and "Opposition "
And of course you will be able to select the color of each one of the planets when it comes to styling.
One more important thing to mention, Yes you will be able to select the $/° value so you can square these lines perfectly in your chart!
█ Future Plans and upgrades to this script may include :
1. Further lines into the futures.
2. An option to Enable and Disable the 0° vertical line when the planet transition from 360° to 0°
3. Labels around the planetary lines to distinguish between them not only by color by text as well.
And more! Feel free to contact me with any feature that you would like to see in this script
█ How to use :
First of all, select the appropriate $/° value.
Then select the planet you would like to use from the list in the script's option.
Select the mode of the planet, "Heliocentric" or "Geocentric"
Make sure to enable the planet by clicking on the check mark.
Then you will be able to see these planets on your chart.
Additionally, I have included an option to add the harmonics to your planetary lines!
Simply select the harmonics that you would like to have and give it 10 seconds and it should be in your chart.
This script is coded as an addon to the Gann ToolBox package/scripts.
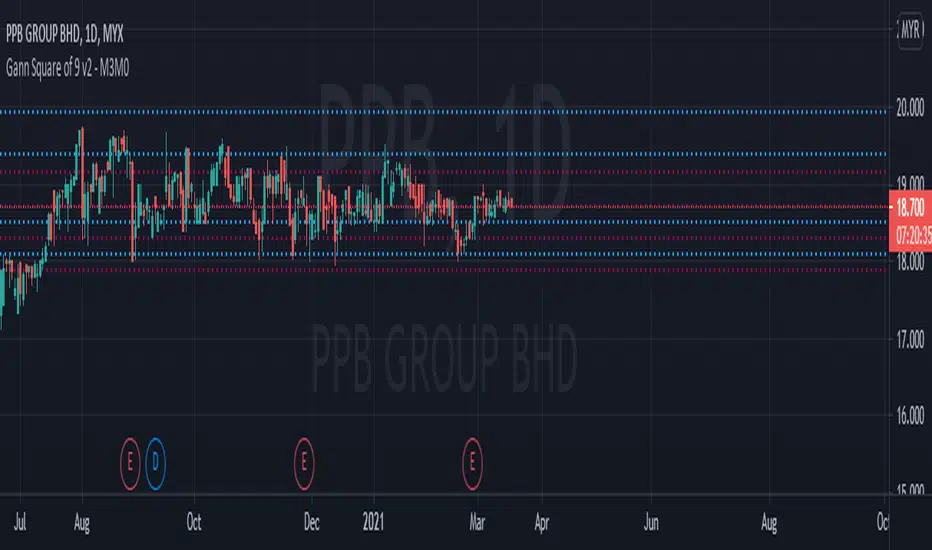
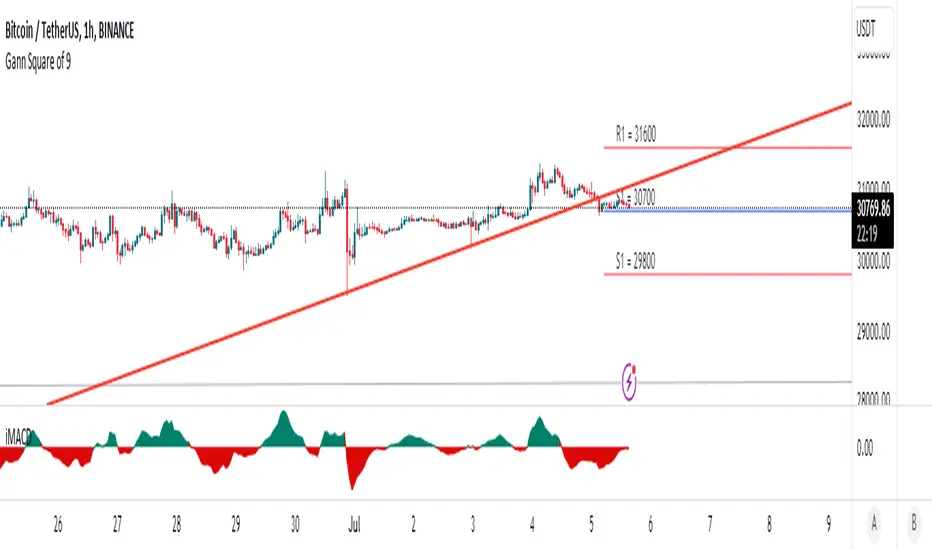
Gann Square of 9 v2- M3M0The Square of nine or Gann Square or Master Chart is also known as the square root calculator and finds its basis in Gann's methods which is squaring price and time. The square of 9 is a spiral of numbers with the initial value "1" starting at the centre. Starting from this central value, the number is increased as we move in a spiral form and a clockwise direction. According to some experts, each cell in Gann’s square of nine represents a point of vibration.
This indicator will automatically plot the Gann Level based on the Gann Square of 9 table.
How to trade with Gann Square of 9.
This indicator will automatically plot 4 lines above the current price and 4 lines below the current price, which is based on Gann Square of 9 table.
If the lines above the current price, it will be as resistance. If the lines below the current price, it will be as support.
The blue line is the strong level from Gann Square of 9 table while the red line is the very strong level from Gann Square of 9 table.
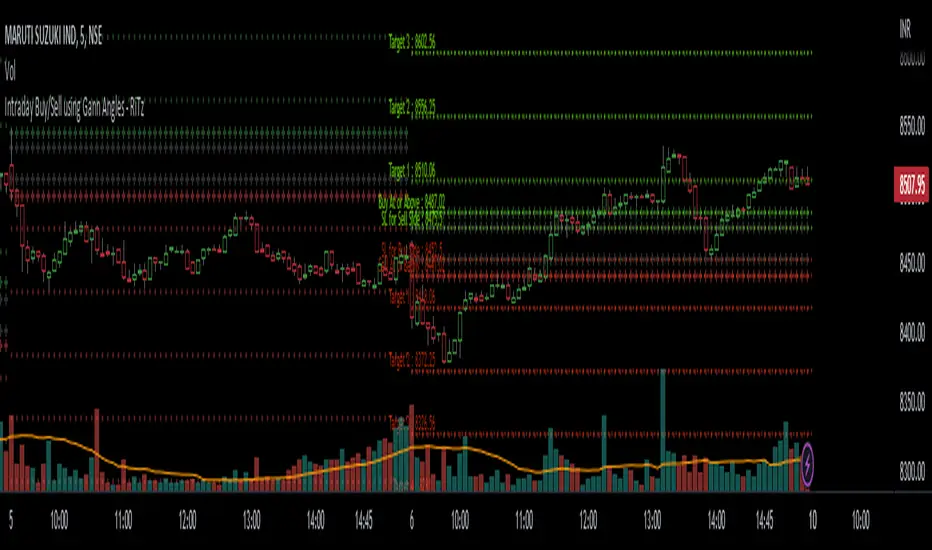
Intraday Buy/Sell using Gann Angles - RiTzIntraday Buy/Sell Levels using Gann Angles based on Todays Open/previous Day High/Low/Close prices
How to use this :
The Buy/Sell levels will be calculated on 1 of 4 things (you can choose any one which you prefer)
1. Todays Open price
2. Previous Day High
3. Previous Day Low
4. Previous Day Close
The Buy/Sell levels will be displayed in these ways
1. In a Table
2. on the Chart
You can turn them on/off according to your preference!
I can't seem to find the original documentation or a link to it.
i have it's excel file, in which we have to enter following data :
1. Todays Open price
2. Previous Day High
3. Previous Day Low
4. Previous Day Close
and the buy/sell levels are calculated by using the above data in following manner :
Based On Today's Opening Price
(lets call it TDO)
Degree's````````````````` Degree Factor```````````````````````` Buy````````````````````````` Sell
11.25```````````````````` =degree/180=11.25/180=0.0625````````` =(sqrt(TDO)-0.0625)^2``````` =(sqrt(TDO)+0.0625)^2````` SL
22.5````````````````````` =degree/180=22.5/180=0.125``````````` =(sqrt(TDO)+0.125)^2```````` =(sqrt(TDO)-0.125)^2`````` Buy/Sell At
45``````````````````````` =degree/180=45/180=0.25`````````````` =(sqrt(TDO)+0.25)^2````````` =(sqrt(TDO)-0.25)^2``````` Target-1
90``````````````````````` =degree/180=90/180=0.5``````````````` =(sqrt(TDO)+0.5)^2`````````` =(sqrt(TDO)-0.5)^2```````` Target-2
135`````````````````````` =degree/180=135/180=0.75````````````` =(sqrt(TDO)+0.75)^2````````` =(sqrt(TDO)-0.75)^2``````` Target-3
180`````````````````````` =degree/180=180/180=1```````````````` =(sqrt(TDO)+1)^2```````````` =(sqrt(TDO)-1)^2`````````` Target-4
225`````````````````````` =degree/180=225/180=1.25````````````` =(sqrt(TDO)+1.25)^2````````` =(sqrt(TDO)-1.25)^2``````` Target-5
270`````````````````````` =degree/180=270/180=1.5`````````````` =(sqrt(TDO)+1.5)^2`````````` =(sqrt(TDO)-1.5)^2```````` Target-6
315`````````````````````` =degree/180=315/180=1.75````````````` =(sqrt(TDO)+1.75)^2````````` =(sqrt(TDO)-1.75)^2``````` Target-7
360`````````````````````` =degree/180=360/180=2```````````````` =(sqrt(TDO)+2)^2```````````` =(sqrt(TDO)-2)^2`````````` Target-8
sqrt = square root
TDO = Today's Opening Price
PDH = Previous Days High
PDL = Previous Days Low
PDC = Previous Days Close
Based On Previous Days High Price
(lets call it PDH)
Degree's````````````````` Degree Factor```````````````````````` Buy````````````````````````` Sell
11.25```````````````````` =degree/180=11.25/180=0.0625````````` =(sqrt(PDH)-0.0625)^2``````` =(sqrt(PDH)+0.0625)^2````` SL
22.5````````````````````` =degree/180=22.5/180=0.125``````````` =(sqrt(PDH)+0.125)^2```````` =(sqrt(PDH)-0.125)^2`````` Buy/Sell At
45``````````````````````` =degree/180=45/180=0.25`````````````` =(sqrt(PDH)+0.25)^2````````` =(sqrt(PDH)-0.25)^2``````` Target-1
90``````````````````````` =degree/180=90/180=0.5``````````````` =(sqrt(PDH)+0.5)^2`````````` =(sqrt(PDH)-0.5)^2```````` Target-2
135`````````````````````` =degree/180=135/180=0.75````````````` =(sqrt(PDH)+0.75)^2````````` =(sqrt(PDH)-0.75)^2``````` Target-3
180`````````````````````` =degree/180=180/180=1```````````````` =(sqrt(PDH)+1)^2```````````` =(sqrt(PDH)-1)^2`````````` Target-4
225`````````````````````` =degree/180=225/180=1.25````````````` =(sqrt(PDH)+1.25)^2````````` =(sqrt(PDH)-1.25)^2``````` Target-5
270`````````````````````` =degree/180=270/180=1.5`````````````` =(sqrt(PDH)+1.5)^2`````````` =(sqrt(PDH)-1.5)^2```````` Target-6
315`````````````````````` =degree/180=315/180=1.75````````````` =(sqrt(PDH)+1.75)^2````````` =(sqrt(PDH)-1.75)^2``````` Target-7
360`````````````````````` =degree/180=360/180=2```````````````` =(sqrt(PDH)+2)^2```````````` =(sqrt(PDH)-2)^2`````````` Target-8
Based On Previous Days Low Price
(lets call it PDL)
Degree's````````````````` Degree Factor```````````````````````` Buy````````````````````````` Sell
11.25```````````````````` =degree/180=11.25/180=0.0625````````` =(sqrt(PDL)-0.0625)^2``````` =(sqrt(PDL)+0.0625)^2````` SL
22.5````````````````````` =degree/180=22.5/180=0.125``````````` =(sqrt(PDL)+0.125)^2```````` =(sqrt(PDL)-0.125)^2`````` Buy/Sell At
45``````````````````````` =degree/180=45/180=0.25`````````````` =(sqrt(PDL)+0.25)^2````````` =(sqrt(PDL)-0.25)^2``````` Target-1
90``````````````````````` =degree/180=90/180=0.5``````````````` =(sqrt(PDL)+0.5)^2`````````` =(sqrt(PDL)-0.5)^2```````` Target-2
135`````````````````````` =degree/180=135/180=0.75````````````` =(sqrt(PDL)+0.75)^2````````` =(sqrt(PDL)-0.75)^2``````` Target-3
180`````````````````````` =degree/180=180/180=1```````````````` =(sqrt(PDL)+1)^2```````````` =(sqrt(PDL)-1)^2`````````` Target-4
225`````````````````````` =degree/180=225/180=1.25````````````` =(sqrt(PDL)+1.25)^2````````` =(sqrt(PDL)-1.25)^2``````` Target-5
270`````````````````````` =degree/180=270/180=1.5`````````````` =(sqrt(PDL)+1.5)^2`````````` =(sqrt(PDL)-1.5)^2```````` Target-6
315`````````````````````` =degree/180=315/180=1.75````````````` =(sqrt(PDL)+1.75)^2````````` =(sqrt(PDL)-1.75)^2``````` Target-7
360`````````````````````` =degree/180=360/180=2```````````````` =(sqrt(PDL)+2)^2```````````` =(sqrt(PDL)-2)^2`````````` Target-8
Based On Previous Days Close Price
(lets call it PDC)
Degree's````````````````` Degree Factor```````````````````````` Buy````````````````````````` Sell
11.25```````````````````` =degree/180=11.25/180=0.0625````````` =(sqrt(PDC)-0.0625)^2``````` =(sqrt(PDC)+0.0625)^2````` SL
22.5````````````````````` =degree/180=22.5/180=0.125``````````` =(sqrt(PDC)+0.125)^2```````` =(sqrt(PDC)-0.125)^2`````` Buy/Sell At
45``````````````````````` =degree/180=45/180=0.25`````````````` =(sqrt(PDC)+0.25)^2````````` =(sqrt(PDC)-0.25)^2``````` Target-1
90``````````````````````` =degree/180=90/180=0.5``````````````` =(sqrt(PDC)+0.5)^2`````````` =(sqrt(PDC)-0.5)^2```````` Target-2
135`````````````````````` =degree/180=135/180=0.75````````````` =(sqrt(PDC)+0.75)^2````````` =(sqrt(PDC)-0.75)^2``````` Target-3
180`````````````````````` =degree/180=180/180=1```````````````` =(sqrt(PDC)+1)^2```````````` =(sqrt(PDC)-1)^2`````````` Target-4
225`````````````````````` =degree/180=225/180=1.25````````````` =(sqrt(PDC)+1.25)^2````````` =(sqrt(PDC)-1.25)^2``````` Target-5
270`````````````````````` =degree/180=270/180=1.5`````````````` =(sqrt(PDC)+1.5)^2`````````` =(sqrt(PDC)-1.5)^2```````` Target-6
315`````````````````````` =degree/180=315/180=1.75````````````` =(sqrt(PDC)+1.75)^2````````` =(sqrt(PDC)-1.75)^2``````` Target-7
360`````````````````````` =degree/180=360/180=2```````````````` =(sqrt(PDC)+2)^2```````````` =(sqrt(PDC)-2)^2`````````` Target-8
example based On Today's Opening Price = 4339
Degree's```````` Degree Factor```````` Buy`````````` Sell
11.25``````````` 0.0625``````````````` 4330.77`````` 4347.24```````` SL
22.5```````````` 0.125```````````````` 4355.48`````` 4322.55```````` Buy/Sell At
45`````````````` 0.25````````````````` 4372.00`````` 4306.13```````` Target-1
90`````````````` 0.5`````````````````` 4405.12`````` 4273.38```````` Target-2
135````````````` 0.75````````````````` 4438.37`````` 4240.76```````` Target-3
180````````````` 1```````````````````` 4471.74`````` 4208.26```````` Target-4
225````````````` 1.25````````````````` 4505.24`````` 4175.88```````` Target-5
270````````````` 1.5`````````````````` 4538.86`````` 4143.64```````` Target-6
315````````````` 1.75````````````````` 4572.61`````` 4111.51```````` Target-7
360````````````` 2```````````````````` 4606.48`````` 4079.52```````` Target-8
Note : ignore the '`' , inserted them to fill up the spaces , it was looking very weird!, tried to fix it as much as I can.
Note :- Please correct me if I'm wrong , as I've already mentioned I don't have it's original documentation.
if anyone can find it or already has it then please feel free to share it.
Jurik-Filtered, Gann HiLo Activator [Loxx]Jurik-Filtered, Gann HiLo Activator is a Gann HiLo activator that has been smoothed using Jurik Filtering to reduce noise and better identify trending markets.
What is Gann HiLo
The HiLo Activator study is a trend-following indicator introduced by Robert Krausz as part of the Gann Swing trading strategy. In addition to indicating the current trend direction, this can be used as both entry signal and trailing stop.
Here is how the HiLo Activator is calculated:
1. The system calculates the moving averages of the high and low prices over the last several candles. By default, the average is calculated using the last three candles.
2. If the close price falls below the average low or rises above the average high, the system plots the opposite moving average. For example, if the price crosses above the average high, the system will plot the average low. If the price crosses below the average low afterward, the system will stop plotting the average low and will start plotting the average high, and so forth.
The plot of the HiLo Activator thus consists of sections on the top and bottom of the price plot. The sections on the bottom signify bullish trending conditions. Vice versa, those on the top signify the bearish conditions.
What is Jurik Volty used in the Juirk Filter?
One of the lesser known qualities of Juirk smoothing is that the Jurik smoothing process is adaptive. "Jurik Volty" (a sort of market volatility ) is what makes Jurik smoothing adaptive. The Jurik Volty calculation can be used as both a standalone indicator and to smooth other indicators that you wish to make adaptive.
What is the Jurik Moving Average?
Have you noticed how moving averages add some lag (delay) to your signals? ... especially when price gaps up or down in a big move, and you are waiting for your moving average to catch up? Wait no more! JMA eliminates this problem forever and gives you the best of both worlds: low lag and smooth lines.
Ideally, you would like a filtered signal to be both smooth and lag-free. Lag causes delays in your trades, and increasing lag in your indicators typically result in lower profits. In other words, late comers get what's left on the table after the feast has already begun.
Included
-Toggle bar color on/off

Gann Circle Swing LevelsThis indicator is based on W. D. Gann's Square of 9 Chart and can be interpreted as the Gann Circle / Gann Wheel / 360 Degree Circle Chart or Square of the Circle Chart.
Spiral arrangement of numbers on the Square of 9 chart creates a very unique square root relationship amongst the numbers on the chart. If you take any number on the Square of 9 chart, take the square root of the number, then add 2 to the root and re-square it, resulting in one full 360 degree cycle (i.e. a 360 degree Circle) out from the center of the chart.
For example,
the square root of 121 = 11,
11 + 2 = 13,
and the square of 13 = 169
The number 169 is one full 360 degree cycle out (with reference to 121) from the center of the Square of 9 chart.
Similarly, if you take any number on the Square of 9 chart, take the square root of the number, then subtract 2 from the root and re-square it, resulting in one full 360 degree inward rotation towards the center of the chart.
For example,
the square root of 565 = 23.77,
23.77 - 2 = 21.77,
and the square of 21.77 = 473.93 (approximately equal to 474, which is directly below 565 on the Square of 9 chart)
The number 474 is one full 360 degree inward rotation (with reference to 565) towards the center of the chart.
How to Use this Indicator ?
This indicator is useful for finding coordinate squares on the Gann Circle that are making hard aspects to a previous position (such as a significant top or bottom) on the circle.
Input :
Swing Point (Significant price point, such as a top or a bottom)
Low / High ? (Is it a bottom or a top)
Number of Gann Levels (Number of Gann Cycles to be projected)
Output :
Gann Support or Resistance Levels (color coded as follows) :
Swing High or Swing Low (BLUE)
Support levels calculated with reference to the Swing High (RED)
Resistance levels calculated with reference to the Swing Low (LIME)

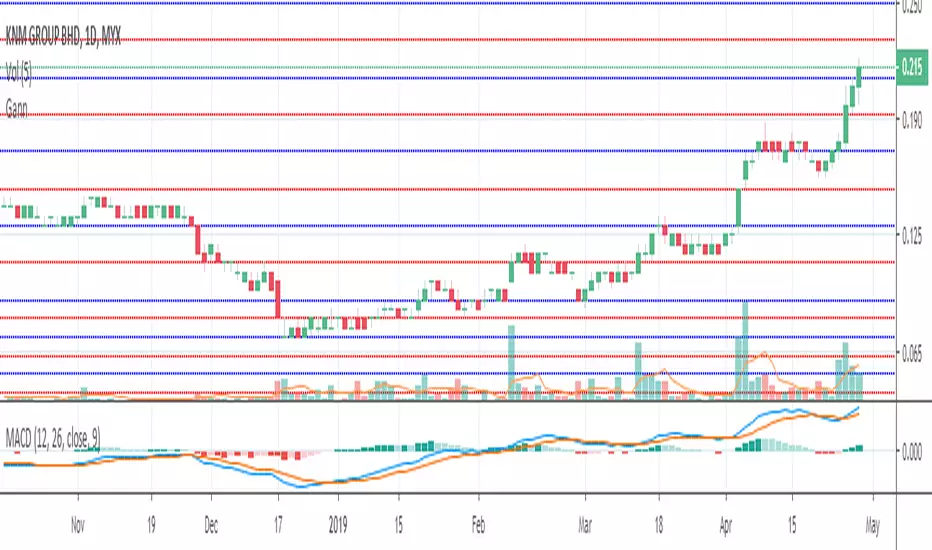
Gann Square 9 for Bursa Malaysia"The Square of nine or Gann Square or Master Chart is also known as the square root calculator and finds it basis from Gann's methods which is squaring price and time. The square of 9 is a spiral of numbers with the initial value "1" starting off at the center. Starting from this central value, the number is increased as we move in a spiral form and in a clockwise direction. According some experts, each cell in Gann’s square of nine represents a point of vibration" - from iSaham website
- Based on Gann Square 9 Table
- Lines act as Support and Resistance
- Lines can also be used as guide for Take Profit or Cut Loss level
- Indicator will plot 8 nearest lines at current price.
Generally, trade will refer :
- Red Line - Stronger Support and Resistance
- Blue Line - Support and Resistance
Notes :
Only suitable for Bursa Malaysia stocks
Currently lines only cover price below RM5
Please pm me if you interested to use :)

Gann LevelsHello everyone, Here's a script that draws all the Gann levels on the chart. It calculates the levels based on swing lows of a defined period (this is an input). The levels change based on the time frame of the chart. Darker blue lines represent key levels compared to the lighter blue lines. The yellow lines calculate levels below the swing low. Comments and suggestions welcome. Thanks, Arun

Gann Square of 9Red = Very Strong Support & Resistance
Blue = Strong Support & Resistance
Gann chart price is from 0 - 0.69
Price level exactly followed Gann arrangement.
Gann High Low Activator AlertsA Gann High Low Activator within a fixed range meant for alerts. A value of 1 means we're in an uptrend, a value of -1 a downtrend, and a value of 0 is neutral.
Thank you and happy trading

Gann Square of 9(For Bursa Malaysia only)
This indicator will display nearest support and resistance from Gann Square of 9 Box.
Red line (Strongest)
Resistance
Support
Blue line (Moderate)
Act as support and resistance
Only workable for price lower than RM18.
#GANNLEVELSThis indicator divides a whole structure (top to bottom) chart into 8 to 16 equal chunks.

Gann Levels (Auto) by RRR📌 Gann Levels (Auto) — Intraday, Swing & Elliott Wave Precision Tool
Gann Levels (Auto) is a high-accuracy price-reaction indicator designed for intraday scalpers, swing traders, and Elliott Wave traders who want clean, auto-updating support and resistance levels without manually drawing anything.
The indicator automatically detects the latest swing high & swing low and plots the 8 Gann Octave Levels between them. These levels act as a complete price map—showing equilibrium, structure, trend continuation zones, and reversal points with extreme precision.
🔥 Why This Indicator Stands Out
✔ Fully automatic swing detection
Levels update as structure evolves — no manual adjustments.
✔ All Gann Octave levels
Plots 1/8 through 8/8 including the critical 4/8 midpoint.
✔ Intraday-optimized
Exceptional on 1m, 3m, 5m, and 15m charts.
✔ Ultra-clean support & resistance
Levels act as reliable barriers and breakout zones.
⭐ MOST IMPORTANT LEVELS FOR INTRADAY
4/8 – Midpoint (Major Decision Pivot)
Strongest Gann level.
Controls trend or reversal for the session.
Breakout → Trend Day
Rejection → Reversal Day
8/8 & 0/8 – Extreme Structure Edges
Most likely zones for intraday reversals.
Perfect for scalp entries when combined with volume exhaustion.
🎯 How to Trade ELLIOTT WAVE Using Gann Levels
This indicator is exceptionally powerful when combined with Elliott Wave Theory.
Here is how to use it wave-by-wave:
🔵 Wave 2 → Identify Bottom Using 0/8 or 1/8 Levels
Wave 2 typically retraces deep but remains above key structure.
Gann confirmation:
Price stops at 0/8 or 1/8 zone
Rejection wick + low volume breakdown attempt
Bullish intent starts forming
This gives a perfect Wave 3 entry zone.
🔴 Wave 3 → Breakout Above 4/8 Midpoint
Wave 3 is the strongest impulsive wave.
The 4/8 level works like a force-field.
Wave 3 confirmation:
Price breaks and retests 4/8
Strong volume
No deep pullbacks after break
This is one of the most reliable Elliott + Gann trades.
🟡 Wave 4 → Uses 3/8 or 5/8 as Support/Resistance
Wave 4 is corrective and shallow compared to Wave 2.
Gann alignment:
Wave 4 often consolidates between 3/8 and 5/8
Levels act like range boundaries
Avoid trading inside chop; wait for breakout
This gives perfect continuation entries for Wave 5.
🟣 Wave 5 → Ends Near 7/8 or 8/8 Extreme Zone
Wave 5 usually ends in overbought territory.
Gann confirmation:
Price hits 7/8 or 8/8
Momentum weakens
Divergence builds (RSI/MACD optional)
Last push = exhaustion
This is where reversals or major pullbacks begin.
💥 BONUS: Corrective Waves (A-B-C)
Wave A:
Often rejects from 4/8 or 5/8.
Wave B:
Typically trapped between 3/8–5/8.
Wave C:
Usually ends around 0/8 (for bullish trend)
or 8/8 (for bearish trend).
These zones give ultra-high confidence entries.
⚙️ Who This Indicator Is Perfect For
Elliott Wave traders
Intraday scalpers
Swing traders
Price action & structure traders
Traders who want automatic support-resistance levels
Traders who want clean, non-cluttered levels
⚠️ Disclaimer
This indicator is for educational purposes only.
Trading involves risk. Always use proper risk management.

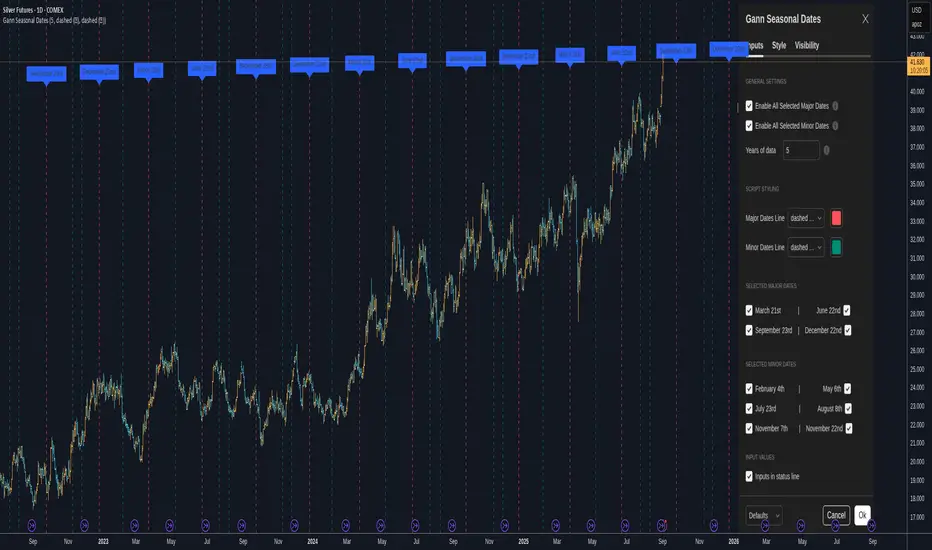
Gann Seasonal Dates - CEGann Seasonal Dates - Community Edition
Welcome to the Gann Seasonal Dates V1.61 - Community Edition, a powerful tool designed to enhance time-based trading with W.D. Gann’s seasonal date methodology. This feature-complete indicator allows traders to plot critical seasonal dates on charts for equities, forex, commodities, and cryptocurrencies. It empowers traders to anticipate market turning points with precision.
Overview
The Gann Seasonal Dates plots Gann’s major and minor seasonal dates, which are rooted in the cyclical nature of solstices, equinoxes, and their midpoints. Major dates include the vernal equinox (March 21st), summer solstice (June 22nd), autumnal equinox (September 23rd), and winter solstice (December 22nd). Minor dates mark the halfway points between these events (February 4th, May 6th, July 23rd, August 8th, November 7th, and November 22nd). With customizable styling and historical data up to 50 years, this script helps traders identify key time-based market events.
Key Features
Major and Minor Seasonal Dates : Plot four major dates (solstices and equinoxes) and six minor dates (midpoints) to highlight potential market turning points.
Customizable Date Selection : Enable or disable individual major and minor dates to focus on specific cycles relevant to your analysis.
Historical Data Range : Adjust the lookback period up to 50 years, with recommendations for optimal performance based on your TradingView plan (5 years for Basic, 20 for Pro/Pro+/Premium).
Styling Options : Customize line styles (solid, dotted, dashed) and colors for major and minor dates to enhance chart clarity.
Labeled Visuals : Each plotted date includes a label with a tooltip (e.g., "Vernal equinox") for easy identification and context.
How It Works
Configure Settings : Enable major and/or minor dates and select specific dates (e.g., March 21st, February 4th) to display on your chart.
Set Historical Range : Adjust the years of data (up to 50) to plot historical seasonal dates, ensuring compatibility with your TradingView plan’s processing limits.
Customize Styling : Choose line styles and colors for major and minor dates to differentiate them visually.
Analyze and Trade : Use the plotted vertical lines and labels to identify potential market turning points, integrating Gann’s time-based cycles into your strategy.
Get Started
As a gift to the TradingView community and Gann traders, the Gann Seasonal Dates - Community Edition is provided free of charge. With no features locked, this tool offers full access to Gann’s seasonal date methodology for precise time-based analysis. Trade wisely and leverage the power of seasonal cycles!
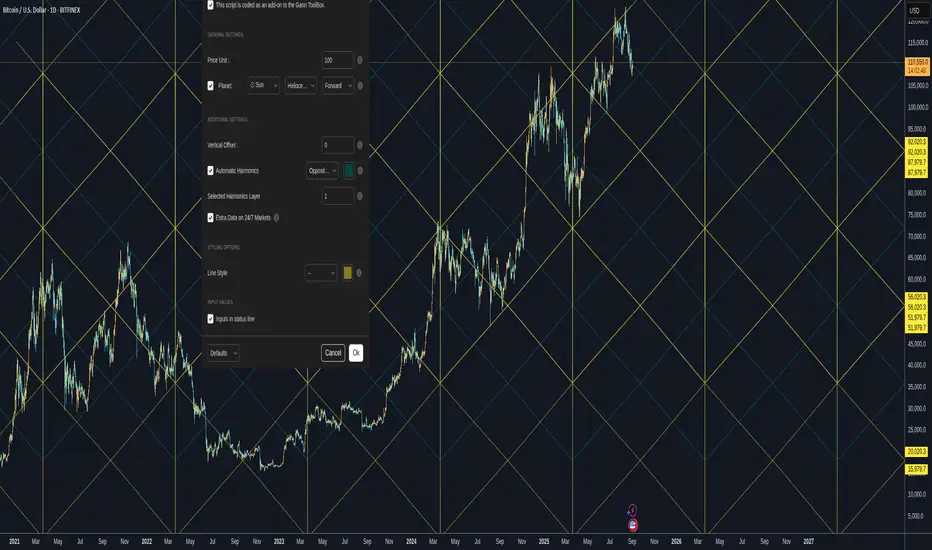
Gann Planetary Lines V1.35 - CEGann Planetary Lines V1.35 - Community Edition
Welcome to the Gann Planetary Lines V1.35 - Community Edition, a powerful tool inspired by W.D. Gann’s astrological trading principles, designed to bring planetary-based price and time analysis to the TradingView community. This feature-complete indicator offers Gann traders and enthusiasts a robust solution for charting planetary influences across equities, forex, commodities, and cryptocurrencies.
Overview
The Gann Planetary Lines V1.35 - Community Edition transforms planetary longitude angles into price levels, leveraging Gann’s methodology to map celestial movements onto financial charts. This script supports plotting lines for the Sun, Moon, Mercury, Venus, Mars, Jupiter, Saturn, Uranus, Neptune, and Pluto, with customizable settings for heliocentric or geocentric perspectives. By integrating harmonic angles and advanced styling options, it provides a comprehensive framework for identifying key price levels and potential market turning points.
Key Features
Planetary Line Projections : Plot lines for ten celestial bodies (Sun, Moon, Mercury, Venus, Mars, Jupiter, Saturn, Uranus, Neptune, Pluto) based on their ecliptic longitudes, offering insights into price-time relationships.
Heliocentric and Geocentric Modes : Switch between heliocentric and geocentric calculations (Pluto is heliocentric-only; Sun and Moon are geocentric).
Customizable Price Unit ($/°) : Adjust the dollar-per-degree value to square planetary lines with your chart’s price scale, ensuring precise alignment.
Harmonic Support : Plot harmonic angles (Opposition, Square, Trine, Sextile, Quintile) with layer selection for multi-level analysis.
Vertical Offset and Styling : Shift lines vertically for custom harmonics and style them with adjustable thickness and colors for clear visualization.
24/7 Market Optimization : Enable extended future data for continuous markets like crypto, enhancing performance and projection accuracy.
Multi-Layer Projections : Display up to nine layers of planetary lines, each offset by 360°, to capture long-term price objectives.
How It Works
Configure Settings : Set the price unit ($/°) to align with your asset’s price action and select a planet from the dropdown menu.
Choose Planetary Mode : Toggle between heliocentric or geocentric modes and enable reverse direction for downward lines.
Enable Harmonics (Optional) : Select desired harmonics (e.g., Square, Trine) and adjust the layer to visualize additional price levels.
Customize Display : Adjust line thickness, color, and vertical offset to enhance chart clarity and match your analysis style.
Analyze and Trade : Use plotted planetary and harmonic lines to identify support, resistance, and potential turning points, integrating Gann’s astrological insights into your trading strategy.
Get Started
As a gift to the TradingView community and Gann traders, the Gann Planetary Lines V1.35 - Community Edition is offered free of charge. No features are locked—enjoy the full power of planetary analysis to enhance your trading. Trade wisely and explore the cosmic edge of Gann’s methodology!
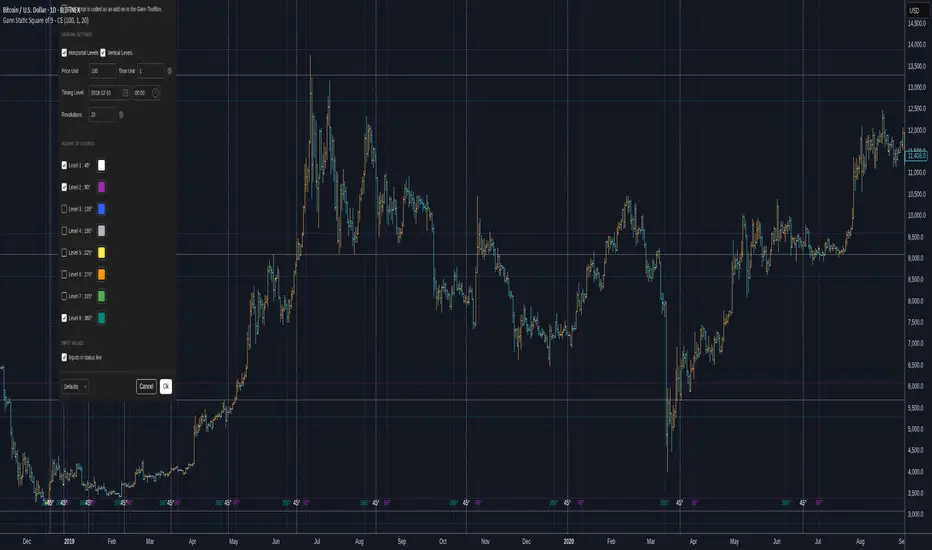
Gann Static Square of 9 - CEGann Static Square of 9 - Community Edition
Welcome to the Gann Static Square of 9 - Community Edition, a meticulously crafted tool designed to empower traders with the timeless principles of W.D. Gann’s Square of 9 methodology. This indicator is tailored for the TradingView community and Gann Traders, providing a robust solution for analyzing price and time dynamics across various markets.
Overview
The Gann Static Square of 9 harnesses the mathematical precision of Gann’s Square of 9 chart, plotting key price and time levels based on a fixed starting point of 1. Unlike its dynamic counterpart , this static version uses a consistent origin, making it ideal for traders seeking to map Gann’s geometric angles (45°, 90°, 135°, 180°, 225°, 270°, 315°, and 360°) with a standardized framework. By adjusting the price and time units, users can tailor the indicator to suit any asset, from equities and forex to commodities and cryptocurrencies.
Key Features
Fixed Starting Point: Begins calculations at a base value of 1, providing a standardized approach to plotting Gann’s Square of 9 levels.
Comprehensive Angle Projections: Plots eight critical Gann angles (45°, 90°, 135°, 180°, 225°, 270°, 315°, and 360°), enabling precise identification of support, resistance, and time-based targets.
Customizable Price and Time Units: Adjust the price unit (Y-axis) and time unit (X-axis) to align with the specific characteristics of your chosen market, ensuring optimal fit for price action and volatility.
Horizontal and Vertical Levels: Enable horizontal price levels to identify key support and resistance zones, and vertical time levels to pinpoint potential market turning points.
Revolution Control: Extend projections across multiple 360° cycles to uncover long-term price and time objectives, with user-defined revolution counts.
Customizable Aesthetics: Assign distinct colors to each angle for enhanced chart clarity and visual differentiation.
and more!
How It Works
Configure Settings: Set the price and time units to match your asset’s characteristics, and select the desired number of revolutions to project future levels.
Enable Levels: Choose which Gann angles (45° to 360°) to display, tailoring the indicator to your analysis needs.
Visualize Key Levels: The indicator plots horizontal price levels and optional vertical time levels, each labeled with its corresponding angle and price/time value.
Analyze and Trade: Leverage the plotted levels to identify critical support, resistance, and time-based turning points, enhancing your trading strategy with Gann’s proven methodology.
Get Started
As a token of appreciation for the TradingView community, and Gann traders, this Community Edition is provided free of charge. Trade safe and enjoy!
Gann Dynamic Square of 9 - CEWelcome to the Gann Dynamic Square of 9 - Community Edition
a powerful and versatile tool designed for traders utilizing W.D. Gann's renowned Square of 9 methodology. Crafted with gratitude for the TradingView community and Gann trading enthusiasts worldwide.
Overview
The Gann Dynamic Square of 9 leverages the mathematical precision of Gann’s Square of 9 chart, plotting key price and time levels based on a user-defined high or low pivot point. Unlike static Square of 9 models, this dynamic version adapts to your chosen anchor point, starting calculations from your selected price level rather than a fixed value. The indicator projects critical angles (45°, 90°, 135°, 180°, 225°, 270°, 315°, and 360°) with a customizable price unit, enabling precise alignment with market dynamics.
Key Features
Customizable Pivot Points : Anchor the Square of 9 to a user-defined high or low price level, allowing for tailored projections of support, resistance, and time-based targets.
Dynamic Angle Projections : Automatically calculates and plots the eight key Gann angles (45°, 90°, 135°, 180°, 225°, 270°, 315°, and 360°) based on your input, with support for multiple revolutions to identify future price and time targets.
Flexible Price Unit : Adjust the price unit to suit any asset, ensuring compatibility across various markets and price scales. Experimentation is encouraged to find the optimal setting for your trading instrument.
Horizontal and Vertical Levels : Enable horizontal price levels and vertical time levels to visualize critical support/resistance zones and time-based turning points.
User-Friendly Interface : Intuitive input options make it easy to configure price units, pivot placement, revolution counts, and more, streamlining your analysis process.
and more!
How It Works
Select Your Pivot: Choose a significant high or low price level to anchor the Square of 9, setting the foundation for all calculations.
Adjust Settings: Customize the price unit, enable/disable specific angles, and select the number of revolutions to match your trading strategy.
Visualize Key Levels: The indicator plots horizontal price levels and optional vertical time levels, each labeled with its corresponding Gann angle and price/time value.
Analyze and Trade: Use the plotted levels to identify potential support, resistance, and time-based turning points, enhancing your market analysis with Gann’s time-tested principles.
Get Started, enjoy, trade wisely, and unlock the power of Gann’s timeless methodology!

Angled Gann Time-Price Squares with S/RThis is a Pine Script indicator that implements Angled Gann Time-Price Squares based on W.D. Gann's trading theory. Here's what it does:
Core Functionality
Detects pivot highs and lows using a configurable lookback period
Creates angled squares by connecting pivot points to current price action when specific geometric conditions are met
Validates square formation by checking if the price movement follows proper Gann angles (typically 45°, 135°, etc.) within a tolerance range
Key Features
Real-time square tracking: Shows both completed squares and forming squares in progress
Support/Resistance levels: Automatically generates S/R lines from:
Square edge extensions
Diagonal extensions (pivot centers)
Quarter/half levels within squares (25%, 50%, 75%)
Visual feedback: Color-coded squares (green for up, red for down, orange for forming)
Projection lines: Predicts where squares might complete based on Gann angle theory
Gann Theory Application
The indicator follows Gann's principle that time and price move in geometric harmony. It looks for price movements that form perfect squares when plotted on a chart, where the diagonal of the square represents the natural flow of price and time at specific angles.
The generated support/resistance levels are particularly valuable because they're based on completed geometric patterns rather than just horizontal price levels, making them potentially more significant according to Gann methodology.
