Square Root Price Calculator By ABPinescript to Calculate Square root of Price usefull for Gann LoverPenunjuk Pine Script®oleh abr23618.trading23
HM2 - Murrey Math Levels# Murrey Math Indicator - Comprehensive Description ## **What is Murrey Math?** Murrey Math is a trading system developed by T.H. Murrey that divides price action into 8 equal segments (octaves) based on Gann and geometry principles. It automatically identifies key support and resistance levels where price is likely to react, making it a powerful tool for determining entry/exit points and price targets. ## **How It Works** The indicator: 1. **Analyzes price history** over a lookback period (default 64-200 bars) 2. **Finds the highest high and lowest low** in that period 3. **Calculates a "fractal"** - a geometric scaling factor based on price magnitude 4. **Creates 8 equal divisions** between key levels, plus 4 overshoot levels (total 13 levels) 5. **Labels each level** from -2/8 to +2/8 with their trading significance ## **The 13 Murrey Math Levels** ### **Core Levels (0/8 to 8/8):** - ** - Ultimate Support** (Blue) - Extreme oversold condition - Strong buying opportunity - Price rarely breaks below this - ** - Weak, Stall & Reverse** (Orange) - Weak support level - Price often stalls and reverses here - ** - Pivot/Reverse Level** (Red) - Major support that can become resistance - Important reversal zone - ** - Bottom of Trading Range - BUY Zone** (Green) - Bottom boundary of normal trading - **Premium BUY zone** - 40% of trading happens between 3/8 and 5/8 - ** - Major Support/Resistance** (Blue) - **THE MOST IMPORTANT LEVEL** - The midpoint - best entry/exit level - Strong pivot point that price respects - ** - Top of Trading Range - SELL Zone** (Green) - Top boundary of normal trading - **Premium SELL zone** - ** - Pivot/Reverse Level** (Red) - Major resistance that can become support - Important reversal zone - ** - Weak, Stall & Reverse** (Orange) - Weak resistance level - Price often stalls and reverses here - ** - Ultimate Resistance** (Blue) - Extreme overbought condition - Strong selling opportunity - Price rarely breaks above this ### **Overshoot Levels:** - ** & ** (Gray) - Extreme downside overshoot zones - ** & ** (Gray) - Extreme upside overshoot zones - These indicate extreme moves beyond normal trading ranges ## **Trading Zones (from your diagram)** 1. **Consolidation Trading Area** (0/8 to 3/8) - Price is in a bearish zone - Look for BUY opportunities near support levels 2. **Normal Trading Area** (3/8 to 5/8) - **40% of trading occurs here** - Price oscillates between these boundaries - Range-bound trading strategies work best 3. **Premium Trading Area** (5/8 to 8/8) - Price is in a bullish zone - Look for SELL opportunities near resistance levels ## **Trading Strategies** ### **Buy Signals:** - Price bounces off 0/8 (ultimate support) - Price pulls back to 3/8 in an uptrend - Price breaks above 4/8 after consolidation ### **Sell Signals:** - Price rejects at 8/8 (ultimate resistance) - Price rallies to 5/8 in a downtrend - Price breaks below 4/8 after consolidation ### **Range Trading:** - Buy near 3/8, sell near 5/8 when price is ranging - Use 4/8 as the pivot to determine trend direction ## **Key Advantages** ✅ **Objective levels** - No subjective placement ✅ **Self-adjusting** - Automatically recalculates based on recent price action ✅ **Clear trading zones** - Easy to identify support/resistance ✅ **Works on all timeframes** - From 1-minute to monthly charts ✅ **Combines with other indicators** - Works well with RSI, MACD, etc. ## **Important Notes** - The indicator is **dynamic** - levels update as new highs/lows form - **4/8 is the most critical level** - price above = bullish, below = bearish - When price reaches overshoot levels (±1/8, ±2/8), expect strong reversals - Works best in trending markets; can give false signals in choppy conditions This geometric approach to support/resistance has been used by traders for decades and remains popular due to its objective, mathematical nature!Penunjuk Pine Script®oleh tiddug_singh92
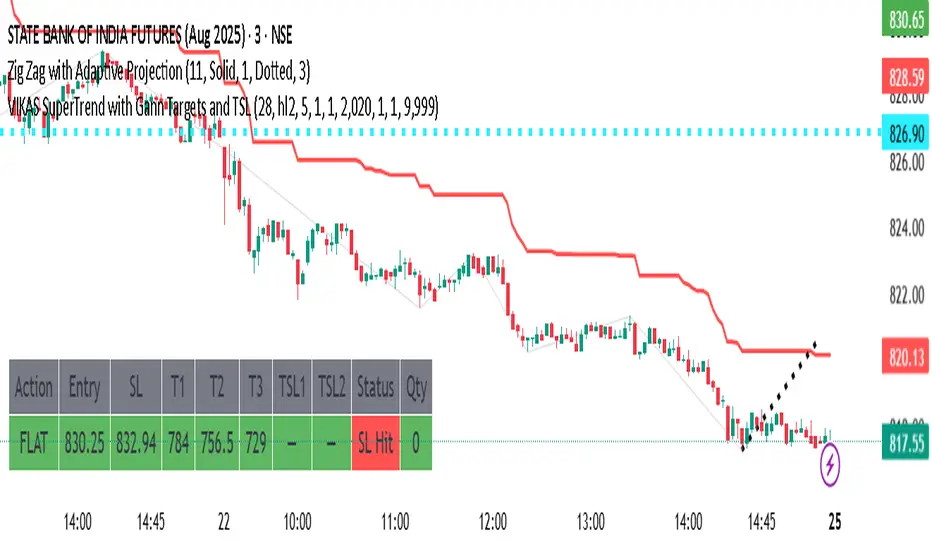
VIKAS SuperTrend with Gann Targets and TSLthis is a trial version of strategy to check alert msgStrategi Pine Script®oleh PERFECTTRADE6898
SITFX_FuturesSpec_v17SITFX_FuturesSpec_v17 – Universal Futures Contract Library Full-scale futures contract specification library for Pine Script v6. Covers CME, CBOT, NYMEX, COMEX, CFE, Eurex, ICE, and more – including minis, micros, metals, energies, FX, and bonds. Key Features: ✅ Instrument‑agnostic: ES/MES, NQ/MNQ, YM/MYM, RTY/M2K, metals, energies, FX, bonds ✅ Full contract data: Tick size, tick value, point value, margins ✅ Continuation‑safe: Single‑line logic, no arrays or continuation errors ✅ Foundation for SITFX tools: Gann, Fibs, structure, and risk modules Usage example: import SITFX_FuturesSpec_v17/1 as fs spec = fs.get(syminfo.root) label.new(bar_index, high, str.format("{0}: Tick={1}, Value=${2}", spec.name, spec.tickSize, spec.tickValue)) Perpustakaan Pine Script®oleh SolvereTelah dikemas kini 1
BK AK-SILENCER (P8N)🚨Introducing BK AK-SILENCER (P8N) — Institutional Order Flow Tracking for Silent Precision🚨 After months of meticulous tuning and refinement, I'm proud to unleash the next weapon in my trading arsenal—BK AK-SILENCER (P8N). 🔥 Why "AK-SILENCER"? The True Meaning Institutions don’t announce their moves—they move silently, hidden beneath the noise. The SILENCER is built specifically to detect and track these stealth institutional maneuvers, giving you the power to hunt quietly, execute decisively, and strike precisely before the market catches on. 🔹 "AK" continues the legacy, honoring my mentor, A.K., whose teachings on discipline, precision, and clarity form the cornerstone of my trading. 🔹 "SILENCER" symbolizes the stealth aspect of institutional trading—quiet but deadly moves. This indicator equips you to silently track, expose, and capitalize on their hidden footprints. 🧠 What Exactly is BK AK-SILENCER (P8N)? It's a next-generation Cumulative Volume Delta (CVD) tool crafted specifically for traders who hunt institutional order flow, combining adaptive volatility bands, enhanced momentum gradients, and precise divergence detection into a single deadly-accurate weapon. Built for silent execution—tracking moves quietly and trading with lethal precision. ⚙️ Core Weapon Systems ✅ Institutional CVD Engine → Dynamically measures hidden volume shifts (buying/selling pressure) to reveal institutional footprints that price alone won't show. ✅ Adaptive AK-9 Bollinger Bands → Bollinger Bands placed around a custom CVD signal line, pinpointing exactly when institutional accumulation or distribution reaches critical extremes. ✅ Gradient Momentum Intelligence → Color-coded momentum gradients reveal the strength, speed, and silent intent behind institutional order flow: 🟢 Strong Bullish (aggressive buying) 🟡 Moderate Bullish (steady accumulation) 🔵 Neutral (balance) 🟠 Moderate Bearish (quiet distribution) 🔴 Strong Bearish (aggressive selling) ✅ Silent Divergence Detection → Instantly spots divergence between price and hidden volume—your earliest indication that institutions are stealthily reversing direction. ✅ Background Flash Alerts → Visually highlights institutional extremes through subtle background flashes, alerting you quietly yet powerfully when market-moving players make their silent moves. ✅ Structural & Institutional Clarity → Optional structural pivots, standard deviation bands, volume profile anchors, and session lines clearly identify the exact levels institutions defend or attack silently. 🛡️ Why BK AK-SILENCER (P8N) is Your Edge 🔹 Tracks Institutional Footprints—Silently identifies hidden volume signals of institutional intentions before they’re obvious. 🔹 Precision Execution—Cuts through noise, allowing you to execute silently, confidently, and precisely. 🔹 Perfect for Traders Using: Elliott Wave Gann Methods (Angles, Squares) Fibonacci Time & Price Harmonic Patterns Market Profile & Order Flow Analysis 🎯 How to Use BK AK-SILENCER (P8N) 🔸 Institutional Reversal Hunting (Stealth Mode) Bearish divergence + CVD breaking below lower BB → stealth short signal. Bullish divergence + CVD breaking above upper BB → quiet, early long entry. 🔸 Momentum Confirmation (Silent Strength) Strong bullish gradient + CVD above upper BB → follow institutional buying quietly. Strong bearish gradient + CVD below lower BB → confidently short institutional selling. 🔸 Noise Filtering (Patience & Precision) Neutral gradient (blue) → remain quiet, wait patiently to strike precisely when institutional activity resumes. 🔸 Structural Precision (Institutional Levels) Optional StdDev, POC, Value Areas, Session Anchors clearly identify exact institutional defense/offense zones. 🙏 Final Thoughts Institutions move in silence, leaving subtle footprints. BK AK-SILENCER (P8N) is your specialized weapon for tracking and hunting their quiet, decisive actions before the market reacts. 🔹 Dedicated in deep gratitude to my mentor, A.K.—whose silent wisdom shapes every line of code. 🔹 Engineered for the disciplined, quiet hunter who knows when to wait patiently and when to strike decisively. Above all, honor and gratitude to Gd—the ultimate source of wisdom, clarity, and disciplined execution. Without Him, markets are chaos. With Him, we move silently, purposefully, and precisely. ⚡ Stay Quiet. Stay Precise. Hunt Silently. 🔥 BK AK-SILENCER (P8N) — Track the Silent Moves. Strike with Precision. 🔥 May Gd bless every silent step you take. 🙏Penunjuk Pine Script®oleh Ki11a_B22159
MTF Pivot Fib Speed Resistance FansOverview This Pine Script indicator, titled "MTF Pivot Fib Speed Resistance Fans", is a multi-timeframe tool that automatically plots Fib Speed Resistance Fan lines based on pivot structures derived from higher timeframes. It mirrors the functionality of TradingView’s built-in “Fib Speed Resistance Fan” drawing tool, but in a dynamic, programmatic way. It uses pivot highs and lows to anchor fan projections, drawing forward-facing trend lines that align with well-known Fibonacci ratios and their extensions. Pivot Detection Logic The script identifies pivots by comparing the current bar’s high and low against the highest and lowest prices over a user-defined pivot period. This pivot detection occurs on a higher timeframe of your choice, giving a broader and more strategic view of price structure. The script tracks direction changes in the pivot trend and stores only the most recent few pivots to maintain clean and meaningful fan drawings. Fan Direction Control The user can select whether to draw fans for "Buys", "Sells", or "Both". The script only draws fan lines when a new directional move is detected based on the pivot structure and the selected bias. For example, in “Buys” mode, a rising pivot followed by another higher low will trigger upward fan projections. Fib Speed Resistance Levels Once two pivots are identified, the script draws multiple fan lines from the first pivot outward, at angles defined by a preset list of Fibonacci levels. These fan lines help visualize speed and strength of a price move. The script also draws a horizontal line from the pivot for additional confluence at the base level (1.0). Price Level Plotting In addition to drawing fan lines, the indicator also plots their price levels on the right-hand price scale. This makes it easier for users to visually reference the projected support and resistance levels without needing to trace the lines manually across the chart. Mapping to TradingView’s "Fib Speed Resistance Fan" The expanded set of values used in this script is not arbitrary—they closely align with the default and extended levels available in TradingView's built-in "Fib Speed Resistance Fan" tool. TradingView’s Fib Fan tool offers several levels by default, including traditional Fibonacci ratios like 0.382, 0.5, 0.618, and 1. However, if you right-click the tool and open its settings, you’ll find additional toggles for levels like 1.618, 2.000, 2.618, and even 4.000. These deeper levels are used to project stronger trend continuations beyond the standard retracement zones. The inclusion of levels such as 0.25, 0.75, and 1.34 reflects configurations that are available when you manually add or customize levels in TradingView’s fan tool. While 1.34 is not a canonical Fibonacci ratio, it is often found in hybrid Gann/Fib methods and is included in some preset templates in TradingView’s drawing tool for advanced users. By incorporating these levels directly into the Pine Script, the indicator faithfully reproduces the fan structure users would manually draw using TradingView’s graphical Fib Fan tool—but does so programmatically, dynamically, and with multi-timeframe control. This eliminates manual errors, allows for responsive updating, and adds custom visual tracking via the price scale. These values are standardized within the context of TradingView's Fib Fan tool and not made up. This script automates what the manual drawing tool achieves, with added precision and flexibility.Penunjuk Pine Script®oleh gggoaaatTelah dikemas kini 11102
BK AK-Scope🔭 Introducing BK AK-Scope — Target Locked. Signal Acquired. 🔭 After building five precision weapons for traders, I’m proud to unveil the sixth. BK AK-Scope — the eye of the arsenal. This is not just an indicator. It’s an intelligence system for volatility, signal clarity, and rate-of-change dynamics — forged for elite vision in any market terrain. 🧠 Why “Scope”? And Why “AK”? Every shooter knows: you can’t hit what you can’t see. The Scope brings range, clarity, and target distinction. It filters motion from noise. Purpose from panic. “AK” continues to honor the man who trained my sight — my mentor, A.K. His discipline taught me to wait for alignment. To move with reason, not emotion. His vision lives in every code line here. 🔬 What Is BK AK-Scope? A Triple-Tier TSI Correlation Engine, fused with adaptive opacity logic, a volatility scoring system, and real-time signal clarity. It’s momentum dissected — by speed, depth, and rate of change. Built to serve traders who: Need visual hierarchy between fast, mid, and slow TSI responses. Want adaptive fills that pulse with volatility — not static zones. Require a volatility scoring overlay that reads the battlefield in real time. ⚙️ Core Systems: How BK AK-Scope Works ✅ Fast/Mid/Slow TSI → Three layers of correlation: like scopes with zoom levels. You track micro moves, mid swings, and macro flow simultaneously. ✅ Rate-of-Change Adaptive Opacity → Momentum fills fade or flash based on speed — giving you movement density at a glance. Bull vs. Bear zones adapt to strength. You feel the market’s pulse. ✅ Volatility Score Intelligence → Custom algorithm measuring: Range expansion Rate-of-change differentials ATR dynamics Standard deviation pressure All combined into a score from 0–100 with live icons: 🔥 = Extreme Heat (70+) 🧊 = Cold Zone (<30) ⚠️ = ROC Warning • = Neutral drift ✅ Auto-Detect Volatility Modes → Scalp = <15min Swing = intraday/hourly Macro = daily/weekly Or override manually with total control. 🎯 How To Use BK AK-Scope 🔹 Trend Continuation → When all three TSI layers align in direction + volatility score climbs, ride with the trend. 🔹 Early Reversals → Opposing TSI + rapid opacity change + volatility shift = sniper reversal zone. 🔹 Consolidation Filter → Neutral fills + score < 30 = stay out, wait for signal surge. 🔹 Signal Confluence → Pair with: • Gann fans or angles • Fib time/price clusters • Elliott Wave structure • Harmonics or divergence To isolate entry perfection. 🛡️ Why This Indicator Changes the Game It's not just momentum. It’s TSI with depth hierarchy. It’s not just color. It’s real-time strength visualization. It’s not just volatility. It’s rate-weighted market intelligence. This is market optics for the advanced trader — built for vision, clarity, and discipline. 🙏 Final Thoughts 🔹 In honor of A.K., my mentor. The man who taught me to see what others miss. 🔹 Inspired by the power of vision — because execution without clarity is chaos. 🔹 Powered by faith — because Gd alone gives sight beyond the visible. “He gives sight to the blind and wisdom to the humble.” — Psalms 146 Every tool I build is a prayer in code — that it helps someone trade with clarity, integrity, and precision. ⚡ Zoom In. Focus Deep. Trade Clean. BK AK-Scope — Lock on the target. See what others don’t. 🔫 Clarity is power. 🔫 Gd bless. 🙏Penunjuk Pine Script®oleh Ki11a_BTelah dikemas kini 121
BK AK-47 Divergence🚨 Introducing BK AK-47 Divergence — Multi-Timeframe Precision Firepower for True Traders 🚨 After months of development, I’m proud to release my fifth weapon in the arsenal — BK AK-47 Divergence. 💥 Why “AK-47”? The Meaning Behind the Name The AK-47 isn’t just a rifle. It’s the symbol of reliability, versatility, and raw stopping power. It performs in every environment — from the mud to the mountains — just like this indicator cuts through noise on any timeframe, any asset, any condition. 🔸 “AK” honors the same legacy as before — my mentor, A.K., whose discipline and vision forged my trading edge. 🔸 “47” signifies layered precision: 4 = structure, 7 = spiritual completion. Together, it’s the weapon of divine order that adapts, reacts, and strikes with purpose. 🔍 What Is BK AK-47 Divergence? It’s a next-generation divergence detector — a smart hybrid of MACD, Bollinger Bands, and multi-timeframe divergence logic wrapped in a custom volatility engine and real-time flash alerts. Designed for snipers in the market — those who only take the highest-probability shots. ⚙️ Core Weapon Systems ✅ MACD + BB Precision Overlay → MACD plotted inside dynamic Bollinger Bands — reveals hidden pressure zones where most indicators fail. ✅ Smart Histogram Scaling → Adaptive amplification based on volatility. No more weak histograms in strong markets. ✅ Full Multi-Timeframe Divergence Detection: 🔻 Current TF Divergence 🕐 Higher TF Divergence ⏱️ Lower TF Divergence Each plotted with clean visual alerts, color-coded by direction and timeframe. You get instant divergence recognition across dimensions. ✅ Background Flash Alerts → When MACD hits BB extremes, the background lights up in red or green. Eyes instantly lock in on key moments. ✅ Advanced Pivot Lookback Control → New lookback system compares multiple pivot layers, not just the last swing. This gives true structural divergence, not just noise. ✅ Dynamic Fill Zones: 🔴 Oversold 🟢 Overbought 🔵 Neutral Built to filter false signals and highlight hidden edge. 🛡️ Why This Indicator Changes the Game 🔹 Built for divergence snipers — not lagging MACD watchers. 🔹 Perfect for traders who sync with: • Elliott Waves • Fibonacci Time/Price Clusters • Harmonic Patterns • Gann Angles or Squares • Price Action & Trendlines 🔹 Lets you visually map: • Converging divergences (multi-TF confirmation) • High-volatility histograms in low-volatility price zones (entry sweet spots) • Flash-momentum warnings at BB pressure zones 🎯 How to Use BK AK-47 Divergence 🔹 Breakout Confirmation → MACD breaches upper BB with bullish divergence = signal to ride momentum. 🔹 Mean Reversion Reversals → MACD breaks lower BB + bullish div = setup for sniper long. 🔹 Top/Bottom Detection → Bearish divergence + MACD failure at upper BB = early reversal signal. 🔹 TF Sync Strategy → Align current TF with higher or lower divergences for laser-confirmed entries. 🧠 Final Thoughts This isn’t just a divergence tool. It’s a battlefield reconnaissance system — one that lets you see when, where, and why the next pivot is forming. 🔹 Built in honor of the AK-legacy — reliability, discipline, and firepower. 🔹 Designed to cut through noise, expose structure, and alert you to what really matters. 🔹 Crafted for those who trade with intent, vision, and respect for the craft. 🙏 And most importantly: All glory to Gd — the One who gives wisdom, clarity, and purpose. Without Him, the markets are chaos. With Him, we move in structure, order, and divine timing. — ⚡ Stay dangerous. Stay precise. Stay aligned. 🔥 BK AK-47 Divergence — Locked. Loaded. Laser-focused. 🔥 May the markets bend to your discipline. Gd bless. 🙏Penunjuk Pine Script®oleh Ki11a_BTelah dikemas kini 1185
Yearly History Calendar-Aligned Price up to 10 Years)Overview This indicator helps traders compare historical price patterns from the past 10 calendar years with the current price action. It overlays translucent lines (polylines) for each year’s price data on the same calendar dates, providing a visual reference for recurring trends. A dynamic table at the top of the chart summarizes the active years, their price sources, and history retention settings. Key Features Historical Projections Displays price data from the last 10 years (e.g., January 5, 2023 vs. January 5, 2024). Price Source Selection Choose from Open, Low, High, Close, or HL2 ((High + Low)/2) for historical alignment. The selected source is shown in the legend table. Bulk Control Toggles Show All Years : Display all 10 years simultaneously. Keep History for All : Preserve historical lines on year transitions. Hide History for All : Automatically delete old lines to update with current data. Individual Year Settings Toggle visibility for each year (-1 to -10) independently. Customize color and line width for each year. Control whether to keep or delete historical lines for specific years. Visual Alignment Aids Vertical lines mark yearly transitions for reference. Polylines are semi-transparent for clarity. Dynamic Legend Table Shows active years, their price sources, and history status (On/Off). Updates automatically when settings change. How to Use Configure Settings Projection Years : Select how many years to display (1–10). Price Source : Choose Open, Low, High, Close, or HL2 for historical alignment. History Precision : Set granularity (Daily, 60m, or 15m). Daily (D) is recommended for long-term analysis (covers 10 years). 60m/15m provides finer precision but may only cover 1–3 years due to data limits. Adjust Visibility & History Show Year -X : Enable/disable specific years for comparison. Keep History for Year -X : Choose whether to retain historical lines or delete them on new year transitions. Bulk Controls Show All Years : Display all 10 years at once (overrides individual toggles). Keep History for All / Hide History for All : Globally enable/disable history retention for all years. Customize Appearance Line Width : Adjust polyline thickness for better visibility. Colors : Assign unique colors to each year for easy identification. Interpret the Legend Table The table shows: Year : Label (e.g., "Year -1"). Source : The selected price type (e.g., "Close", "HL2"). Keep History : Indicates whether lines are preserved (On) or deleted (Off). Tips for Optimal Use Use Daily Timeframes for Long-Term Analysis : Daily (1D) allows 10+ years of data. Smaller timeframes (60m/15m) may have limited historical coverage. Compare Recurring Patterns : Look for overlaps between historical polylines and current price to identify potential support/resistance levels. Customize Colors & Widths : Use contrasting colors for years you want to highlight. Adjust line widths to avoid clutter. Leverage Global Toggles : Enable Show All Years for a quick overview. Use Keep History for All to maintain continuity across transitions. Example Workflow Set Up : Select Projection Years = 5. Choose Price Source = Close. Set History Precision = 1D for long-term data. Customize : Enable Show Year -1 to Show Year -5. Assign distinct colors to each year. Disable Keep History for All to ensure lines update on year transitions. Analyze : Observe how the 2023 close prices align with 2024’s price action. Use vertical lines to identify yearly boundaries. Common Questions Why are some years missing? Ensure the chart has sufficient historical data (e.g., daily charts cover 10 years, 60m/15m may only cover 1–3 years). How do I update the data? Adjust the Price Source or toggle years/history settings. The legend table updates automatically. Penunjuk Pine Script®oleh ashyphoenix33
BK AK-9I am incredibly proud to introduce my fourth indicator to the TradingView community: BK AK-9 — a next-level momentum-volatility hybrid, built for traders who demand precision. 🔥 Why “AK-9”? The Meaning Behind the Name This indicator is deeply personal to me. The “AK” in the name represents the initials of my mentor — the man whose guidance shaped my journey in trading, discipline, and strategy. His wisdom is woven into every line of code, every design choice, and every purpose behind this tool. The “9” holds its own powerful meaning: 9 is the number of completion and breakthrough — the moment where preparation meets opportunity. The AK-9 weapon itself is a suppressed variant of the legendary AK platform, built for stealth, precision, and maximum impact in close-quarters combat. It’s quiet, adaptive, and deadly effective — just like this indicator cuts through market noise, adapts to volatility, and pinpoints moments of maximum opportunity. ✨ About the BK AK-9 Indicator The BK AK-9 is not just an oscillator. It’s a multi-layered trading weapon combining: ✅ RSI → Stochastic → Bollinger Bands on Stoch RSI → momentum measured inside volatility. ✅ Dynamic or Static Background Flash → when extremes hit, you get instant visual alerts. ✅ Color-coded %K zones → 🔴 Red: oversold 🟢 Green: overbought 🔵 Blue: neutral ✅ Volatility-adaptive bands → instead of relying on static levels, the bands expand and contract dynamically using standard deviation. 🛡️ Why This Indicator Matters Pinpoints exhaustion zones statistically, not emotionally. Confirms breakouts with volatility evidence, not just price action. Filters noise and helps you wait for high-probability setups. Gives you visual edge with color-coded momentum and background flash. Perfect for: 🔹 Breakout traders confirming momentum surges. 🔹 Mean-reversion traders catching exhaustion pivots. 🔹 Swing traders using multi-layered momentum analysis. 🔹 Momentum traders hunting volatility-backed entries. 💥 How to Use BK AK-9 Breakout Confirmation → when Stoch RSI breaks above upper Bollinger Band (green zone, flash ON), ride the trend. Mean Reversion Trades → when Stoch RSI drops below lower Bollinger Band (red zone, flash ON), look for reversals. Noise Filtering → stay patient inside the blue zone, wait for extremes. Advanced Sync → align it with Gann levels, harmonic patterns, Fibonacci clusters, or Elliott waves for maximum edge. 🙏 Final Thoughts This isn’t just another tool — it’s a weapon in your trading arsenal. 🔹 Dedicated to my mentor, A.K., whose wisdom and legacy guide my work. 🔹 Designed around the number 9, the number of completion, transition, and breakthrough. 🔹 Built to help traders act with precision, discipline, and clarity. But above all, I give praise and glory to Gd — the true source of wisdom, insight, and success. Markets will test your patience and your skill, but faith tests your soul. Through every challenge, every victory, and every setback, Gd remains the constant. This tool is simply another way to use the gifts He has given — to help others rise. ⚡ Stay Ready, Stay Sharp The markets are a battlefield. But with the right tools, the right strategy, and the right mindset — you will always stay 10 steps ahead. 🔥 Stay locked. Stay loaded. Trade with precision. 🔥 Gd bless, and may He guide us all to wisdom and success. 🙏Penunjuk Pine Script®oleh Ki11a_BTelah dikemas kini 2275
SemaforThis is the 4 Level Semafor indicator with Daily Open Line and Average Session Range. Also on the chart is the EMA Ribbon indicator. Credit to: Devlucem for the Semafor indicator Quantvue for the Average Session Range Shusterivi for the Daily Open Line MYNAMEISBRANDON for the EMA Ribbon The Semafors are based on the ZigZag indicator and show higher highs/lower lows of a specified period, determined by the user and applied in settings. The default periods I use are: 10 period (hidden on this chart) 50 period-blue dots 250 period-white dots 615 period-black dots Just as the ZigZag indicator will recalculate so to will the semafors, as additional candles are built. The semafor indicator is never to be used as a stand alone signal. It must be combined with other indicators to be used effectively. What we look for are the semafor patterns of a large white dot followed by a 1st blue dot opposite of the white. Then a 2nd blue dot in agreement with the white dot. In theory, the 2nd blue dot is seen as confirmation of the establishment of the white semafor.. When combined with Daily Open Line, ADR (Average Sessions Range), EMA cross and VWAP anchored to your 250 semafors, your odds are greatly increased. Add to that the knowledge of basic market structure and the wisdom that comes from patience and you have a very powerful weapon. The Daily Open...I trade the M1 chart and also draw a H4 Open Line on my chart for the smaller time frames. Price will tend to trade away from the Daily Open Line. In many cases until it reaches certain levels...Fib, Gann, ADR, etc., then runs through a pullback cycle. I like the ADR levels. The ADR can give clues when entering a consolidation phase, ie trading between the buy side and sell side 15% levels. Trading away from the Daily Open(or H4 open) along with breaking the 15% level, while in agreement with a semafor pattern is a good sign. Add to that confluence the agreement of your MA cross and the 250 semafor Anchored VWAP and you have a solid signal to help determine your actions. This trend following layout will work on any time frame. I just really like the M1 for its precision, not for crazy back and forth all day. With the exception of some strong pull back signals, I don't enter any more trades on the M1 than on M5, 15 or 30. This is based on and follows the teachings of Xard and his trading strategy. Just as I don't want to take anyone's credit for these indicators, I won't take credit for what I have been taught either. The trader can obviously use their favorite MA cross indicator. But this one is visually beautiful AND displays the current time frame and 1 time frame higher on the chart...awesome! Of note, I do run into trouble at times with the 615 period semafor. I have been told it is because TradingView has trouble with extended period indicators. As a matter of fact, I would like a much higher period for my biggest semafor. I would like it set at 1250, but that seems to be a no starter. If anyone has a solution, that would be welcomed news. Penunjuk Pine Script®oleh IMDave88197
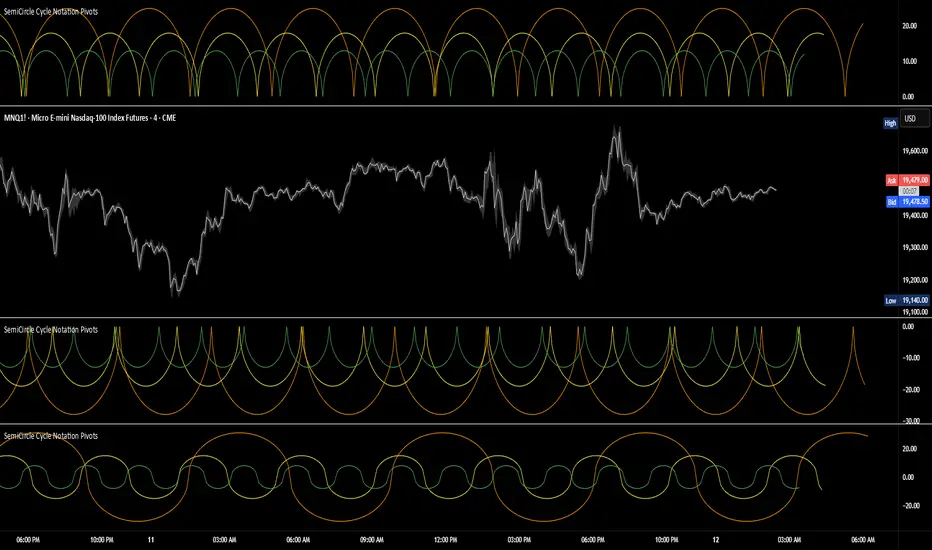
SemiCircle Cycle Notation PivotsFor decades, traders have sought to decode the rhythm of the markets through cycle theory. From the groundbreaking work of HM Gartley in the 1930s to modern-day cycle trading tools on TradingView, the concept remains the same: markets move in repeating waves with larger cycles influencing smaller ones in a fractal-like structure, and understanding their timing gives traders an edge to better anticipate future price movements🔮. Traditional cycle analysis has always been manual, requiring traders to painstakingly plot semicircles, diamonds, or sine waves to estimate pivot points and time reversals. Drawing tools like semicircle & sine wave projections exist on TradingView, but they lack automation—forcing traders to adjust cycle lengths by eye, often leading to inconsistencies. This is where SemiCircle Cycle Notation Pivots indicator comes in. Semicircle cycle chart notation appears to have evolved as a practical visualization tool among cycle theorists rather than being pioneered by a single individual; some key influences include HM Gartley, WD Gann, JM Hurst, Walter Bressert, and RayTomes. Built upon LonesomeTheBlue's foundational ZigZag Waves indicator , this indicator takes cycle visualization to the next level by dynamically detecting price pivots and then automatically plotting semicircles based on real-time cycle length calculations & expected rhythm of price action over time. Key Features: Automated Cycle Detection: The indicator identifies pivot points based on your preference—highs, lows, or both—and plots semicircle waves that correspond to Hurst's cycle notation. Customizable Cycle Lengths: Tailor the analysis to your trading strategy with adjustable cycle lengths, defaulting to 10, 20, and 40 bars, allowing for flexibility across various timeframes and assets. Dynamic Wave Scaling: The semicircle waves adapt to different price structures, ensuring that the visualization remains proportional to the detected cycle lengths and aiding in the identification of potential reversal points. Automated Cycle Detection: Dynamically identifies price pivot points and automatically adjusts offsets based on real-time cycle length calculations, ensuring precise semicircle wave alignment with market structure. Color-Coded Cycle Tiers: Each cycle tier is distinctly color-coded, enabling quick differentiation and a clearer understanding of nested market cycles. Penunjuk Pine Script®oleh BarefootJoey33207
M & W Checklistindicator to Validate & Grade M & W Patterns. Indicator Inputs Table Color Palette • Position Valid : Positions the Valid Trade table on the chart. • Position Grade : Positions the Grade table on the chart, hover over the Column 1 Row 1 for a description of the bands. • Size: Text size for all tables. • Text Color : Sets text color. • Border Color : Sets the table border color for all tables. • Background Color : Sets table backgroud color for all tables. Valid Trade Table Checkboxes to indicate if the trade is valid. Fail is displayed if unchecked, Pass if checked. Grade Table • S/R Level 1: distance between neckline and 1st resistance area in % of the total distance between neckline and take profit. This is not for road blocks but pivot points etc before the initial run up/down in price. I have this set to 30% , this means that if there is a pivot point between the neckline and 30% of the TP level I weight it negatively. • S/R Level 2: distance between neckline and 1st resistance area in % of the total distance between neckline and take profit. This is not for road blocks but pivot points etc before the initial run up/down in price. I have this set to 50% , this means that if there is a pivot point between the neckline and 50% of the TP level 2 weight it negatively but less so than level 1. • S/R Level 3: distance between neckline and 1st resistance area in % of the total distance between neckline and take profit. This is not for road blocks but pivot points etc before the initial run up/down in price. I have this set to 70% , this means that if there is a pivot point between the neckline and 70% of the TP level 3 weight it negatively but less so than level 1 & level 2. • Checkboxes are self explanatory, they are binary options, all are weighted negatively if checked and are weighted positively if unchecked. Divergence values for weighting are neutral if unckecked & weighted positively if checked. • The select options are neutral weighting if set to neutral , if set to For its weighted positive and set to Against weighted negatively. Technical Specification of the Scoring and Band System Overview The scoring system is designed to evaluate a set of technical trade conditions, assigning weights to various criteria that influence the quality of the trade. The system calculates a total score based on both positive and negative conditions. Based on the final score, the system assigns a grade or band (A, B, or C) for positive scores, and a "Negative" label for negative scores. Scoring System The system calculates the score by evaluating a set of 12 conditions (gradeCondition1 to gradeCondition12). These conditions are manually input by the user via checkboxes or dropdowns in a technical indicator (written in Pine Script for TradingView). The score weights vary according to the relative importance of each condition. Condition Breakdown and Weighting: 1. Divergences (GradeCondition1 & GradeCondition2): ◦ 1H Divergence: +5 points if condition is true. ◦ 4H Divergence: +10 points if condition is true (stronger weight than 1H). 2. Support/Resistance at Neckline (GradeCondition3): ◦ Negative if present: -15 points if true (carries significant negative weight). 3. RB near Entry (GradeCondition4): ◦ Very Negative: -20 points if true (this is a critical negative condition). 4. RB can Manage (GradeCondition5): ◦ Slightly Negative: -5 points if true. 5. Institutional Value Zones (GradeCondition6 to GradeCondition8): ◦ For the trade: +5 points. ◦ Against the trade: -5 points. ◦ Neutral: 0 points. 6. S/R between Neckline & Targets (GradeCondition9 to GradeCondition11): ◦ Level 1: -10 points if true, +7 points if false. ◦ Level 2: -7 points if true, +7 points if false. ◦ Level 3: -5 points if true, +7 points if false. ◦ Use fib tool or Gann Box to measure any S/R levels setup according to your preferences. 7. News Timing (GradeCondition12): ◦ News within 3 hours: -20 points if true (strong negative factor). ◦ No upcoming news: +10 points if false. Scoring Calculation Formula: totalScore = score1 + score2 + score3 + score4 + score5 + score6 + score7 + score8 + score9 + score10 + score11 + score12 Where: • score1 to score12 represent the points derived from the conditions described above. Coloring and Visual Feedback: • Positive Scores: Displayed in green. • Negative Scores: Displayed in red. Band System The Band System classifies the total score into different grades, depending on the final value of totalScore. This classification provides an intuitive ranking for trades, helping users quickly assess trade quality. Band Classification: • Band A: If the totalScore is 41 or more. ◦ Represents a highly favorable trade setup. • Band B: If the totalScore is between 21 and 40. ◦ Represents a favorable trade setup with good potential. • Band C: If the totalScore is between 1 and 20. ◦ Represents a trade setup that is acceptable but may have risks. • Negative: If the totalScore is 0 or less. ◦ Represents a poor trade setup with significant risks or unfavorable conditions. Band Calculation Logic (in Pine Script): var string grade = "" if (totalScore >= 41) grade := "Band A" else if (totalScore >= 21) grade := "Band B" else if (totalScore >= 1) grade := "Band C" else grade := "Negative" Technical Key Points: • Highly Negative Conditions: ◦ The system penalizes certain conditions more heavily, especially those that suggest significant risks (e.g., News in less than 3 hours, RB near Entry). • Positive Trade Conditions: ◦ Divergences, Institutional Value Zones in favor of the trade, and lack of significant nearby resistance all contribute positively to the score. • Flexible System: ◦ The system can be adapted or fine-tuned by adjusting the weights of individual conditions according to trading preferences. Use Case Example: • If a trade has 1H and 4H Divergence, RB near Entry (negative), and no upcoming news: ◦ 1H Divergence: +5 points. ◦ 4H Divergence: +10 points. ◦ RB near Entry: -20 points. ◦ No news: +10 points. ◦ Total Score: 5 + 10 - 20 + 10 = 5 → Band C. This modular and flexible scoring system allows traders to systematically evaluate trades and quickly gauge the trade's potential based on technical indicators Summary: Maximum Score: 61 Minimum Score: -97 These are the bounds of the score range based on the current logic of the script. Penunjuk Pine Script®oleh socrates196112
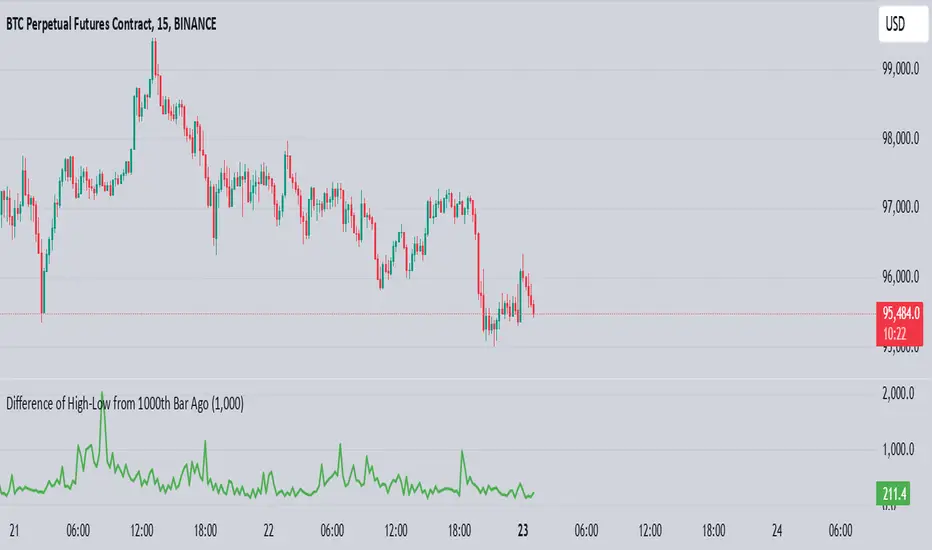
High-Low of X BarOverview The High-Low of X Bar indicator allows traders to visualize historical high and low values from a specific number of bars ago directly on the chart. Provides insight into past price action by displaying high, low, and their difference at the most recent bar. Customizable inputs and color settings for labels enhance usability and visual integration with your chart. Key Features Historical Data Analysis: Displays the high, low, and the difference between these values from a specified number of bars ago. Customizable Inputs: Set the number of bars ago to review historical price points, with a range from 1 to 2000 bars. Premium users can exceed this range. Dynamic Labeling: Option to show high, low, and difference values as labels on the chart, with customizable text and background colors. Color Customization: Customize label colors for high, low, and difference values, as well as for cases with insufficient bars. Inputs Number of Bars Ago: Enter the number of bars back from the current bar to analyze historical high and low values. Show High Value: Toggle to display the historical high value. Show Low Value: Toggle to display the historical low value. Show Difference Value: Toggle to display the difference between high and low values. Color Settings High Label Background Color: Set the background color of the high value label. High Label Text Color: Choose the text color for the high value label. Low Label Background Color: Set the background color of the low value label. Low Label Text Color: Choose the text color for the low value label. Difference Label Background Color: Set the background color of the difference label. Difference Label Text Color: Choose the text color for the difference label. Not Enough Bars Label Background Color: Set the background color for the label shown when there are insufficient bars. Not Enough Bars Label Text Color: Choose the text color for the insufficient bars label. Usage Instructions Add to Chart: Apply the High-Low of X Bar indicator to your TradingView chart. Configure Settings: Adjust the number of bars ago and display options according to your analysis needs. Customize Appearance: Set the colors for the labels to match your chart's style. Analyze: Review the high, low, and their difference directly on your chart for immediate insights into past price movements. Notes Ensure your chart has sufficient historical data for the indicator to function properly. Customize label visibility and colors based on your preference and trading strategy. Penunjuk Pine Script®oleh sam-austinTelah dikemas kini 81
[AIO] Multi Collection Moving Averages 140 MA TypesAll In One Multi Collection Moving Averages. Since signing up 2 years ago, I have been collecting various Сollections. I decided to get it into a decent shape and make it one of the biggest collections on TV, and maybe the entire internet. And now I'm sharing my collection with you. 140 Different Types of Moving Averages are waiting for you. Specifically : " AARMA | Adaptive Autonomous Recursive Moving Average ADMA | Adjusted Moving Average ADXMA | Average Directional Moving Average ADXVMA | Average Directional Volatility Moving Average AHMA | Ahrens Moving Average ALF | Ehler Adaptive Laguerre Filter ALMA | Arnaud Legoux Moving Average ALSMA | Adaptive Least Squares ALXMA | Alexander Moving Average AMA | Adaptive Moving Average ARI | Unknown ARSI | Adaptive RSI Moving Average AUF | Auto Filter AUTL | Auto-Line BAMA | Bryant Adaptive Moving Average BFMA | Blackman Filter Moving Average CMA | Corrected Moving Average CORMA | Correlation Moving Average COVEMA | Coefficient of Variation Weighted Exponential Moving Average COVNA | Coefficient of Variation Weighted Moving Average CTI | Coral Trend Indicator DEC | Ehlers Simple Decycler DEMA | Double EMA Moving Average DEVS | Ehlers - Deviation Scaled Moving Average DONEMA | Donchian Extremum Moving Average DONMA | Donchian Moving Average DSEMA | Double Smoothed Exponential Moving Average DSWF | Damped Sine Wave Weighted Filter DWMA | Double Weighted Moving Average E2PBF | Ehlers 2-Pole Butterworth Filter E2SSF | Ehlers 2-Pole Super Smoother Filter E3PBF | Ehlers 3-Pole Butterworth Filter E3SSF | Ehlers 3-Pole Super Smoother Filter EDMA | Exponentially Deviating Moving Average (MZ EDMA) EDSMA | Ehlers Dynamic Smoothed Moving Average EEO | Ehlers Modified Elliptic Filter Optimum EFRAMA | Ehlers Modified Fractal Adaptive Moving Average EHMA | Exponential Hull Moving Average EIT | Ehlers Instantaneous Trendline ELF | Ehler Laguerre filter EMA | Exponential Moving Average EMARSI | EMARSI EPF | Edge Preserving Filter EPMA | End Point Moving Average EREA | Ehlers Reverse Exponential Moving Average ESSF | Ehlers Super Smoother Filter 2-pole ETMA | Exponential Triangular Moving Average EVMA | Elastic Volume Weighted Moving Average FAMA | Following Adaptive Moving Average FEMA | Fast Exponential Moving Average FIBWMA | Fibonacci Weighted Moving Average FLSMA | Fisher Least Squares Moving Average FRAMA | Ehlers - Fractal Adaptive Moving Average FX | Fibonacci X Level GAUS | Ehlers - Gaussian Filter GHL | Gann High Low GMA | Gaussian Moving Average GMMA | Geometric Mean Moving Average HCF | Hybrid Convolution Filter HEMA | Holt Exponential Moving Average HKAMA | Hilbert based Kaufman Adaptive Moving Average HMA | Harmonic Moving Average HSMA | Hirashima Sugita Moving Average HULL | Hull Moving Average HULLT | Hull Triple Moving Average HWMA | Henderson Weighted Moving Average IE2 | Early T3 by Tim Tilson IIRF | Infinite Impulse Response Filter ILRS | Integral of Linear Regression Slope JMA | Jurik Moving Average KA | Unknown KAMA | Kaufman Adaptive Moving Average & Apirine Adaptive MA KIJUN | KIJUN KIJUN2 | Kijun v2 LAG | Ehlers - Laguerre Filter LCLSMA | 1LC-LSMA (1 line code lsma with 3 functions) LEMA | Leader Exponential Moving Average LLMA | Low-Lag Moving Average LMA | Leo Moving Average LP | Unknown LRL | Linear Regression Line LSMA | Least Squares Moving Average / Linear Regression Curve LTB | Unknown LWMA | Linear Weighted Moving Average MAMA | MAMA - MESA Adaptive Moving Average MAVW | Mavilim Weighted Moving Average MCGD | McGinley Dynamic Moving Average MF | Modular Filter MID | Median Moving Average / Percentile Nearest Rank MNMA | McNicholl Moving Average MTMA | Unknown MVSMA | Minimum Variance SMA NLMA | Non-lag Moving Average NWMA | Dürschner 3rd Generation Moving Average (New WMA) PKF | Parametric Kalman Filter PWMA | Parabolic Weighted Moving Average QEMA | Quadruple Exponential Moving Average QMA | Quick Moving Average REMA | Regularized Exponential Moving Average REPMA | Repulsion Moving Average RGEMA | Range Exponential Moving Average RMA | Welles Wilders Smoothing Moving Average RMF | Recursive Median Filter RMTA | Recursive Moving Trend Average RSMA | Relative Strength Moving Average - based on RSI RSRMA | Right Sided Ricker MA RWMA | Regressively Weighted Moving Average SAMA | Slope Adaptive Moving Average SFMA | Smoother Filter Moving Average SMA | Simple Moving Average SSB | Senkou Span B SSF | Ehlers - Super Smoother Filter P2 SSMA | Super Smooth Moving Average STMA | Unknown SWMA | Self-Weighted Moving Average SW_MA | Sine-Weighted Moving Average TEMA | Triple Exponential Moving Average THMA | Triple Exponential Hull Moving Average TL | Unknown TMA | Triangular Moving Average TPBF | Three-pole Ehlers Butterworth TRAMA | Trend Regularity Adaptive Moving Average TSF | True Strength Force TT3 | Tilson (3rd Degree) Moving Average VAMA | Volatility Adjusted Moving Average VAMAF | Volume Adjusted Moving Average Function VAR | Vector Autoregression Moving Average VBMA | Variable Moving Average VHMA | Vertical Horizontal Moving Average VIDYA | Variable Index Dynamic Average VMA | Volume Moving Average VSO | Unknown VWMA | Volume Weighted Moving Average WCD | Unknown WMA | Weighted Moving Average XEMA | Optimized Exponential Moving Average ZEMA | Zero Lag Moving Average ZLDEMA | Zero-Lag Double Exponential Moving Average ZLEMA | Ehlers - Zero Lag Exponential Moving Average ZLTEMA | Zero-Lag Triple Exponential Moving Average ZSMA | Zero-Lag Simple Moving Average " Don't forget that you can use any Moving Average not only for the chart but also for any of your indicators without affecting the code as in my example. But remember that some MAs are not designed to work with anything other than a chart. All MA and Code lists are sorted strictly alphabetically by short name (A-Z). Each MA has its own number (ID) by which you can display the Moving Average you need. Next to the ID selection there are tooltips with short names and their numbers. Use them. The panel below will help you to read the Name of the selected MA. Because of the size of the collection I think this is the optimal and most convenient use. Correct me if this is not the case. Unknown - Some MAs I collected so long ago that I lost the full real name and couldn't find the authors. If you recognize them, please let me know. I have deliberately simplified all MAs to input just Source and Length. Because the collection is so large, it would be quite inconvenient and difficult to customize all MA functions (multipliers, offset, etc.). If you need or like any MA you will still have to take it from my collection for your code. I tried to leave the basic MA settings inside function in first strings. I have tried to list most of the authors, but since the bulk of the collection was created a long time ago and was not intended for public publication I could not find all of them. Some of the features were created from scratch or may have been slightly modified, so please be careful. If you would like to improve this collection, please write to me in PM. Also Credits, Likes, Awards, Loves and Thanks to : @alexgrover @allanster @andre_007 @auroagwei @blackcat1402 @bsharpe @cheatcountry @CrackingCryptocurrency @Duyck @ErwinBeckers @everget @glaz @gotbeatz26107 @HPotter @io72signals @JacobAmos @JoshuaMcGowan @KivancOzbilgic @LazyBear @loxx @LuxAlgo @MightyZinger @nemozny @NGBaltic @peacefulLizard50262 @RicardoSantos @StalexBot @ThiagoSchmitz @TradingView — 𝐀𝐧𝐝 𝐎𝐭𝐡𝐞𝐫𝐬 ! So just a Big Thank You to everyone who has ever and anywhere shared their codes. Penunjuk Pine Script®oleh HALDRO1010216
Astro: Planetary Aspects v2.0I have updated the excellent script originally written by @BarefootJoey with additional functionality as listed below the script's original description: @BarefootJoey: In astrology, planetary aspects refer to the angles formed between two or more planets in a horoscope or birth chart. These angles are created by the positions of the planets in the sky and are thought to represent a particular energy or influence that can impact events on Earth. The most common planetary aspects are the conjunction (when two planets are in the same position in the zodiac), the opposition (when two planets are direct across from each other in the zodiac), the trine (when two planets are 120 degrees apart in the zodiac), and the square (when two planets are 90 degrees apart in the zodiac). This oscillator plots the current geocentric/heliocentric aspect for up to two planets and features a customizable precision of degree (up to +/- 15 degrees) for each aspect. Additional functionality added in by @Yevolution: 1. Overlay the indicator plot on top of the main chart, with the indicator's scale placed on the left - I found it easier to spot price reactions at a given planetary aspect vs seeing the plot in a separate frame 2. Add options to plot a vertical bar for every occurrence of chosen aspects The script source code has remained open and additional comments have been added by me to explain the changes where relevant. When I get some more spare time I will add a function to enable future planetary aspect events to also be displayed on the chart to make forecasting using this data easier.Penunjuk Pine Script®oleh Yevolution2525666
Price LevelsAuto plots significant Gann and Fib price levels using the all time range. Useful to quickly identify significant levels of support and resistance. Penunjuk Pine Script®oleh tomorme88110
Price Pivots for NSE Index & F&O StocksPrice Pivots for NSE Index & F&O Stocks What is this Indicator? • This indicator calculates the price range a Stock or Index can move in a Day, Week or Month. Advantages of this Indicator • This is a Leading indicator, not Dynamic or Repaint. • Helps to identify the tight range of price movement. • Can easily identify the Options strike price. • The levels are more reliable and authentic than Gann Square of 9 Levels. • Develops a discipline in placing Targets. Disadvantages of this Indicator • The indicator is specifically made for National Stock Exchange of India (NSE) listed index and stocks. • The indicator is calculated only for index NIFTY, BANKNIFTY, FINNIFTY, MIDCPNIFTY and Stocks listed in Futures and Options. • The indicator shows nothing for other indexes and stocks other than above mentioned. • The data need to be entered manually. • The data need to be updated manually when the F&O listed stocks are updated. Who to use? Highly beneficial for Day Traders, it can be used for Swing and Positions as well. What timeframe to use? • Any timeframe. • The highlighted levels in Red and Green will not show correct levels in 1 minute timeframe. • 5min is recommended for Day Traders. When to use? • Wait for proper swing to form. • Recommended to avoid 1st 1 hour or market open, that is 9.15am to 10.15 or 10.30am. • Within this time a proper swing will be formed. How to use? Entry • Enter when the Price reach closer to the Blue line. • Enter Long when the Price takes a pullback or breakout at the Red lines. Exit • Exit position when the Price reach closer to the Red lines in Long positions. What are the Lines? Gray Lines: • Every lines with price labels are the Strike Prices in the Option Chain from NSE website. • Price moves from 1 Strike Price level to another. • The dashed lines are average levels of 2 Strike Prices. Red & Green Lines: • The Red and Green Lines will appear only after the first 1 hour. • The levels are calculated based on the 1st 1 hour. • Red Lines are important Resistance levels, these are strong Bearish reversal points. It is also a breakout level, this need to be figured out from the past levels, trend, percentage change and consolidation. • Green Lines are important Support levels, these are strong Bullish reversal points. It is also a breakdown level, this need to be figured out from the past levels, trend, percentage change and consolidation. What are the Labels? • First Number: Price of that level. • Numbers in (): Percentage change and Change of price from LTP(Last Traded Price) to that Level. How to use? Entry: • Enter when price is closer to the Red or Green lines. • Enter after considering previous Swing and Trend. • Note the 50% of previous Swing. • Enter Short when price reverse from each level. • If 50% of swing and the pivot level is closer it can be a good entry. Exit: • Use the logic of Entry, each level can be a target. • Exit when price is closer to the Red or Green lines. Indicator Menu Source • Custom: Enter the price manually after choosing the Source as Custom to show the Pivots at that price. • LTP: Pivot is calculated based on Last Traded Price. • Day Open: Pivot is calculated based on current day opening price. • PD Close: Pivot is calculated based on previous day closing price. • PD HL2: Pivot is calculated based on previous day average of High and Low. • PD HLC3: Pivot is calculated based on previous day average of High, Low and Close. "Time (IST) (Vertical)" • This is a marker of every 1 hour. • Usually major price movement happen between previous day last 1 hour (2:15 pm) to today first 1 hour (10:15 pm). • Two swings can happen between first 2 hour of current day. • At the end of the day last 1 hour from 2.15 pm another important movement will happen. • Usually rest of the time won't show any interesting movement. To the Users • Certain symbols may show the levels as a single line. For such symbols choose a different Source or Timeframe from the indicator menu. • Please inform if any of the Symbol's price levels don't react to the pivots, include the Symbol a well. • Also inform if you notice any wrong values, errors or abnormal behavior in the indicator. • Feel free to suggest or adding new features and options. General Tips • It is good if Stock trend is same as that of NIFTY trend. • Lots of indicators creates lots of confusion. • Keep the chart simple and clean. • Buy Low and Sell High. • Master averages or 50%. • Previous Swing High and Swing Low are crucial.Penunjuk Pine Script®oleh Arun_K_Bhaskar2121940
Multi-Timeframe Simple TrendSimple Trend State Indicator inspired by @TaPlot's Price Time Frame Continuity indicator. Indicator works well on any Chart Timeframe although some aliasing of the State Response should be expected when comparing a State Response calculated on one Chart Timeframe to a Higher Chart Timeframe ie. comparing the State Result for 30 min from both a 1D Chart and 130 min Chart. Current Trend State is calculated based on the Current Angle of the SMA Length "L". A Simple moving average is used as an Array Function has to be used to calculate the current MA Value for Time Frames < Chart. Current Trend State Control is as follows: Long Trend State = Current Angle > Min Long Angle Bullish Trend State = Current Angle < Min Long Angle and Current Angle > Max Reversal Angle Neutral Trend State = Current Angle < Max Reversal Angle and Current Angle > Min Reversal Angle Bearish Trend State = Current Angle < Min Reversal Angle and Current Angle > Max Short Angle Short Trend State = Current Angle < Max Short Angle I use Gann Angle based State Angle definitions in my charts. Visualization of the Trend State is controlled via the colors selected in the GUI. Indicator output creates 6 Panels organized linearly at the Location defined via the GUI. Each panel identifies the Timeframe and Timeframe State for the Timeframes selected in the GUI. IMPORTANT - Timeframes 4-6 MUST be < Current Chart. Timeframes 1-3 should be >= Current Chart What does the Tool give you? It enables you to see, based on a standardized measure, the relative behavior of the underlying trends on the selected Timeframe ie . the current Asset Trend Support Structure. So for Simple Trend Following: an identified Bullish Pulse could be Identified, and then followed to the highest Timeframe that is able to maintain that Bullish State. This is your Pivotal Timeframe. If a Bearish Pulse is identified then ride it until it grows strong enough to change the Trend State of the panel below your Pivotal Timeframe. Penunjuk Pine Script®oleh jphlongTelah dikemas kini 109
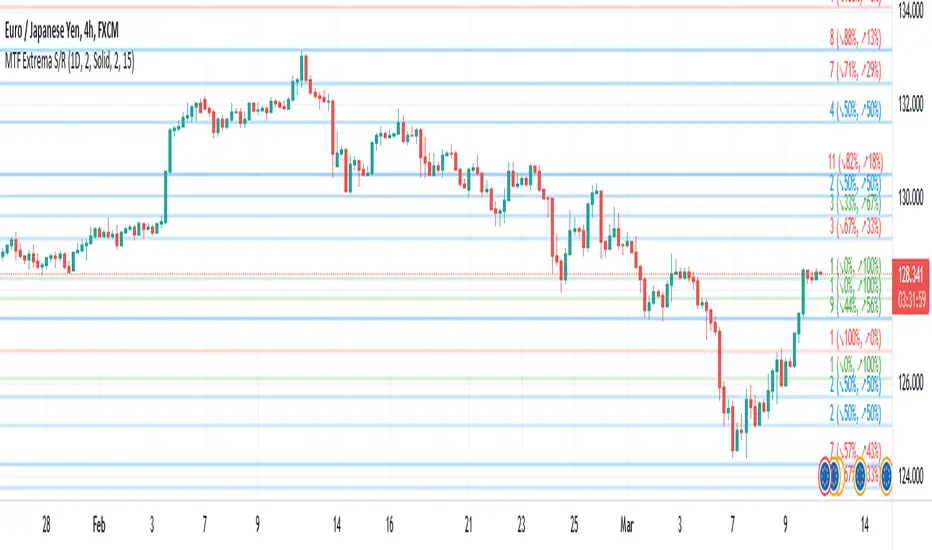
Multi-TimeFrame Extremum Points Support/ResistanceIntroduction This is my newest Support/Resistance indicator based on the idea of my previous script which had been featured in Editors' Picks . Everyone seems to have their own idea of how you should measure support and resistance levels. This code finds the exact highest and lowest price points (Extrema) on the chart and then draws the support and resistance levels on them. In my opinion, the advantage of this method is that the most powerful resistance/support levels which usually cover the supply/demand areas would be formed on these extremum points, as the following facts state. Facts 1. Support and resistance levels are one of the key concepts used by technical analysts and form the basis of a wide variety of technical analysis tools. Technical analysts use support and resistance levels to identify price points on a chart where the probabilities favor a pause or reversal of a prevailing trend. 2. Supply and demand zones are natural support and resistance levels and a popular analysis technique used in day trading. The zones are the periods of sideways price action that come before explosive price moves. A supply zone forms before a downtrend and a demand zone forms before an uptrend. When the price leaves the supply/demand zone and starts trending, the strong imbalance between buyers and sellers leads to strong and explosive price movements. 3. Based on Dow Theory, trends persist until a clear reversal occurs. A reversal is a change in the price direction of an asset. Reversals typically refer to large price changes, where the trend changes direction. Challenges The most challenging part in implementing a S/R indicator which draws all the levels on the chart is the problem of congestion! But we should notice two other facts: 1. The more times the price tests a support or resistance area, the more significant the level becomes. 2. A previous support level will sometimes become a resistance level when the price attempts to move back up, and conversely, a resistance level will become a support level as the price temporarily falls back. So, I solved the problem using these two approaches: Merging nearby levels and showing the role of the levels in colors and numbers Avoiding many weaker levels by checking higher time frames Settings and Usage There are some options in the indicator settings as described below: Calculations Time Frame: By changing the time frame, user could keep only the stronger S/R levels on the chart. Level Colors: By default, lowest points (Supports) are green, highest points (Resistances) are red and merged levels are blue. Note that the transparency of the colors would be calculated automatically; The more opaque the color is, the stronger the level is! Lines Style and Width: The style of the levels could be solid, dashed or dotted and user could also change the lines width in pixels. Length of the lines: This option is based on the count of bars, but user could simply choose to extend the levels Merge Nearby Levels: The proximity of the levels would be calculated automatically based on ATR (Average True Range) and the default length of the formula could be changed. Labels: Each level could have a label consisting the count of merged levels into one, the percentage of merged supports/resistances and the price of the level. Note that if user choose to see the percentage of S/R roles, the color of each label changes automatically based on the main role of corresponding merged level (e.g., a blue level with a red label means that the level more acted as resistance). I think the users of my previous S/R indicators could check this one That's it for now! Feel free to send me your thoughts!Penunjuk Pine Script®oleh informanerd4141906
sar_taLevel: 3 Background The Parabolic SAR is a technical indicator developed by J. Welles Wilder to determine the direction that an asset is moving. The indicator is also referred to as a stop and reverse system, which is abbreviated as SAR. It aims to identify potential reversals in the price movement of traded assets. PINE v5 Version of SAR Library, which includes latest the Supertrend, Parabolic SAR, Gann Hilo activator, Chex indicators etc. Function This lib provides functions similar to SAR which can serve as a similar element for composite strategy. Parameters need to be tuned for the best performance and I will further inrish this collections. Bonus, If you can propose me a novel SAR source link, I would like to grant you one L4/L5 indicator with 2-month subscription for free. Library "sar_ta" tv_sar() lucid_sar() gl_activator() ltb_sar() chanex() bjorgum_sar() Perpustakaan Pine Script®oleh blackcat1402Telah dikemas kini 4431
pandas_taLibrary "pandas_ta" Level: 3 Background Today is the first day of 2022 and happy new year every tradingviewers! May health and wealth go along with you all the time. I use this chance to publish my 1st PINE v5 lib : pandas_ta This is not a piece of cake like thing, which cost me a lot of time and efforts to build this lib. Beyond 300 versions of this script was iterated in draft. Function Library "pandas_ta" PINE v5 Counterpart of Pandas TA - A Technical Analysis Library in Python 3 at github.com The Original Pandas Technical Analysis (Pandas TA) is an easy to use library that leverages the Pandas package with more than 130 Indicators and Utility functions and more than 60 TA Lib Candlestick Patterns. I realized most of indicators except Candlestick Patterns because tradingview built-in Candlestick Patterns are even more powerful! I use this to verify pandas_ta python version indicators for myself, but I realize that maybe many may need similar lib for pine v5 as well. Function Brief Descriptions (Pls find details in script comments) bton --> Binary to number wcp --> Weighted Closing Price (WCP) counter --> Condition counter xbt --> Between ebsw --> Even Better SineWave (EBSW) ao --> Awesome Oscillator (AO) apo --> Absolute Price Oscillator (APO) xrf --> Dynamic shifted values bias --> Bias (BIAS) bop --> Balance of Power (BOP) brar --> BRAR (BRAR) cci --> Commodity Channel Index (CCI) cfo --> Chande Forcast Oscillator (CFO) cg --> Center of Gravity (CG) cmo --> Chande Momentum Oscillator (CMO) coppock --> Coppock Curve (COPC) cti --> Correlation Trend Indicator (CTI) dmi --> Directional Movement Index(DMI) er --> Efficiency Ratio (ER) eri --> Elder Ray Index (ERI) fisher --> Fisher Transform (FISHT) inertia --> Inertia (INERTIA) kdj --> KDJ (KDJ) kst --> 'Know Sure Thing' (KST) macd --> Moving Average Convergence Divergence (MACD) mom --> Momentum (MOM) pgo --> Pretty Good Oscillator (PGO) ppo --> Percentage Price Oscillator (PPO) psl --> Psychological Line (PSL) pvo --> Percentage Volume Oscillator (PVO) qqe --> Quantitative Qualitative Estimation (QQE) roc --> Rate of Change (ROC) rsi --> Relative Strength Index (RSI) rsx --> Relative Strength Xtra (rsx) rvgi --> Relative Vigor Index (RVGI) slope --> Slope smi --> SMI Ergodic Indicator (SMI) sqz* --> Squeeze (SQZ) * NOTE: code sufferred from very strange error, code was commented. sqz_pro --> Squeeze PRO(SQZPRO) xfl --> Condition filter stc --> Schaff Trend Cycle (STC) stoch --> Stochastic (STOCH) stochrsi --> Stochastic RSI (STOCH RSI) trix --> Trix (TRIX) tsi --> True Strength Index (TSI) uo --> Ultimate Oscillator (UO) willr --> William's Percent R (WILLR) alma --> Arnaud Legoux Moving Average (ALMA) xll --> Dynamic rolling lowest values dema --> Double Exponential Moving Average (DEMA) ema --> Exponential Moving Average (EMA) fwma --> Fibonacci's Weighted Moving Average (FWMA) hilo --> Gann HiLo Activator(HiLo) hma --> Hull Moving Average (HMA) hwma --> HWMA (Holt-Winter Moving Average) ichimoku --> Ichimoku Kinkō Hyō (ichimoku) jma --> Jurik Moving Average Average (JMA) kama --> Kaufman's Adaptive Moving Average (KAMA) linreg --> Linear Regression Moving Average (linreg) mgcd --> McGinley Dynamic Indicator rma --> wildeR's Moving Average (RMA) sinwma --> Sine Weighted Moving Average (SWMA) ssf --> Ehler's Super Smoother Filter (SSF) © 2013 supertrend --> Supertrend (supertrend) xsa --> X simple moving average swma --> Symmetric Weighted Moving Average (SWMA) t3 --> Tim Tillson's T3 Moving Average (T3) tema --> Triple Exponential Moving Average (TEMA) trima --> Triangular Moving Average (TRIMA) vidya --> Variable Index Dynamic Average (VIDYA) vwap --> Volume Weighted Average Price (VWAP) vwma --> Volume Weighted Moving Average (VWMA) wma --> Weighted Moving Average (WMA) zlma --> Zero Lag Moving Average (ZLMA) entropy --> Entropy (ENTP) kurtosis --> Rolling Kurtosis skew --> Rolling Skew xev --> Condition all zscore --> Rolling Z Score adx --> Average Directional Movement (ADX) aroon --> Aroon & Aroon Oscillator (AROON) chop --> Choppiness Index (CHOP) xex --> Condition any cksp --> Chande Kroll Stop (CKSP) dpo --> Detrend Price Oscillator (DPO) long_run --> Long Run psar --> Parabolic Stop and Reverse (psar) short_run --> Short Run vhf --> Vertical Horizontal Filter (VHF) vortex --> Vortex accbands --> Acceleration Bands (ACCBANDS) atr --> Average True Range (ATR) bbands --> Bollinger Bands (BBANDS) donchian --> Donchian Channels (DC) kc --> Keltner Channels (KC) massi --> Mass Index (MASSI) natr --> Normalized Average True Range (NATR) pdist --> Price Distance (PDIST) rvi --> Relative Volatility Index (RVI) thermo --> Elders Thermometer (THERMO) ui --> Ulcer Index (UI) ad --> Accumulation/Distribution (AD) cmf --> Chaikin Money Flow (CMF) efi --> Elder's Force Index (EFI) ecm --> Ease of Movement (EOM) kvo --> Klinger Volume Oscillator (KVO) mfi --> Money Flow Index (MFI) nvi --> Negative Volume Index (NVI) obv --> On Balance Volume (OBV) pvi --> Positive Volume Index (PVI) dvdi --> Dual Volume Divergence Index (DVDI) xhh --> Dynamic rolling highest values pvt --> Price-Volume Trend (PVT) Remarks I also incorporated func descriptions and func test script in commented mode, you can test the functino with the embedded test script and modify them as you wish. This is a Level 3 free and open source indicator library. Feedbacks are appreciated. This is not the end of pandas_ta lib publication, but it is start point with pine v5 lib function and I will add more and more funcs into this lib for my own indicators. Function Name List: bton() wcp() count() xbt() ebsw() ao() apo() xrf() bias() bop() brar() cci() cfo() cg() cmo() coppock() cti() dmi() er() eri() fisher() inertia() kdj() kst() macd() mom() pgo() ppo() psl() pvo() qqe() roc() rsi() rsx() rvgi() slope() smi() sqz_pro() xfl() stc() stoch() stochrsi() trix() tsi() uo() willr() alma() wcx() xll() dema() ema() fwma() hilo() hma() hwma() ichimoku() jma() kama() linreg() mgcd() rma() sinwma() ssf() supertrend() xsa() swma() t3() tema() trima() vidya() vwap() vwma() wma() zlma() entropy() kurtosis() skew() xev() zscore() adx() aroon() chop() xex() cksp() dpo() long_run() psar() short_run() vhf() vortex() accbands() atr() bbands() donchian() kc() massi() natr() pdist() rvi() thermo() ui() ad() cmf() efi() ecm() kvo() mfi() nvi() obv() pvi() dvdi() xhh() pvt() Perpustakaan Pine Script®oleh blackcat1402Telah dikemas kini 2020175
Financial Astrology Mercury SpeedMercury speed phases (stationary and retrograde) was closely observed by W. D. Gann in order to determine potential trend changes, in BTCUSD we can see some turning points close to the speed dips (when Mercury speed cross the zero line). However, what looks more interesting is that when the Mercury speed is accelerating the price range of the candles is larger, is the same pattern that we noted with the Moon speed indicator so we can conclude that speed acceleration periods produce more intense effects when Mercury aspects occurs. Note: The Mercury speed indicator is based on an ephemeris array that covers years 2010 to 2030, prior or after this years the speed is not available, this daily ephemeris are based on UTC time so in order to align properly with the price bars times you should set UTC as your chart timezone.Penunjuk Pine Script®oleh citlacom33155