Percentage Change IndicatorPercentage Change Indicator
This indicator calculates and displays the percentage change between the current close price and the previous close price. It provides a clear visual representation of price movements, helping traders quickly identify significant changes in the market.
## Formula
The percentage change is calculated using the following formula:
```
Percentage Change = (Current Close - Previous Close) * 100 / Current Close
```
## Features
- Displays percentage change as a bar chart
- Green bars indicate positive changes
- Red bars indicate negative changes
- A horizontal line at 0% helps distinguish between positive and negative movements
## How to Use
1. Add the indicator to your chart
2. Observe the bar chart below your main price chart
3. Green bars above the 0% line indicate upward price movements
4. Red bars below the 0% line indicate downward price movements
5. The height of each bar represents the magnitude of the percentage change
This indicator can be particularly useful for:
- Identifying sudden price spikes or drops
- Analyzing the volatility of an asset
- Comparing price movements across different timeframes
- Spotting potential entry or exit points based on percentage changes
Customize the indicator's appearance in the settings to suit your charting preferences.
Note: This indicator works on all timeframes, adapting its calculations to the selected chart period.
Cari dalam skrip untuk "harmonic"

Ichimoku Theories [LuxAlgo]The Ichimoku Theories indicator is the most complete Ichimoku tool you will ever need. Four tools combined into one to harness all the power of Ichimoku Kinkō Hyō.
This tool features the following concepts based on the work of Goichi Hosoda:
Ichimoku Kinkō Hyō: Original Ichimoku indicator with its five main lines and kumo.
Time Theory: automatic time cycle identification and forecasting to understand market timing.
Wave Theory: automatic wave identification to understand market structure.
Price Theory: automatic identification of developing N waves and possible price targets to understand future price behavior.
🔶 ICHIMOKU KINKŌ HYŌ
Ichimoku with lines only, Kumo only and both together
Let us start with the basics: the Ichimoku original indicator is a tool to understand the market, not to predict it, it is a trend-following tool, so it is best used in trending markets.
Ichimoku tells us what is happening in the market and what may happen next, the aim of the tool is to provide market understanding, not trading signals.
The tool is based on calculating the mid-point between the high and low of three pre-defined ranges as the equilibrium price for short (9 periods), medium (26 periods), and long (52 periods) time horizons:
Tenkan sen: middle point of the range of the last 9 candles
Kinjun sen: middle point of the range of the last 26 candles
Senkou span A: middle point between Tankan Sen and Kijun Sen, plotted 26 candles into the future
Senkou span B: midpoint of the range of the last 52 candles, plotted 26 candles into the future
Chikou span: closing price plotted 26 candles into the past
Kumo: area between Senkou pans A and B (kumo means cloud in Japanese)
The most basic use of the tool is to use the Kumo as an area of possible support or resistance.
🔶 TIME THEORY
Current cycles and forecast
Time theory is a critical concept used to identify historical and current market cycles, and use these to forecast the next ones. This concept is based on the Kihon Suchi (translating to "Basic Numbers" in Japanese), these are 9 and 26, and from their combinations we obtain the following sequence:
9, 17, 26, 33, 42, 51, 65, 76, 129, 172, 200, 257
The main idea is that the market moves in cycles with periods set by the Kihon Suchi sequence.
When the cycle has the same exact periods, we obtain the Taito Suchi (translating to "Same Number" in Japanese).
This tool allows traders to identify historical and current market cycles and forecast the next one.
🔹 Time Cycle Identification
Presentation of 4 different modes: SWINGS, HIGHS, KINJUN, and WAVES .
The tool draws a horizontal line at the bottom of the chart showing the cycles detected and their size.
The following settings are used:
Time Cycle Mode: up to 7 different modes
Wave Cycle: Which wave to use when WAVE mode is selected, only active waves in the Wave Theory settings will be used.
Show Time Cycles: keep a cleaner chart by disabling cycles visualisation
Show last X time cycles: how many cycles to display
🔹 Time Cycle Forecast
Showcasing the two forecasting patterns: Kihon Suchi and Taito Suchi
The tool plots horizontal lines, a solid anchor line, and several dotted forecast lines.
The following settings are used:
Show time cycle forecast: to keep things clean
Forecast Pattern: comes in two flavors
Kihon Suchi plots a line from the anchor at each number in the Kihon Suchi sequence.
Taito Suchi plot lines from the anchor with the same size detected in the anchored cycle
Anchor forecast on last X time cycle: traders can place the anchor in any detected cycle
🔶 WAVE THEORY
All waves activated with overlapping
The main idea behind this theory is that markets move like waves in the sea, back and forth (making swing lows and highs). Understanding the current market structure is key to having realistic expectations of what the market may do next. The waves are divided into Simple and Complex.
The following settings are used:
Basic Waves: allows traders to activate waves I, V and N
Complex Waves: allows traders to activate waves P, Y and W
Overlapping waves: to avoid missing out on any of the waves activated
Show last X waves: how many waves will be displayed
🔹 Basic Waves
The three basic waves
The basic waves from which all waves are made are I, V, and N
I wave: one leg moves
V wave: two legs move, one against the other
N wave: Three legs move, push, pull back, and another push
🔹 Complex Waves
Three complex waves
There are other waves like
P wave: contracting market
Y wave: expanding market
W wave: double top or double bottom
🔶 PRICE THEORY
All targets for the current N wave with their calculations
This theory is based on identifying developing N waves and predicting potential price targets based on that developing wave.
The tool displays 4 basic targets (V, E, N, and NT) and 3 extended targets (2E and 3E) according to the calculations shown in the chart above. Traders can enable or disable each target in the settings panel.
🔶 USING EVERYTHING TOGETHER
Please DON'T do this. This is not how you use it
Now the real example:
Daily chart of Nasdaq 100 futures (NQ1!) with our Ichimoku analysis
Time, waves, and price theories go together as one:
First, we identify the current time cycles and wave structure.
Then we forecast the next cycle and possible key price levels.
We identify a Taito Suchi with both legs of exactly 41 candles on each I wave, both together forming a V wave, the last two I waves are part of a developing N wave, and the time cycle of the first one is 191 candles. We forecast this cycle into the future and get 22nd April as a key date, so in 6 trading days (as of this writing) the market would have completed another Taito Suchi pattern if a new wave and time cycle starts. As we have a developing N wave we can see the potential price targets, the price is actually between the NT and V targets. We have a bullish Kumo and the price is touching it, if this Kumo provides enough support for the price to go further, the market could reach N or E targets.
So we have identified the cycle and wave, our expectations are that the current cycle is another Taito Suchi and the current wave is an N wave, the first I wave went for 191 candles, and we expect the second and third I waves together to amount to 191 candles, so in theory the N wave would complete in the next 6 trading days making a swing high. If this is indeed the case, the price could reach the V target (it is almost there) or even the N target if the bulls have the necessary strength.
We do not predict the future, we can only aim to understand the current market conditions and have future expectations of when (time), how (wave), and where (price) the market will make the next turning point where one side of the market overcomes the other (bulls vs bears).
To generate this chart, we change the following settings from the default ones:
Swing length: 64
Show lines: disabled
Forecast pattern: TAITO SUCHI
Anchor forecast: 2
Show last time cycles: 5
I WAVE: enabled
N WAVE: disabled
Show last waves: 5
🔶 SETTINGS
Show Swing Highs & Lows: Enable/Disable points on swing highs and swing lows.
Swing Length: Number of candles to confirm a swing high or swing low. A higher number detects larger swings.
🔹 Ichimoku Kinkō Hyō
Show Lines: Enable/Disable the 5 Ichimoku lines: Kijun sen, Tenkan sen, Senkou span A & B and Chikou Span.
Show Kumo: Enable/Disable the Kumo (cloud). The Kumo is formed by 2 lines: Senkou Span A and Senkou Span B.
Tenkan Sen Length: Number of candles for Tenkan Sen calculation.
Kinjun Sen Length: Number of candles for the Kijun Sen calculation.
Senkou Span B Length: Number of candles for Senkou Span B calculation.
Chikou & Senkou Offset: Number of candles for Chikou and Senkou Span calculation. Chikou Span is plotted in the past, and Senkou Span A & B in the future.
🔹 Time Theory
Show Time Cycle Forecast: Enable/Disable time cycle forecast vertical lines. Disable for better performance.
Forecast Pattern: Choose between two patterns: Kihon Suchi (basic numbers) or Taito Suchi (equal numbers).
Anchor forecast on last X time cycle: Number of time cycles in the past to anchor the time cycle forecast. The larger the number, the deeper in the past the anchor will be.
Time Cycle Mode: Choose from 7 time cycle detection modes: Tenkan Sen cross, Kijun Sen cross, Kumo change between bullish & bearish, swing highs only, swing lows only, both swing highs & lows and wave detection.
Wave Cycle: Choose which type of wave to detect from 6 different wave types when the time cycle mode is set to WAVES.
Show Time Cycles: Enable/Disable time cycle horizontal lines. Disable for better performance.
how last X time cycles: Maximum number of time cycles to display.
🔹 Wave Theory
Basic Waves: Enable/Disable the display of basic waves, all at once or one at a time. Disable for better performance.
Complex Waves: Enable/Disable complex wave display, all at once or one by one. Disable for better performance.
Overlapping Waves: Enable/Disable the display of waves ending on the same swing point.
Show last X waves: 'Maximum number of waves to display.
🔹 Price Theory
Basic Targets: Enable/Disable horizontal price target lines. Disable for better performance.
Extended Targets: Enable/Disable extended price target horizontal lines. Disable for better performance.

Price Action Fractal Forecasts [AlgoAlpha]🔮 Price Action Fractal Forecasts - Unleash the Power of Historical Patterns! 🌌✨
Dive into the future with AlgoAlpha's Price Action Fractal Forecasts ! This innovative indicator utilizes the mesmerizing complexity of fractals to predict future price movements, offering traders a unique edge in the market. By analyzing historical price action and identifying repeating patterns, this tool forecasts future price trends, providing visually engaging and actionable insights.
Key Features:
🔄 Flexible Data Series Selection: Choose your preferred data series for precise analysis.
🕰 Flexible Training and Reference Data Windows: Customize the length of training data and reference periods to match your trading style.
📈 Custom Forecast Length: Adjust the forecast horizon to suit your strategic objectives.
🌈 Customizable Visual Elements: Tailor the colors of forecast deviation cones, data reference areas, and more for optimal chart readability.
🔄 Anticipatory and Repetitive Forecast Modes: Select between anticipating future trends or identifying repetitive patterns for forecasts.
🔎 Enhanced Similarity Search: Leverages correlation metrics to find the most similar historical data segments.
📊 Forecast Deviation Cone: Visualize potential price range deviations with adjustable multipliers.
🚀 Quick Guide to Maximizing Your Trading with Price Action Fractal Forecasts:
🛠 Add the Indicator: Search for "Price Action Fractal Forecasts" in TradingView's Indicators & Strategies. Customize settings according to your trading strategy.
📊 Strategic Forecasting: Monitor the forecast deviation cone and forecast directional changes for insights into potential future price movements.
🔔 Alerts for Swift Action: Set up notifications based on forecast changes to stay ahead of market movements without constant monitoring.
Behind the Magic: How It Works
The core of the Price Action Fractal Forecasts lies in its ability to compare current market behavior with historical data to unearth similar patterns. It first establishes a training data window to analyze historical prices. Within this window, it then defines a reference length to identify the most recent price action that will serve as the basis for comparison. The indicator searches through the historical data within the training window to find segments that closely match the recent price action in the reference period.
Depending on whether you choose the anticipatory or repetitive forecast mode, the indicator either looks ahead to predict future prices based on past outcomes following similar patterns or focuses on the repeating patterns within the reference period itself for forecasts. The forecast's direction can be configured to reflect the mean average of forecasted prices or the end-point relative to the start-point of the forecast, offering flexibility in how forecasts are interpreted.
To enhance the comprehensiveness and visualization, the indicator features a forecast deviation cone. This cone represents the potential range of price movements, providing a visual cue for volatility and uncertainty in the forecasted prices. The intensity of this cone can be adjusted to suit individual preferences, offering a visual guide to the level of risk and uncertainty associated with the forecasted price path.
Embrace the fractal magic of markets with AlgoAlpha's Price Action Fractal Forecasts and transform your trading today! 🌟🚀

Flags and Pennants [Trendoscope®]🎲 An extension to Chart Patterns based on Trend Line Pairs - Flags and Pennants
After exploring Algorithmic Identification and Classification of Chart Patterns and developing Auto Chart Patterns Indicator , we now delve into extensions of these patterns, focusing on Flag and Pennant Chart Patterns. These patterns evolve from basic trend line pair-based structures, often influenced by preceding market impulses.
🎲 Identification rules for the Extension Patterns
🎯 Identify the existence of Base Chart Patterns
Before identifying the flag and pennant patterns, we first need to identify the existence of following base trend line pair based converging or parallel patterns.
Ascending Channel
Descending Channel
Rising Wedge (Contracting)
Falling Wedge (Contracting)
Converging Triangle
Descending Triangle (Contracting)
Ascending Triangle (Contracting)
🎯 Identifying Extension Patterns.
The key to pinpointing these patterns lies in spotting a strong impulsive wave – akin to a flagpole – preceding a base pattern. This setup suggests potential for an extension pattern:
A Bullish Flag emerges from a positive impulse followed by a descending channel or a falling wedge
A Bearish Flag appears after a negative impulse leading to an ascending channel or a rising wedge.
A Bullish Pennant is indicated by a positive thrust preceding a converging triangle or ascending triangle.
A Bearish Pennant follows a negative impulse and a converging or descending triangle.
🎲 Pattern Classifications and Characteristics
🎯 Bullish Flag Pattern
Characteristics of Bullish Flag Pattern are as follows
Starts with a positive impulse wave
Immediately followed by either a short descending channel or a falling wedge
Here is an example of Bullish Flag Pattern
🎯 Bearish Flag Pattern
Characteristics of Bearish Flag Pattern are as follows
Starts with a negative impulse wave
Immediately followed by either a short ascending channel or a rising wedge
Here is an example of Bearish Flag Pattern
🎯 Bullish Pennant Pattern
Characteristics of Bullish Pennant Pattern are as follows
Starts with a positive impulse wave
Immediately followed by either a converging triangle or ascending triangle pattern.
Here is an example of Bullish Pennant Pattern
🎯 Bearish Pennant Pattern
Characteristics of Bearish Pennant Pattern are as follows
Starts with a negative impulse wave
Immediately followed by either a converging triangle or a descending converging triangle pattern.
Here is an example of Bearish Pennant Pattern
🎲 Trading Extension Patterns
In a strong market trend, it's common to see temporary periods of consolidation, forming patterns that either converge or range, often counter to the ongoing trend direction. Such pauses may lay the groundwork for the continuation of the trend post-breakout. The assumption that the trend will resume shapes the underlying bias of Flag and Pennant patterns
It's important, however, not to base decisions solely on past trends. Conducting personal back testing is crucial to ascertain the most effective entry and exit strategies for these patterns. Remember, the behavior of these patterns can vary significantly with the volatility of the asset and the specific timeframe being analyzed.
Approach the interpretation of these patterns with prudence, considering that market dynamics are subject to a wide array of influencing factors that might deviate from expected outcomes. For investors and traders, it's essential to engage in thorough back testing, establishing entry points, stop-loss orders, and target goals that align with your individual trading style and risk appetite. This step is key to assessing the viability of these patterns in line with your personal trading strategies and goals.
It's fairly common to witness a breakout followed by a swift price reversal after these patterns have formed. Additionally, there's room for innovation in trading by going against the bias if the breakout occurs in the opposite direction, specially when the trend before the formation of the pattern is in against the pattern bias.
🎲 Cheat Sheet
🎲 Indicator Settings
Custom Source : Enables users to set custom OHLC - this means, the indicator can also be applied on oscillators and other indicators having OHLC values.
Zigzag Settings : Allows users to enable different zigzag base and set length and depth for each zigzag.
Scanning Settings : Pattern scanning settings set some parameters that define the pattern recognition process.
Display Settings : Determine the display of indicators including colors, lines, labels etc.
Backtest Settings : Allows users to set a predetermined back test bars so that the indicator will not time out while trying to run for all available bars.

Auto Chart Patterns [Trendoscope®]🎲 Introducing our most comprehensive automatic chart pattern recognition indicator.
Last week, we published an idea on how to algorithmically identify and classify chart patterns.
This indicator is nothing but the initial implementation of the idea. Whatever we explained in that publication that users can do manually to identify and classify the pattern, this indicator will do it for them.
🎲 Process of identifying the patterns.
The bulk of the logic is implemented as part of the library - chartpatterns . The indicator is a shell that captures the user inputs and makes use of the library to deliver the outcome.
🎯 Here is the list of steps executed to identify the patterns on the chart.
Derive multi level recursive zigzag for multiple base zigzag length and depth combinations.
For each zigzag and level, check the last 5 pivots or 6 pivots (based on the input setting) for possibility of valid trend line pairs.
If there is a valid trend line pair, then there is pattern.
🎯 Rules for identifying the valid trend line pairs
There should be at least two trend lines that does not intersect between the starting and ending pivots.
The upper trend line should touch all the pivot highs of the last 5 or 6 pivots considered for scanning the patterns
The lower trend line should touch all the pivot lows of the last 5 or 6 pivots considered for scanning the patterns.
None of the candles from starting pivot to ending pivot should fall outside the trend lines (above upper trend line and below lower trend line)
The existence of a valid trend line pair signifies the existence of pattern. What type of pattern it is, to identify that we need to go through the classification rules.
🎲 Process of classification of the patterns.
We need to gather the following information before we classify the pattern.
Direction of upper trend line - rising, falling or flat
Direction of lower trend line - rising, falling or flat
Characteristics of trend line pair - converging, expanding, parallel
🎯 Broader Classifications
Broader classification would include the following types.
🚩 Classification Based on Geometrical Shapes
This includes
Wedges - both trend lines are moving in the same direction. But, the trend lines are either converging or diverging and not parallel to each other.
Triangles - trend lines are moving in different directions. Naturally, they are either converging or diverging.
Channels - Both trend lines are moving in the same direction, and they are parallel to each other within the limits of error.
🚩 Classification Based on Pattern Direction
This includes
Ascending/Rising Patterns - No trend line is moving in the downward direction and at least one trend line is moving upwards
Descending/Falling Patterns - No trend line is moving in the upward direction, and at least one trend line is moving downwards.
Flat - Both Trend Lines are Flat
Bi-Directional - Both trend lines are moving in opposite direction and none of them is flat.
🚩 Classification Based on Formation Dynamics
This includes
Converging Patterns - Trend Lines are converging towards each other
Diverging Patterns - Trend Lines are diverging from each other
Parallel Patterns - Trend Lines are parallel to each others
🎯 Individual Pattern Types
Now we have broader classifications. Let's go through in detail to find out fine-grained classification of each individual patterns.
🚩 Ascending/Uptrend Channel
This pattern belongs to the broader classifications - Ascending Patterns, Parallel Patterns and Channels. The rules for the Ascending/Uptrend Channel pattern are as below
Both trend lines are rising
Trend lines are parallel to each other
🚩 Descending/Downtrend Channel
This pattern belongs to the broader classifications - Descending Patterns, Parallel Patterns and Channels. The rules for the Descending/Downtrend Channel pattern are as below
Both trend lines are falling
Trend lines are parallel to each other
🚩 Ranging Channel
This pattern belongs to the broader classifications - Flat Patterns, Parallel Patterns and Channels. The rules for the Ranging Channel pattern are as below
Both trend lines are flat
Trend lines are parallel to each other
🚩 Rising Wedge - Expanding
This pattern belongs to the broader classifications - Rising Patterns, Diverging Patterns and Wedges. The rules for the Expanding Rising Wedge pattern are as below
Both trend lines are rising
Trend Lines are diverging.
🚩 Rising Wedge - Contracting
This pattern belongs to the broader classifications - Rising Patterns, Converging Patterns and Wedges. The rules for the Contracting Rising Wedge pattern are as below
Both trend lines are rising
Trend Lines are converging.
🚩 Falling Wedge - Expanding
This pattern belongs to the broader classifications - Falling Patterns, Diverging Patterns and Wedges. The rules for the Expanding Falling Wedge pattern are as below
Both trend lines are falling
Trend Lines are diverging.
🚩 Falling Wedge - Contracting
This pattern belongs to the broader classifications - Falling Patterns, Converging Patterns and Wedges. The rules for the Converging Falling Wedge are as below
Both trend lines are falling
Trend Lines are converging.
🚩 Rising/Ascending Triangle - Expanding
This pattern belongs to the broader classifications - Rising Patterns, Diverging Patterns and Triangles. The rules for the Expanding Ascending Triangle pattern are as below
The upper trend line is rising
The lower trend line is flat
Naturally, the trend lines are diverging from each other
🚩 Rising/Ascending Triangle - Contracting
This pattern belongs to the broader classifications - Rising Patterns, Converging Patterns and Triangles. The rules for the Contracting Ascending Triangle pattern are as below
The upper trend line is flat
The lower trend line is rising
Naturally, the trend lines are converging.
🚩 Falling/Descending Triangle - Expanding
This pattern belongs to the broader classifications - Falling Patterns, Diverging Patterns and Triangles. The rules for the Expanding Descending Triangle pattern are as below
The upper trend line is flat
The lower trend line is falling
Naturally, the trend lines are diverging from each other
🚩 Falling/Descending Triangle - Contracting
This pattern belongs to the broader classifications - Falling Patterns, Converging Patterns and Triangles. The rules for the Contracting Descending Triangle pattern are as below
The upper trend line is falling
The lower trend line is flat
Naturally, the trend lines are converging.
🚩 Converging Triangle
This pattern belongs to the broader classifications - Bi-Directional Patterns, Converging Patterns and Triangles. The rules for the Converging Triangle pattern are as below
The upper trend line is falling
The lower trend line is rising
Naturally, the trend lines are converging.
🚩 Diverging Triangle
This pattern belongs to the broader classifications - Bi-Directional Patterns, Diverging Patterns and Triangles. The rules for the Diverging Triangle pattern are as below
The upper trend line is rising
The lower trend line is falling
Naturally, the trend lines are diverging from each other.
🎲 Indicator Settings - Auto Chart Patterns
🎯 Zigzag Settings
Zigzag settings allow users to select the number of zigzag combinations to be used for pattern scanning, and also allows users to set zigzag length and depth combinations.
🎯 Scanning Settings
Number of Pivots - This can be either 5 or 6. Represents the number of pivots used for identification of patterns.
Error Threshold - Error threshold used for initial trend line validation.
Flat Threshold - Flat angle threshold is used to identify the slope and direction of trend lines.
Last Pivot Direction - Filters patterns based on the last pivot direction. The values can be up, down, both, or custom. When custom is selected, then the individual pattern specific last pivot direction setting is used instead of the generic one.
Verify Bar Ratio - Provides option to ignore extreme patterns where the ratios of zigzag lines are not proportionate to each other.
Avoid Overlap - When selected, the patterns that overlap with existing patterns will be ignored while scanning. Meaning, if the new pattern starting point falls between the start and end of an existing pattern, it will be ignored.
🎯 Group Classification Filters
Allows users to enable disable patterns based on group classifications.
🚩 Geometric Shapes Based Classifications
Wedges - Rising Wedge Expanding, Falling Wedge Expanding, Rising Wedge Contracting, Falling Wedge Contracting.
Channels - Ascending Channel, Descending Channel, Ranging Channel
Triangles - Converging Triangle, Diverging Triangle, Ascending Triangle Expanding, Descending Triangle Expanding, Ascending Triangle Contrcting and Descending Triangle Contracting
🚩 Direction Based Classifications
Rising - Rising Wedge Contracting, Rising Wedge Expanding, Ascending Triangle Contracting, Ascending Triangle Expanding and Ascending Channel
Falling - Falling Wedge Contracting, Falling Wedge Expanding, Descending Triangle Contracting, Descending Triangle Expanding and Descending Channel
Flat/Bi-directional - Ranging Channel, Converging Triangle, Diverging Triangle
🚩 Formation Dynamics Based Classifications
Expanding - Rising Wedge Expanding, Falling Wedge Expanding, Ascending Triangle Expanding, Descending Triangle Expanding, Diverging Triangle
Contracting - Rising Wedge Contracting, Falling Wedge Contracting, Ascending Triangle Contracting, Descending Triangle Contracting, Converging Triangle
Parallel - Ascending Channel, Descending Channgel and Ranging Channel
🎯 Individual Pattern Filters
These settings allow users to enable/disable individual patterns and also set last pivot direction filter individually for each pattern. Individual Last Pivot direction filters are only considered if the main "Last Pivot Direction" filter is set to "custom"
🎯 Display Settings
These are the settings that determine the indicator display. The details are provided in the tooltips and are self explanatory.
🎯 Alerts
A basic alert message is enabled upon detection of new pattern on the chart.

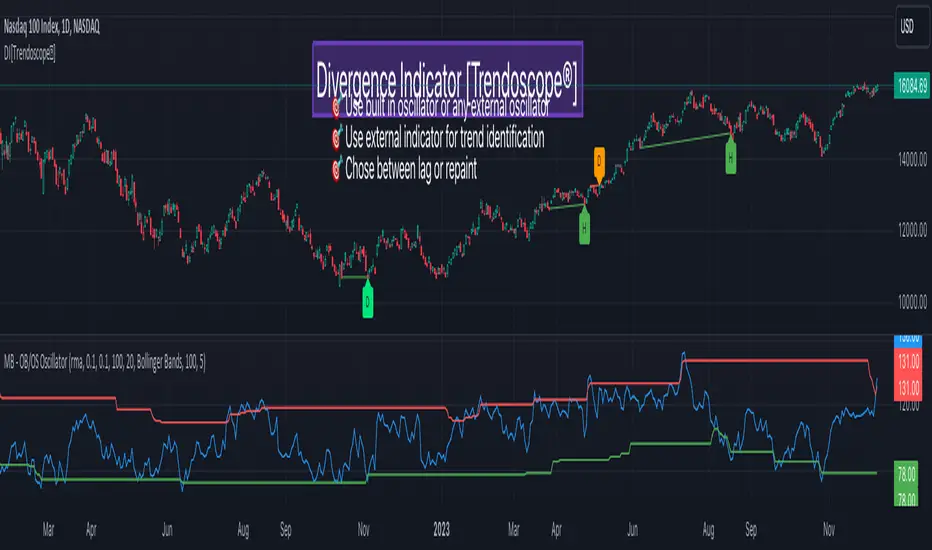
Divergence Indicator [Trendoscope®]🎲 New Divergence Indicator by Trendoscope
Our latest Divergence Indicator revolutionizes the way traders identify market trends and potential reversals. Built upon the robust foundation of the Zigzag Trend Divergence Detector and inline with our recent implementation of the Divergence Goggles indicator, this tool is designed to be intuitive yet powerful, making it an essential addition to any trader's toolkit.
We received several queries on extending the Divergence Goggles to last N bars instead of using an interactive widget. Though it is possible, we thought the better approach is to enable the indicator to use any oscillator and trend indicator in order to define the divergence.
🎯 Key Features
Flexible Oscillator Integration : Choose from a wide range of built-in oscillators or import your own, including options like the innovative Multiband Oscillator. This versatility extends to using volume indicators like OBV for divergence calculations, broadening the scope of analysis.
Trend Identification Versatility : Utilize built-in methods like Zigzag and MA Difference, or integrate external trend indicators. Our system adapts to various methods, ensuring you have the right tools for precise trend identification.
Customizable Zigzag Sensitivity : Adjust the Zigzag based on your chosen oscillator's sensitivity to ensure divergence lines are accurate and visually coherent.
Repainting vs. Delayed Signals : Tailor the indicator to your strategy by choosing between immediate repainting signals and slightly delayed but more stable signals.
🎯 Understanding Divergence: Key Rules
Bullish Divergence
Happens only in downtrend
Observed on Pivot Lows
Price makes lower low whereas oscillator makes higher low, indicating weakness and possible reversal
Bearish Divergence
Happens only in uptrend
Observed on Pivot Highs
Price makes higher high whereas oscillator makes lower high, indicating weakness and possible reversal
Bullish Hidden Divergence
Happens only in uptrend
Observed on Pivot Lows
Price makes higher low, whereas indicator makes lower low due to price consolidation. In bullish trend, this is considered as bullish as the price gets a breather and get ready to surge further.
Bearish Hidden Divergence
Happens only in downtrend
Observed on Pivot Highs
Price makes lower high whereas oscillator makes higher high due to price consolidation. In bearish trend, this is considered as bearish as the price gets a breather and get ready to fall further.
🎯 Visual Insights: Divergence and Hidden Divergence
For a clearer understanding, refer to our visual guides:
🎲 Using the Divergence Indicator: A Step-by-Step Guide
🎯 Step 1 - Selecting the Oscillator
Customize your analysis by choosing from a variety of oscillators or importing your preferred one. Options are available to select a range of built-in oscillators and the loopback length. However, if the oscillator that user want to use is not in the list, they can simply load the oscillator from the indicator library and use it as an external signal.
In our current example, we are using a custom oscillator called - Multiband Oscillator
This also means, the indicator option is not limited to oscillators. Users can even make use of volume indicators such as OBV for the calculation of divergence.
🎯 Step 2 - Choosing the Trend Identification Method
Select from our built-in methods or integrate an external indicator to accurately identify market trends. Trend is one of the key parameters of divergence type identification. Trend can be identified mathematically by various methods. Some of them are as simple as above or below 200 moving average and some can follow trend based indicators such as supertrend and others can be very complex.
To cater for a wider audience, here too we have provided the option to use an external trend indicator. The simple condition for the external trend indicator is that it should return positive value for uptrend and negative value for downtrend.
Other than that, we also have 2 built in trend identification methods.
Zigzag - The trend is defined by the starting pivot of divergence line. If the starting pivot is Higher High or Higher Low, then it is considered uptrend. And if the starting pivot is either Lower Low or Lower High, then we consider it as downtrend.
MA Difference - In this case, the difference between the moving average of pivots joining the divergence line will determine the trend. It is considered uptrend if the moving average increased from starting pivot to ending pivot of the divergence line, and it is considered downtrend if the moving average decreased from starting pivot to the ending pivot of the divergence line.
🎯 Step 3 - Adjusting Zigzag Sensitivity
Fine-tune the Zigzag to match the oscillator's sensitivity, ensuring divergence lines are accurate and visually coherent.
🎯 Step 4 - Managing Repainting
Understand the implications of repainting in the last pivot of the Zigzag and choose between immediate or delayed signals based on your trading strategy. The last pivot of the zigzag repaint by design. This is not necessarily a bad thing. Users can just choose not to use the last pivot, but instead use the last but one for all the calculations. But, this also means, the signals will be delayed.
Indicator provides option to use repainting signal vs delayed signal. If you select the repaint option, the signals are shown immediately as and when they occur. But, there is a possibility that these signals change when the new price candles change zigzag pivot.
If you chose not to select the repaint option, then the divergence signals may lag by a few bars.
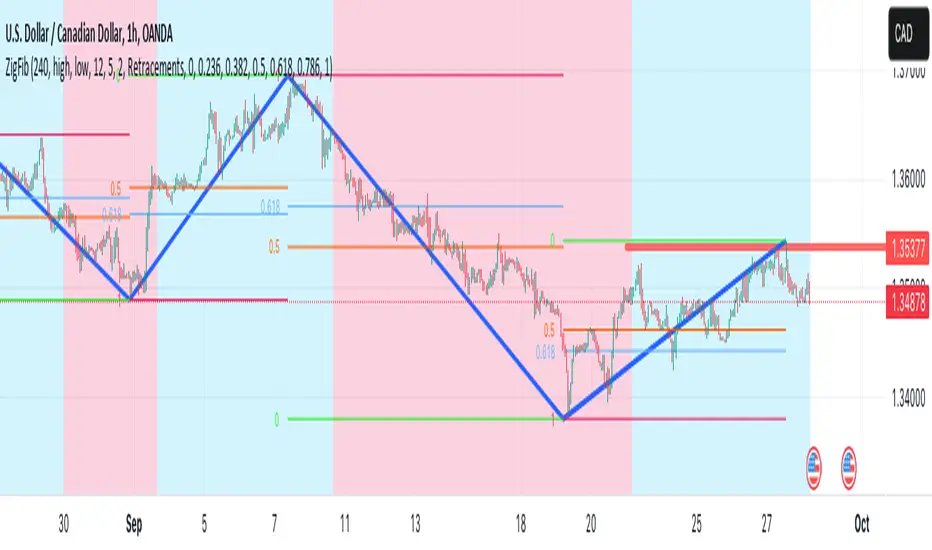
ZigZag++ FibonacciAuto Fibonacci tools are powerful ways designed to simplify your technical analysis by automatically drawing Fibonacci retracement and extension levels on your chart. This indicator is built to enhance your trading experience with clearer market moves and informative insights.
You can easily spot your waves and patterns when the percentages are moving with you.
Key Features:
Automated Fibonacci Levels: Plots Fibonacci retracement and extension levels based on recent price movements.
Multi-Timeframe Support: This indicator is your versatile companion, offering multi-timeframe functionality. You can seamlessly track Fibonacci levels across different resolutions, providing a comprehensive view of the market.
Two Types of Fibs: Retracement and Timeframe extension Fibonacci levels. Use retracements to identify potential reversal points and extensions to anticipate price targets, giving you a well-rounded perspective on market movements.
Benefits:
Save Time: No more manual Fibonacci drawing; It does this for you in real-time.
Enhanced Analysis: Gain a deeper understanding of potential support, resistance, and price targets.
User-Friendly: Suitable for traders of all levels, this indicator simplifies complex technical analysis.
For the math lovers
I started creating the ZigZag++ based on the MT4 calculation as I found it better performing than the tradingview inbuilt one. I have revised the calculation couple of times and now the final calculation is simple yet more accurate for my analysis.
First, I observe the market direction for the last Depth setting by comparing the rate at which high values reduce and low values increase. When the number of ticks set by Deviation is crossed and the last cross is more than the Backstep candles, then we have our ZigZag points.
These are the points we use in our Fibonacci calculation.
Checkout ZigLib below to use the same logic in your scripts.
Sample usage
This is a 4 Hour configuration with the default settings.
When the trend reversed, some key points I watch are 0.618 and 0.5. The market retraced back and formed the new point for the next ZigZag line on that level. This market behaviour happens quite often on these Fibonacci points. I would be looking for reversal or a break in this zone to know the next step.
Resources
ZigZag++ Lib by me; for retrieving the line points.
Fibonacci Toolkit by Lux Algo; For drawing the Timeframe Fibs. Very Amazing script.
Smart Money Breakouts [ChartPrime]The " Smart Money Breakouts " indicator is designed to identify breakouts based on changes in character (CHOCH) or breaks of structure (BOS) patterns, facilitating automated trading with user-defined Take Profit (TP) level.
the indicator incorporates essential elements such as volume analysis and a data table to assist traders in optimizing their strategies.
🔸 Breakout Detection:
The indicator scans price movements for "Change in Character" (CHOCH) and "Break of Structure" (BOS) patterns, signaling potential breakout opportunities in the market.
🔸User-Defined TP :
Traders can customize the Take Profit (TP) through the indicator settings, with these levels dynamically calculated based on the Average True Range (ATR). This allows for precise risk management and profit targets that adapt to market volatility.
🔸 Volume Analysis and Trade Direction Specific Analysis:
The indicator includes a volume checker that provides valuable insights into the strength of the breakout, taking into account trade direction.
🔸If the volume label is red and the trade is long, it suggests a higher likelihood of hitting the Stop Loss (SL).
🔸If the volume label is green and the trade is long, it indicates a higher probability of hitting the Take Profit (TP).
🔸For short trades, a red volume label suggests a higher likelihood of hitting TP, while a green label suggests a higher likelihood of hitting SL.
🔸A yellow volume label suggests that the volume is inconclusive, neither favoring bullish nor bearish movements.
🔸Data Table:
The indicator features a data table that keeps track of the number of winning and losing trades for specific timeframes or configurations.
This table serves as a valuable tool for traders to analyze performance and discover optimal settings and timeframes.
The "Smart Money Breakouts" indicator provides traders with a comprehensive solution for breakout trading, combining technical analysis of changes in character and breaks of structure, volume insights, and performance tracking while dynamically adjusting TP and SL levels based on market volatility through the ATR.

Trendline Breakouts With Targets [ChartPrime]The Trendline Breakouts With Targets indicator is meticulously crafted to improve trading decision-making by pinpointing trendline breakouts and breakdowns through pivot point analysis.
Here's a comprehensive look at its primary functionalities:
Upon the occurrence of a breakout or breakdown, a signal is meticulously assessed against a false signal condition/filter, after which the indicator promptly generates a trading signal. Additionally, it conducts precise calculations to determine potential target levels and then exhibits them graphically on the price chart.
🔷 Key Features:
🔸 Trendline Drawing: The indicator automatically plots trendlines based on significant pivot points and wick data, visually representing the prevailing trend.
🔸 Breakout and Breakdown Signals : It triggers trading signals when a breakout (price moves above the trendline) or a breakdown (price moves below the trendline) is detected, helping traders identify potential entry points.
🔸 False Breakout/ Breakdown Filter ✔️: To enhance accuracy, the indicator incorporates a filter to reduce false breakout and breakdown signals, helping traders avoid premature entries.
🔸 Target Calculation: The indicator performs target-level calculations, a critical aspect of trade management.
These calculated target levels are visually displayed on the price chart, helping traders set precise profit targets and make well-informed trading decisions.
🔸 Color-Change Labels: The indicator features label color changes to provide quick visual cues. Labels are initially displayed in orange. When a take profit (TP) level is reached, the label changes to green, indicating a successful trade. Conversely, if a stop-loss (SL) level is hit, the label turns red, signaling a losing trade.
🔸 Settings :
This indicator combines technical analysis, trendline identification, breakout/breakdown signals, and risk management tools to assist traders in making more informed and efficient trading decisions. It can be a valuable addition to any trader's toolkit, helping them identify potential trade opportunities and manage risk effectively.

ABC on Recursive Zigzag [Trendoscope]There are several implementations of ABC pattern in tradingview and pine script. However, we have made this indicator to provide users additional quantifiable information along with flexibility to experiment and develop their own strategy based on the patterns.
🎲 Highlights of this indicator over other ABC implementations are:
Implementation is based on recursive multi level zigzag allows bigger as well as smaller patterns to be identified
Allows users to set their trading rules with respect to entry, target and stop ratios, experiment and build their own strategy based on the ABC pattern.
Back test summary including win ratio and risk reward will help users understand the profitability based on different settings being used.
🎲 Concept of ABC Pattern
The ABC pattern, also known as the "Corrective Wave" or "Zigzag Pattern," is a fundamental concept in Elliott Wave Theory, which is widely used in technical analysis to identify and predict price movements in financial markets.
The ABC pattern is a three-wave corrective pattern that typically occurs within the context of a larger impulse or trending wave. It consists of two smaller waves in the opposite direction (A and C) separated by a corrective wave (B). These waves are labeled alphabetically and represent price movements.
Wave A (Impulse Wave): Wave A is the first leg of the ABC pattern and is characterized by a strong price move in the opposite direction of the prevailing trend. It is often driven by a fundamental or sentiment-driven event that temporarily disrupts the trend.
Wave B (Corrective Wave): Wave B is the corrective wave that follows Wave A. It represents a partial retracement of Wave A's price movement. Wave B can take various forms, such as a simple correction or a complex correction (e.g., a triangle or a flat correction). It typically doesn't retrace the entire length of Wave A.
Wave C (Impulse Wave): Wave C is the final leg of the ABC pattern and is characterized by a strong price move in the same direction as the prevailing trend. It often surpasses the starting point of Wave A and confirms the resumption of the larger trend.
🎲 Indicator Components
Upon loading the indicator on the chart, we can observe the following components on the chart.
Pattern Drawings is the graphical representation of present patterns. Please note that it is not necessary for patterns to be there on the chart all the time. Patterns will appear on the chart when price makes the patterns.
Trade Box is the box representing trade signals of the pattern. These trade levels are generated based on the user settings.
Summary Table is the back test summary containing details of historical pattern performance including Win Ratio and Risk Reward.
🎲 Indicator Settings
Details of each user settings are provided in the tooltips. Below is the snapshot of it.
🎲 Alerts
Basic level of alerts are built in the script using alert function to highlight the following conditions:
New ABC Pattern
Updates to existing Pattern
Both conditions will alert simple text messages. There is not much customization provided as part of this indicator. We will consider providing more options in future versions based on the interest and demand shown by users.

CANDLE STICK HEATMAPCANDLE STICK HEATMAP shows the statistics of a candle at a particular time. its very useful to find repeating pattern's at a particular time in a day.
based on the settings you can see regular repeating patterns of a day in an hourly chart. During a particular time in day there is always a down or up signal or candles.
The table boxes are candles in RED and GREEN based on open and close of the chart. The Heat map is very useful in analyzing the daily Hourly candlesticks in a week. The Time of each candlestick is plotted on the table along with default Indicators like RSI, MACD, EMA, VOLUME, ADX.
Additionally this can be used as a screener of candles on all timeframes. Analysis is easy when you want to see what happened exactly at a particular time in the previous hour, day, month etc.,
Hopefully additional updates will be introduced shortly.
Indicators:
1. MACD (close,12,26,9)
2.RSI (close,14)
3.EMA 200
3.Volume MA
Option is provided to show indicator statistics and time.
Color can be changed using settings.
Supports all Time Zones

Recursive Reversal Chart Patterns [Trendoscope]Caution: This algorithm is very heavy and bound to cause timeouts. If that happens, there are few settings you can change to reduce the load. (Will explain them in the description below)
🎲 Recursive Reversal Chart Patterns Indicator
Welcome to another exploration of Zigzag and Pattern ecosystem components. Previously we derived Pitchfork and Recursive Zigzag indicators. This indicator is designed to scan and highlight few popular "Reversal Chart Patterns". Similar to other indicators in the ecosystem, this too is built on recursive zigzags.
Double Taps
Triple Taps
Cup and Handles
Head and Shoulders
Indicator however names the patterns separately for bullish and bearish formations. So, the actual names you see on the screen are
Double Top
Double Bottom
Triple Top
Triple Bottom
Cup and Handle
Inverted Cup and Handle
Head and Shoulders
Inverse Head and Shoulders
Here is a snapshot on how each category of patterns look on the chart.
🎲 Architecture
Many of you may be cursing me for publishing too many libraries. But, these are all preparations for something big. Like other indicators in the Zigzag and Patterns Ecosystem, this too uses a bunch of libraries.
🎯Major direct dependencies
ZigzagTypes
ZigzagMethods
ReversalChartPatternLibrary
🎯Indirect dependencies
DrawingTypes
DrawingMethods
🎯Minor dependencies
Utils
TradeTracker
🎲 Indicator Settings
🎯Generic and Zigzag Settings.
Note: In case of timeout, please decrease the value of depth parameter
🎯Pattern Selection
Having all the patterns selected on chart may also cause timeouts and will make the chart look messy. It is better to limit one or two patterns on the chart to have clear picture.
🎯Scanner Settings
🎯Indicators.
These are options to use indicators as secondary confirmation to calculate divergence. If selected, the patterns are shown only if the divergence data is inline. Option also available to plugin external indicator. These calculations are not straightforward and not easy to measure by manual inspection. This feature at present is purely experimental.
Have a go and let me know how you feel :)

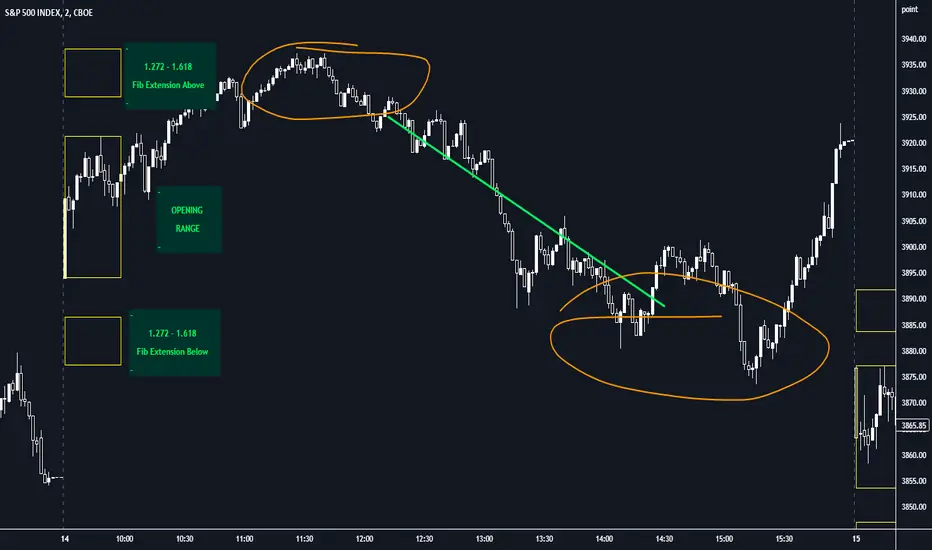
Opening Range with FibsThe indicator uses a time range and another instrument for time reference, so that it works in the time zone you care about. I have set the default to SPX500USD since it is in EST ( SPX , ES and many futures are on Chicago time and opening range gets confused). You can change the reference instrument in the settings.
You can also change the multipliers and use other values instead of 1.272 and 1.618 for Fib extensions.
TradingView has a limit as to how many objects an indicator can create so if you want to go back further for visual backtesting - use the replay tool - it will be able to draw up to the time you selected within its limits.
Let me know if you need anything else...
Happy Trading!
30MIN CYCLE█ HOW DOES IT WORK?
The known 90 min cycle is used as one killzone. But actually all 18 min are relevant to search for a trade. All 18 min when a new box starts only then is the placement of an order valid. If the entry candle isn't in a box then it will probably fail. The boxes should only be used in the M1 or M5 timeframe. The best hitrate is in the M1 timeframe. Included are the last 48 "Mini-Killzones" für intraday trading and backtesting. These "Mini-Killzones" can be used with the "Liquidity Inducement Strategy".
█ WHAT MAKES IT UNIQUE?
This is the first indicator on tradingview that shows all mini-killzones for trading and backtesting a whole tradingday. The well-known killzones of ICT are from 08:00-11:00 and 14:00 - 17:00 (UTC+1) but with this indicator there is finally a refinement of the ICT Smart Money Concept killzones.
█ HOW TO USE IT?
For a proper use of this indicator we suggest to know already at least SMC or better Liquidity Indcuement Trading. This indicator is a further confluence before placing an order. After you made your setup you will have these mini-killzones as a confluence. We don't suggest to open a trade only according to this indicator.
█ ADDITIONAL INFO
This indicator is free to use for all tradingview users.
█ DISCLAIMER
This is not financial advice.

Wolfe Strategy [Trendoscope]Hello Everyone,
Wish you all Merry X-Mas and happy new year. Lets start 2023 with fresh new strategy built on Wolfe Indicator. Details of the indicator can be found here
🎲 Wolfe Concept
Wolfe concept is simple. Whenever a wedge is formed, draw a line joining pivot 1 and 4 as shown in the chart below:
For simplicity, we will only consider static value for Target and Stop. But, entry is done based on breaking the triangle. Revised strategy looks something like this:
🎲 Settings
Settings are simple and details of each are provided via tooltips.
Out of these, the most important one is minimum risk reward ratio. If you set lower risk reward threshold then losing few trades may generate more losses than more winning trades. Similarly higher value will filter out most of the trades and may not work efficiently. Default value set to 1 to make sure optimal risk reward is present before placing trade. Also make note that since the entry bar is always moving towards stop, as and when pattern progress, the RR will also increase. Hence, a pattern which is below RR threshold may become good to trade at certain point of time in future.
🎲 Strategy Parameters
Default strategy parameters are initialised via definition. Margins are set to 100 to disable leveraged trades. Appropriate values are chosen for other parameters. These can be altered based on individual strategy and trading plan.
As the strategy concentrates on the single pattern, number of trades generated are comparatively less. But, there is chance to increase the algorithm further to catch more such patterns on larger scale. Will try to work on them in next versions.
🎲 Pine Strategy limitations
Backtest can only be done on one direction as pine strategy cannot have both long and short open trades together. Hence, it is mandatory to chose either long/short trades in settings.
Since pyramiding is limited to 1, there is possibility of a pattern not generating trade even though the entry conditions are met. They are just based on pine limitations and not necessarily mean patterns are not good for placing trades.

mess JBI have made an all in one powerful script. It contains all meme lines(Moving average, Ema, Dema, Vwma, Hma)
In general, orange color means negative and white means positive. But you can very easily customize the colors according to your need and enable and disable any meme line.
Dots represent change of price action, although it works on every time frame but I have got best results on 15minute and 4hour Time Frame.
Cross represent change in volume. Now that's the most powerful thing, I have picked time segmented oscillator and changed the cod to represent Volume change. To take a better note of market, Start from Bigger Time frames. This indicator predicted every move Perfectly.
Enjoy

Cup & HandleHi, here is my take on 'Cup & Handle'
Pivot Points - ph (highest points in a certain period) are stored in an array
When there is a new ph , previous ph's are compared to the latest one.
A temporary test line is drawn between these 2 points.
The script checks if a close (between these 2 points) doesn't break above this test line.
(test line is deleted afterwards)
If it doesn't, and the '% max breaks' are not breached, 2 circle shaped lines are drawn
(Top & Bottom line of the cup) which forms the Cup, together with the Handle.
The red box (Handle) is the maximum 33-50% retracement (% of cup height)
-> Only the latest pattern is shown, enabling 'Show Cup labels' shows the position of cup patterns in history.
They can be visualised by using 'Bar Replay'
'% max breaks' -> 'maximum highs/lows breaking through the Top/Bottom line
(% of bars between left & right extreme points of the Cup)
Settings:
- 'Left', 'Right' -> regulates Pivot Point values
- 'PP back' -> max lookback for Pivot High
More explanation can be found in following print screens,
or by checking the tooltips in the settings
Cheers!

Crab Range FinderFinds the "crab range" of current price action.
///////
The lines corresponds are follows:
Green line represents the average high price
Orange line represents the median price
Yellow line represents the average low price
///////
By default, the last 5 bars are used when calculating the price lines, this value can be changed in settings as needed to tune for accuracy.

Wedge and Flag Finder (Multi - zigzag)Here is a small attempt to automatically identify wedges and flags.
Tradingview standard wedge checks for only 4 pivots. In this version, I have considered 5 pivots instead - which can help reduce noise as 4 pivots forming wedge can be quite common. In future, will also try to add more pivots in pattern recognition to make the signal more accurate.
If wedge comes with a tail, then it is marked as flag :)
Settings are quite simple and they are as shown below

CyclesTime based indicator attempting to show changes in a cycle based on the different time elapsed between new highs and new lows in a given time period. Useful when combined with elliott wave price structure. A drop above/below 0 suggests a wave 4 whilst new highs/lows of the indicator suggest whether a bullish or bearish trend is in place. You can change the time cycle as you like. Any Q's please post, i'll be happy to answer them. (If I can)

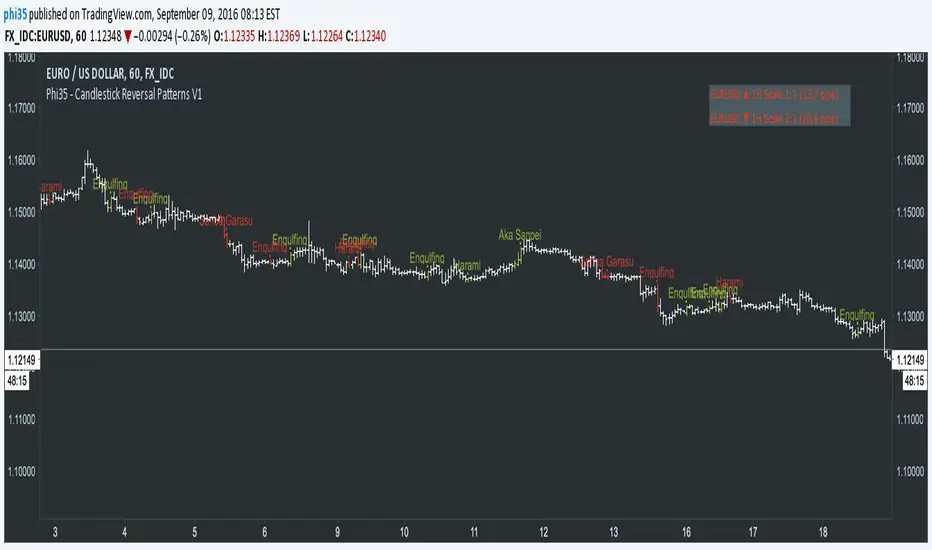
Phi35 - Candlestick Reversal Patterns V1 ©Candlestick Reversal Pattern V1 by Phi35 - 9rd September 2016 ©
Check also my " Candlestick Continuation Pattern " indicator which will follow soon!
Do not modify the code without my permission!
If there is an issue or any suggestions, feel free to contact me on the link below
www.tradingview.com
www.tradingview.com
It seems to work well but still no guarantee on completeness!
RISK WARNING! PAST PERFORMANCE IS NOT NECESSARILY INDICATIVE OF FUTURE RESULTS. IN MAKING AN INVESTMENT DECISION, TRADERS MUST RELY ON THEIR OWN EXAMINATION OF THE ENTITY MAKING THE TRADING DECISIONS!
Wait always for confirmation (next opening price or closing price)!!
RECOGNIZABLE REVERSAL PATTERNS
01.Engulfing
02.Harami
03.Piercing Line
04.Morning Star
05.Evening Star
06.Belt Hold
07.Three White Soldiers
08.Three Black Crows
09.Three Stars in the South
10.Stick Sandwich
11.Meeting Line
12.Kicking
13.Ladder Bottom
Although the Engulfing and Harami Patterns are important but can occur too often and give false signals, I give you the option to turn them completely off.
Donchian Fibo Channels v2Updated and fixed version of DFC.
- fixed bugs
- added permanent setting for direction
- added color change for terminal and breakout bars
- added smart timings for line of 100% retracement

