Rangemeter [theEccentricTrader]█ OVERVIEW
This indicator simply displays candle and peak to trough ranges in points or pips, depending on the symbol type, in a table, which can be repositioned and resized at the user's discretion.
█ CONCEPTS
Green and Red Candles
• A green candle is one that closes with a close price equal to or above the price it opened.
• A red candle is one that closes with a close price that is lower than the price it opened.
Open Green and Red Candles
• An open green candle is one that has a close price equal to or above the price it opened, but has not yet closed to confirm the condition.
• An open red candle is one that has a close price lower than the price it opened, but has not yet closed to confirm the condition.
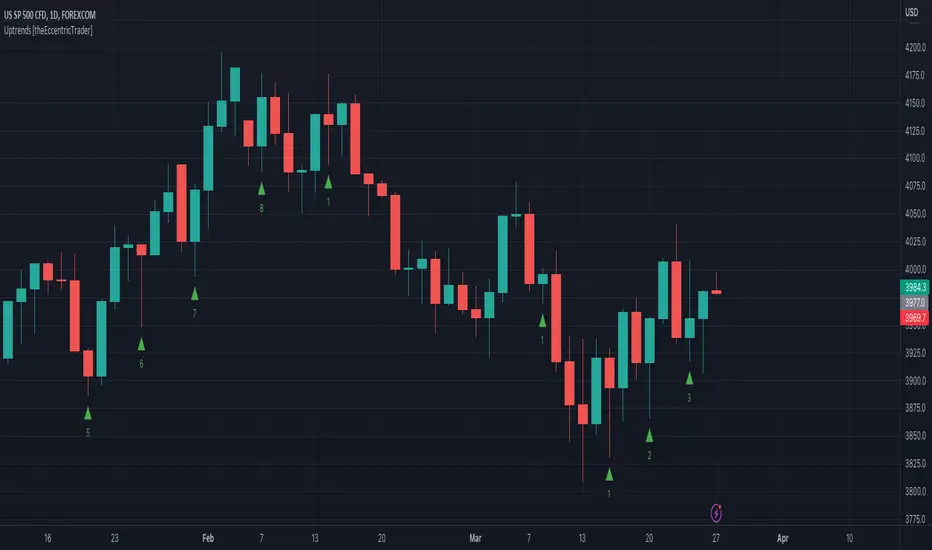
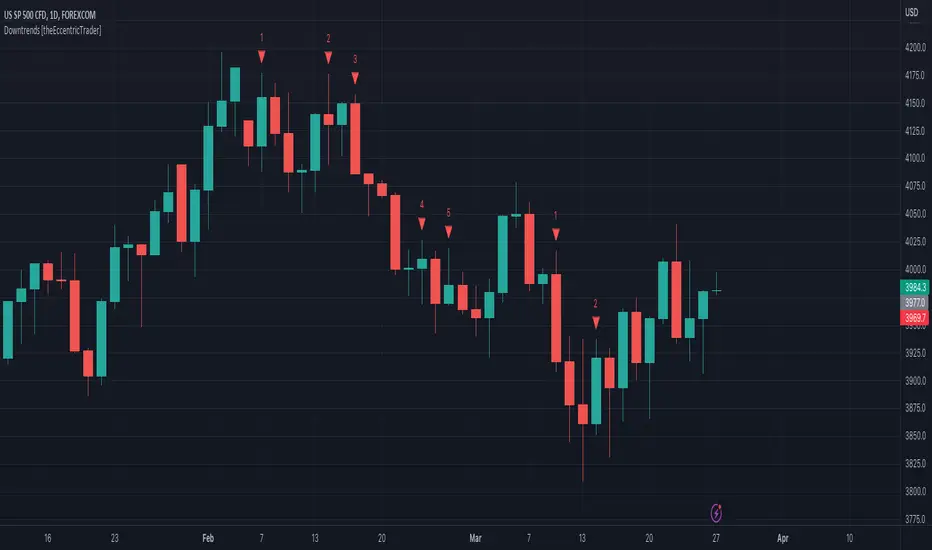
Swing Highs and Swing Lows
• A swing high is a green candle or series of consecutive green candles followed by a single red candle to complete the swing and form the peak.
• A swing low is a red candle or series of consecutive red candles followed by a single green candle to complete the swing and form the trough.
Peak and Trough Prices (Basic)
• The peak price of a complete swing high is the high price of either the red candle that completes the swing high or the high price of the preceding green candle, depending on which is higher.
• The trough price of a complete swing low is the low price of either the green candle that completes the swing low or the low price of the preceding red candle, depending on which is lower.
Historic Peaks and Troughs
The current, or most recent, peak and trough occurrences are referred to as occurrence zero. Previous peak and trough occurrences are referred to as historic and ordered numerically from right to left, with the most recent historic peak and trough occurrences being occurrence one.
Range
The range is simply the difference between the current peak and current trough prices, generally expressed in terms of points or pips.
Open Range
An open range is here defined as one that is forming but has not yet completed. For example, a swing low that has an open green candle proceeding a red candle or series of red candles. Or a swing high that has an open red candle proceeding a green candle or series of green candles.
The table will only display the open range under the aforementioned circumstances, otherwise it will display the current, or previous, range.
█ FEATURES
Inputs
• Show Candle Ranges
• Show Largest and Smallest Candle Ranges
• Average Candle Range Lookback
• Show Ranges
• Show Largest and Smallest Ranges
• Average Range Lookback
• Position
• Text Size
█ HOW TO USE
The indicator can be used for strategy filtering and development, gauging current market conditions versus historic and helping to make more informed discretionary trading decisions. It can also be used like my Wavemeter indicator to objectively set the angle and projection ratio for my Fan Projections and Parallel Projections indicators.
█ LIMITATIONS
Some higher timeframe candles on tickers with larger lookbacks such as the DXY , do not actually contain all the open, high, low and close (OHLC) data at the beginning of the chart. Instead, they use the close price for open, high and low prices. So, while we can determine whether the close price is higher or lower than the preceding close price, there is no way of knowing what actually happened intra-bar for these candles. And by default candles that close at the same price as the open price, will be counted as green. You can avoid this problem by ensuring the lookback for the average range does not reach as far back as the start of the chart. If you are unsure about the candle count you can use my Candle Counter indicator to find out how many candles are displayed on the chart.
The green and red candle calculations are based solely on differences between open and close prices, as such I have made no attempt to account for green candles that gap lower and close below the close price of the preceding candle, or red candles that gap higher and close above the close price of the preceding candle. I can only recommend using 24-hour markets, if and where possible, as there are far fewer gaps and, generally, more data to work with. Alternatively, you can replace the scenarios with your own logic to account for the gap anomalies, if you are feeling up to the challenge.
It is also worth noting that the lookback will be limited to your Trading View subscription plan. Premium users get 20,000 candles worth of data, pro+ and pro users get 10,000, and basic users get 5,000.
Penunjuk Pine Script®