Cryptolabs Global Liquidity Cycle Momentum IndicatorCryptolabs Global Liquidity Cycle Momentum Indicator (LMI-BTC)
This open-source indicator combines global central bank liquidity data with Bitcoin price movements to identify medium- to long-term market cycles and momentum phases. It is designed for traders who want to incorporate macroeconomic factors into their Bitcoin analysis.
How It Works
The script calculates a Liquidity Index using balance sheet data from four central banks (USA: ECONOMICS:USCBBS, Japan: FRED:JPNASSETS, China: ECONOMICS:CNCBBS, EU: FRED:ECBASSETSW), augmented by the Dollar Index (TVC:DXY) and Chinese 10-year bond yields (TVC:CN10Y). This index is:
- Logarithmically scaled (math.log) to better represent large values like central bank balances and Bitcoin prices.
- Normalized over a 50-period range to balance fluctuations between minimum and maximum values.
- Compared to prior-year values, with the number of bars dynamically adjusted based on the timeframe (e.g., 252 for 1D, 52 for 1W), to compute percentage changes.
The liquidity change is analyzed using a Chande Momentum Oscillator (CMO) (period: 24) to measure momentum trends. A Weighted Moving Average (WMA) (period: 10) acts as a signal line. The Bitcoin price is also plotted logarithmically to highlight parallels with liquidity cycles.
Usage
Traders can use the indicator to:
- Identify global liquidity cycles influencing Bitcoin price trends, such as expansive or restrictive monetary policies.
- Detect momentum phases: Values above 50 suggest overbought conditions, below -50 indicate oversold conditions.
- Anticipate trend reversals by observing CMO crossovers with the signal line.
It performs best on higher timeframes like daily (1D) or weekly (1W) charts. The visualization includes:
- CMO line (green > 50, red < -50, blue neutral), signal line (white), Bitcoin price (gray).
- Horizontal lines at 50, 0, and -50 for improved readability.
Originality
This indicator stands out from other momentum tools like RSI or basic price analysis due to:
- Unique Data Integration: Combines four central bank datasets, DXY, and CN10Y as macroeconomic proxies for Bitcoin.
- Dynamic Prior-Year Analysis: Calculates liquidity changes relative to historical values, adjustable by timeframe.
- Logarithmic Normalization: Enhances visibility of extreme values, critical for cryptocurrencies and macro data.
This combination offers a rare perspective on the interplay between global liquidity and Bitcoin, unavailable in other open-source scripts.
Settings
- CMO Period: Default 24, adjustable for faster/slower signals.
- Signal WMA: Default 10, for smoothing the CMO line.
- Normalization Window: Default 50 periods, customizable.
Users can modify these parameters in the Pine Editor to tailor the indicator to their strategy.
Note
This script is designed for medium- to long-term analysis, not scalping. For optimal results, combine it with additional analyses (e.g., on-chain data, support/resistance levels). It does not guarantee profits but supports informed decisions based on macroeconomic trends.
Data Sources
- Bitcoin: INDEX:BTCUSD
- Liquidity: ECONOMICS:USCBBS, FRED:JPNASSETS, ECONOMICS:CNCBBS, FRED:ECBASSETSW
- Additional: TVC:DXY, TVC:CN10Y
Cari dalam skrip untuk "horizontal line"

gain indicatorhe "Percentage Ruler" indicator is a custom technical analysis tool designed for the TradingView platform. Its primary function is to visually represent percentage-based price levels on a chart, relative to the closing price of the previous candle. This allows traders to quickly gauge potential support and resistance levels or to estimate possible price movements based on historical data.
Key features of the indicator include:
Dynamic Percentage Levels: The indicator automatically calculates and displays horizontal lines corresponding to predefined percentage levels, both positive and negative, ranging from -5% to +5%.
Previous Candle Close: The percentage calculations are anchored to the closing price of the previous candle, providing a consistent reference point for analysis.
Clear Visual Representation: The percentage levels are represented by horizontal lines extending to the right edge of the chart. The lines are color-coded (green for positive percentages, red for negative percentages) for easy interpretation.
Customizable Appearance: The indicator offers customization options, allowing users to adjust the line thickness and the display of percentage labels.
No Labels by Default: The indicator is designed to display only the horizontal lines by default, without any percentage labels, providing a clean and uncluttered chart view.
In summary, the "Percentage Ruler" indicator is a valuable tool for traders seeking a straightforward way to visualize percentage-based price levels relative to the previous candle's close. It aids in identifying potential support and resistance zones and estimating possible price movements based on historical data.

Trend & ADX by Gideon for Indian MarketsThis indicator is designed to help traders **identify strong trends** using the **Kalman Filter** and **ADX** (Average Directional Index). It provides **Buy/Sell signals** based on trend direction and ADX strength. I wanted to create something for Indian markets since there are not much available.
In a nut-shell:
✅ **Buy when the Kalman Filter turns green, and ADX is strong.
❌ **Sell when the Kalman Filter turns red, and ADX is strong.
📌 **Ignore signals if ADX is weak (below threshold).
📊 Use on 5-minute timeframes for intraday trading.
------------------------------------------------------------------------
1. Understanding the Indicator Components**
- **Green Line:** Indicates an **uptrend**.
- **Red Line:** Indicates a **downtrend**.
- The **line color change** signals a potential **trend reversal**.
**ADX Strength Filter**
- The **ADX (orange line)** measures trend strength.
- The **blue horizontal line** marks the **ADX threshold** (default: 20).
- A **Buy/Sell signal is only valid if ADX is above the threshold**, ensuring a strong trend.
**Buy & Sell Signals**
- **Buy Signal (Green Up Arrow)**
- Appears **one candle before** the Kalman line turns green.
- ADX must be **above the threshold** (default: 20).
- Suggests entering a **long position**.
- **Sell Signal (Red Down Arrow)**
- Appears **one candle before** the Kalman line turns red.
- ADX must be **above the threshold** (default: 20).
- Suggests entering a **short position**.
2. Best Settings for 5-Minute Timeframe**
For day trading on the **5-minute chart**, the following settings work best:
- **Kalman Filter Length:** `50`
- **Process Noise (Q):** `0.1`
- **Measurement Noise (R):** `0.01`
- **ADX Length:** `14`
- **ADX Threshold:** `20`
- **(Increase to 25-30 for more reliable signals in volatile markets)**
3. How to Trade with This Indicator**
**Entry Rules**
✅ **Buy Entry**
- Wait for a **green arrow (Buy Signal).
- Kalman Line must **turn green**.
- ADX must be **above the threshold** (strong trend confirmed).
- Enter a **long position** on the next candle.
❌ **Sell Entry**
- Wait for a **red arrow (Sell Signal).
- Kalman Line must **turn red**.
- ADX must be **above the threshold** (strong trend confirmed).
- Enter a **short position** on the next candle.
**Exit & Risk Management**
📌 **Stop Loss**:
- Place stop-loss **below the previous swing low** (for buys) or **above the previous swing high** (for sells).
📌 **Take Profit:
- Use a **Risk:Reward Ratio of 1:2 or 1:3.
- Exit when the **Kalman Filter color changes** (opposite trend signal).
📌 **Avoid Weak Trends**:
- **No trades when ADX is below the threshold** (low trend strength).
4. Additional Tips
- Works best on **liquid assets** like **Bank Nifty, Nifty 50, and large-cap stocks**.
- **Avoid ranging markets** with low ADX values (<20).
- Use alongside **volume analysis and support/resistance levels** for confirmation.
- Experiment with **ADX Threshold (increase for stronger signals, decrease for more trades).**
Best of Luck traders ! 🚀

Choppiness IndexThis Pine Script v6 indicator calculates the Choppiness Index over a user-defined length and segments it based on user-defined thresholds for choppy and trending market conditions. The indicator allows users to toggle the visibility of choppy, trending, and neutral segments using checkboxes.
Here's how it works:
Inputs: Users can set the length for the Choppiness Index calculation and thresholds for choppy and trending conditions. They can also choose which segments to display.
Choppiness Index Calculation: The script calculates the Choppiness Index using the ATR and the highest-high and lowest-low over the specified length.
Segment Determination: The script determines which segment the current Choppiness Index value falls into based on the thresholds. The color changes exactly at the threshold values.
Dynamic Plotting: The Choppiness Index is plotted with a color that changes based on the segment. The plot is only visible if the segment is "turned on" by the user.
Threshold Lines: Dashed horizontal lines are plotted at the choppy and trending thresholds for reference.
This indicator helps traders visualize market conditions and identify potential transitions between choppy and trending phases, with precise color changes at the threshold values.

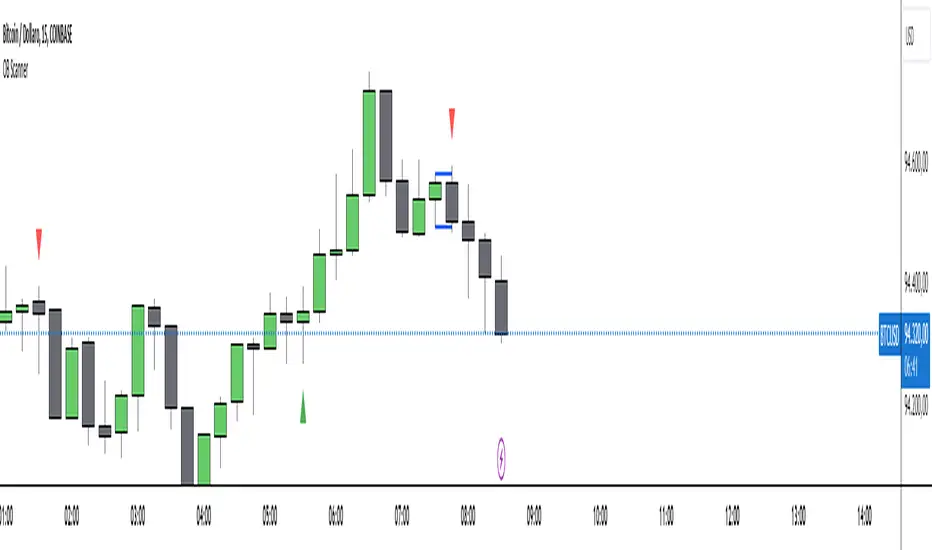
Outside Bar Scanner (Alessio)Outside Bar Scanner
Description:
The Outside Bar Scanner is a powerful indicator designed to automatically detect outside bars (or outside candles) on any timeframe. This tool is perfect for traders who want to quickly spot reversal or trend continuation opportunities based on one of the most significant patterns in technical analysis.
Key Features:
Automatic Detection of Outside Bars:
Identifies and marks bullish (long) and bearish (short) outside bars directly on the chart.
Each outside bar is highlighted with a label and an icon for clear visibility.
Previous Candle High and Low Lines:
Draws two horizontal lines indicating the high and low of the candle preceding the outside bar.
These lines help you quickly identify key support and resistance levels.
Built-In Alerts:
Receive real-time notifications whenever a new outside bar is detected, so you’ll never miss a trading opportunity.
How to Use:
Add the indicator to your chart and let it automatically detect outside bars, marking key high and low levels.
Use the alerts to get notified whenever a new outside bar forms.
Combine this indicator with other strategies or technical tools to enhance your analysis.
Perfect For:
Traders operating in any market (forex, stocks, cryptocurrencies, indices).
Short-term, medium-term, or long-term traders, as it works seamlessly across all timeframes.
Anyone looking to simplify their technical analysis and respond quickly to market signals.
Note: This indicator is a support tool and does not provide direct trading signals. It is recommended to combine it with other analyses for well-informed decision-making.
Previous Day High and Low by DRK TradingThe Previous Day High and Low Indicator is a simple yet powerful tool designed for traders who want to keep track of critical levels from the previous trading session. This indicator automatically marks the high and low of the previous day on your chart with dashed horizontal lines, making it easier to identify key support and resistance zones.
Features:
Horizontal Lines: Clearly marks the previous day's high and low levels.
Dynamic Updates: Automatically updates at the start of a new trading day.
Visual Clarity: Includes labels at the start of the day for quick reference.
Customizable: Works seamlessly across all timeframes and instruments.
Use Case:
Identify potential breakout and reversal zones.
Enhance intraday and swing trading strategies by focusing on key price levels.
Plan stop-loss and target levels based on historical price movements.
This indicator is perfect for price action traders, intraday scalpers, and swing traders who rely on past price behavior to make informed decisions.

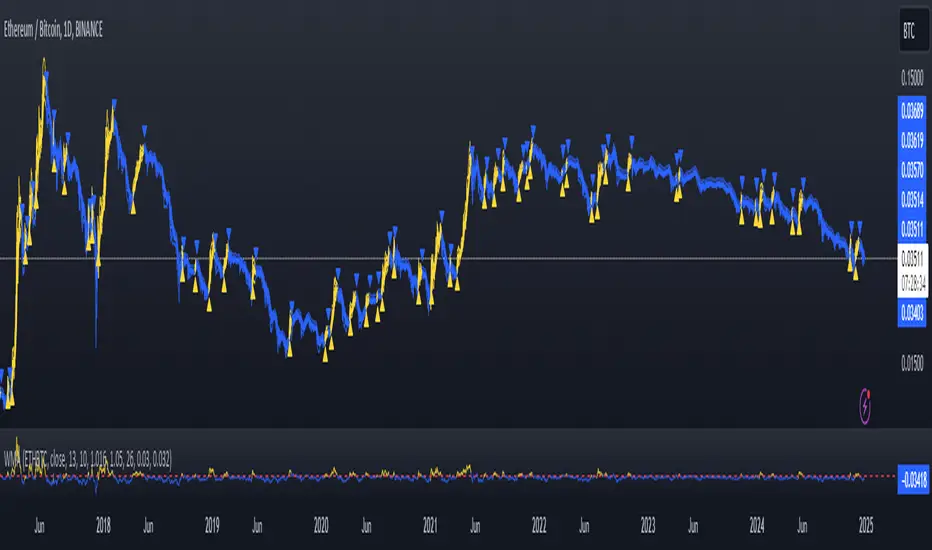
Fast WMAThe Fast WMA is a reactive trend-following tool designed to provide rapid signals on the ETHBTC ratio. It uses advanced smoothing techniques and normalized thresholds to detect trends effectively. Let’s break it down further:
Source Smoothing with Standard Deviations
The source price data is smoothed by calculating its standard deviation, which measures how far prices typically move from the average. This creates upper and lower deviation levels:
The upper deviation represents a high boundary where prices might be overextended.
The lower deviation represents a low boundary where prices might be oversold.
These deviations are combined with the Weighted Moving Average (WMA) to filter out noise and focus on significant price movements.
Weighting the WMA for Further Smoothing
The Weighted Moving Average (WMA) itself is refined by applying adjustable weights:
An upper weight expands the WMA, forming an Upper Band.
A lower weight compresses the WMA, forming a Lower Band.
This dual-weighted approach allows the tool to adapt dynamically to price action, highlighting areas of potential trend reversals or continuations.
Normalized WMA (NWMA) with Adjustable Thresholds
The Normalized WMA (NWMA) adds an extra layer of analysis:
It compares the source price to its smoothed average, expressing the result as a percentage change.
This helps identify whether the market is overbought (positive NWMA) or oversold (negative NWMA).
Two adjustable thresholds—a long threshold (for buy signals) and a short threshold (for sell signals)—allow users to fine-tune the sensitivity of these signals based on their trading style or the market's volatility.
Entry/Exit Conditions
The Fast WMA generates signals based on two conditions:
Buy (Long) Signal:
Occurs when the price stays above the lower deviation level, and the NWMA crosses above the long threshold.
Indicates bullish momentum and suggests an upward trend.
Sell (Short) Signal:
Occurs when the price falls below the upper deviation level, and the NWMA drops below the short threshold.
Indicates bearish momentum and suggests a downward trend.
Important Note
This indicator is not designed to work alone. It’s a powerful tool for identifying trends but should be combined with other analyses, such as volume, higher time-frame trends, or fundamental analysis, for better decision-making.
Plotting Features
The Fast WMA includes intuitive visual cues to enhance usability:
Color-Coded Signals:
Colors change dynamically to indicate trend direction.
Options are available to customize the color scheme (e.g., for specific trading pairs like ETHBTC or SOLBTC).
Threshold Lines:
Dashed horizontal lines mark the long and short thresholds, helping users visualize signal levels.
Bands and Fill Areas:
The Upper Band and Lower Band are plotted around the WMA, with shaded regions indicating the deviation zones.
Signal Arrows:
Triangles appear below or above candles to highlight potential buy (upward arrow) or sell (downward arrow) points.
Bar Coloring:
Candlesticks are colored according to trend direction, making it easier to identify trends at a glance.
The Fast WMA combines mathematical precision with user-friendly visualization, offering traders a versatile tool to analyze trends and make informed decisions. However, like any indicator, it’s most effective when used as part of a broader trading strategy.
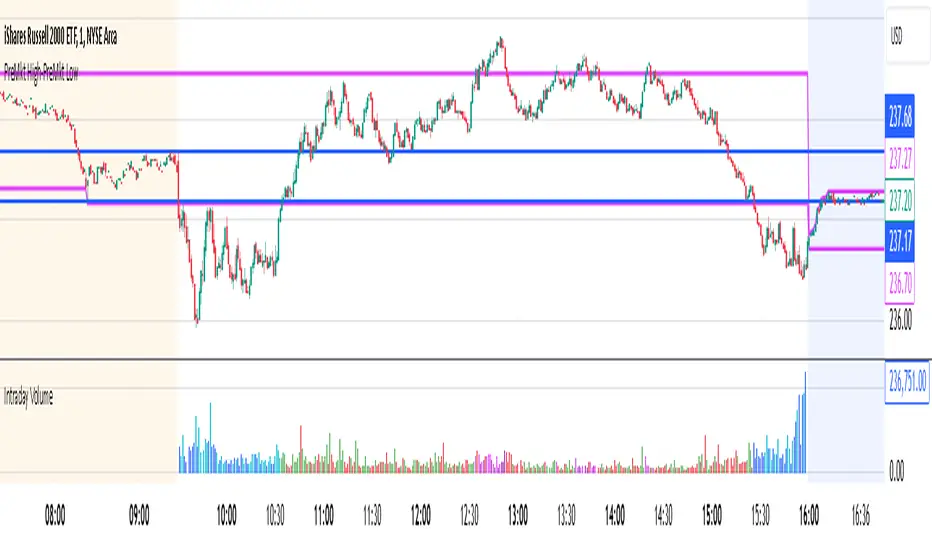
Intraday Volume### Intraday Volume Indicator Explanation
--- this was Mostly created by OpenAI ChatGPT --- it's pretty good!
--- My Commentary: One of the problems I find is with Volume is - it is skewed by the overwhelming volume around the Open and Close. So, as an experiment, I asked ChatGPT to create an indicator to plot the volume everywhere BUT the open.
I added in the CandleColor() function and set the times.
I also changed the Intraday Volume calculation from Cumulative to live.
still Chat GPT - did about 90% of the heavy lift! And, wrote the summary !
----
The "Intraday Volume" indicator is a custom script designed for use on the TradingView platform. It provides a visual representation of the total accumulated trading volume during the intraday trading session, specifically between the market open and close times. Below is a detailed explanation of its functionality:
#### **Key Features:**
1. **Session Times:**
- The indicator defines the intraday session as the period between 9:30 AM EST (market open) and 4:00 PM EST (market close).
- It uses the `timestamp` function to set these times dynamically for each trading day.
2. **Intraday Volume Calculation:**
- During the defined intraday session, the indicator accumulates the trading volume from each bar (candlestick).
- Outside the intraday session, the volume is reset to `na` (not available) to ensure only intraday data is plotted.
3. **Plotting the Volume:**
- The accumulated intraday volume is plotted as a blue column chart in a separate pane below the price chart.
- This provides a clear visualization of how the trading volume evolves throughout the trading session.
4. **Horizontal Reference Line:**
- A horizontal line is added at zero as a visual reference, making it easier to interpret the volume data.
#### **Use Cases:**
- **Volume Analysis:**
- Traders can use the indicator to identify periods of high or low trading activity during the intraday session.
- Peaks in the volume chart may correspond to key market events, such as news releases or significant price movements.
- **Trend Confirmation:**
- Comparing intraday volume with price action can help traders confirm the strength of a trend or the likelihood of a reversal.
- **Custom Time Frames:**
- Although this script is tailored for regular U.S. market hours, it can be adapted for other markets or time zones by modifying the session times.
#### **Customization:**
- **Colors and Styles:**
- The plot color (blue) and style (columns) can be customized to suit user preferences.
- **Session Times:**
- Users can change the session start and end times to match their trading needs or regional market hours.
This indicator is especially useful for intraday traders seeking insights into trading volume dynamics within the trading day. By visualizing the intraday volume, traders can gain a deeper understanding of market behavior and make informed decisions.
Custom RSI & MACD Momentum Entry SignalsIndicator Explanation: Custom RSI & MACD Momentum Entry Signals
Introduction
The "Custom RSI & MACD Momentum Entry Signals" indicator combines the Relative Strength Index (RSI) and the Moving Average Convergence Divergence (MACD) to generate precise long and short entry signals. This indicator offers a powerful combination of overbought/oversold zones, momentum analysis, and RSI-EMA crossovers to assist traders in making better decisions.
How the Indicator Works
1. RSI Calculation and EMA
The RSI is calculated based on the closing price with an adjustable period (default: 14).
An Exponential Moving Average (EMA) of the RSI (default: 9) is plotted to identify RSI trend changes.
When the RSI crosses its EMA upwards, it signals a bullish impulse. Conversely, a downward cross indicates a bearish impulse.
2. MACD Calculation and Momentum Shifts
The MACD line is derived from the difference between a fast EMA (default: 12) and a slow EMA (default: 26).
The Signal line is the EMA of the MACD line (default: 9).
The MACD histogram represents the difference between the MACD line and the Signal line.
Momentum shifts are detected as follows:
Weakening Bearish: Histogram is negative but increasing (less bearish pressure).
Strengthening Bullish: Histogram is positive and rising.
Weakening Bullish: Histogram is positive but decreasing.
Strengthening Bearish: Histogram is negative and falling.
Signal Generation
Long Signals
A Long signal is triggered when all of the following conditions are met:
The RSI was previously below 30 (oversold condition).
MACD momentum shifts from "strengthening bearish" to "weakening bearish" or turns bullish.
The RSI crosses its EMA upwards.
A green upward arrow is displayed below the bar, and the background is lightly shaded green for additional visualization.
Short Signals
A Short signal is triggered when all of the following conditions are met:
The RSI was previously above 70 (overbought condition).
MACD momentum shifts from "strengthening bullish" to "weakening bullish" or turns bearish.
The RSI crosses its EMA downwards.
A red downward arrow is displayed above the bar, and the background is lightly shaded red for additional visualization.
Visual Elements
RSI and EMA:
The RSI is shown in purple.
The RSI EMA is shown in blue.
Horizontal lines at 30 (oversold) and 70 (overbought) provide additional context.
MACD:
The MACD line is displayed in blue.
The Signal line is displayed in orange.
The zero line is added for easier interpretation.
Signals:
Green arrows: Long signals.
Red arrows: Short signals.
Background color: Light green for long conditions, light red for short conditions.
Use Cases
This indicator is ideal for:
Trend Followers: Combining RSI and MACD allows traders to identify entry points during impulsive trend shifts.
Swing Traders: Long and short signals can be used at reversal points to capture short-term price movements.
Momentum Traders: By considering MACD momentum, the indicator provides additional confidence in signal generation.
Customizable Settings
The indicator provides flexible input options:
RSI Period (default: 14)
RSI EMA Period (default: 9)
MACD Parameters: Fast, slow, and signal EMAs can be adjusted.
Conclusion
The Custom RSI & MACD Momentum Entry Signals indicator is a powerful tool for traders looking to combine RSI and MACD to identify high-probability entry signals. With clear visualization and precise signal generation, traders can make decisions more efficiently and capitalize on market movements.

Intraday -RSKWhat You See:
Session Boxes:
As you observe, the larger purple box represents the Asian Session, spanning from around 22:00 to 06:00 UTC. You notice how it captures the overnight market activity.
The smaller, greyish box marks the London Session, from about 08:00 to 12:00 UTC. You can see how the price action changes during this session.
The New York Session is also indicated, with vertical lines possibly marking the open and close, helping you track movements as the U.S. markets come into play.
High and Low Levels:
Horizontal lines are drawn at the high and low of each session. You can use these as potential support or resistance levels, aiding in your decision-making process.
Vertical Lines:
These lines likely correspond to specific key times, such as session opens or closes. You can quickly identify the transition between sessions, which is crucial for your timing.
Color Coding:
Each session is color-coded, making it easier for you to distinguish between them at a glance. The purple, grey, and additional lines offer a clear visual distinction.
How You Use It:
This indicator is your go-to for understanding how different market sessions affect price action. You’ll use it to:
Recognize important price levels within each session.
Identify potential entry and exit points based on session highs and lows.
Observe how the market transitions from one session to another, giving you insight into the best times to trade.
Customization:
You have the flexibility to adjust the settings. You can change session times to suit your trading hours, modify colors to match your chart theme, and even choose which sessions to display or hide based on your focus.
This tool is designed to enhance your analysis, providing you with a structured view of market sessions. With this indicator, you’re well-equipped to navigate the global markets with greater precision and confidence.
Open-source script
Multi-Period CorrelationDescription:
The “Correlation Coefficient - Multi Periods” indicator allows you to analyze the correlation between the price of the chart’s asset and another specified asset across multiple time periods simultaneously. It provides a visual representation of how closely the two assets move in relation to each other over user-defined lengths, helping traders and analysts identify relationships, diversification opportunities, and potential hedging strategies.
Features:
• Multi-Period Correlation: Input multiple periods (e.g., 20, 50, 100) to see correlations across different timeframes on the same chart.
• Customizable Asset: Choose any symbol to compare against the current asset.
• Dynamic Visualization: Each correlation is plotted with a unique color for easy distinction.
• Validation: Warns the user if invalid inputs are provided for the lengths, ensuring accuracy.
• Reference Lines: Horizontal lines at 1, 0, and -1 for quick interpretation:
• 1: Perfect positive correlation.
• 0: No correlation.
• -1: Perfect negative correlation.
Use Cases:
• Portfolio Analysis: Evaluate how an asset correlates with another to assess diversification.
• Market Analysis: Identify trends and relationships between stocks, indices, or other financial instruments.
• Risk Management: Understand correlation to optimize hedging strategies and reduce portfolio risk.
This indicator is ideal for traders and investors seeking to make informed decisions by understanding inter-market relationships and their dynamics over time.

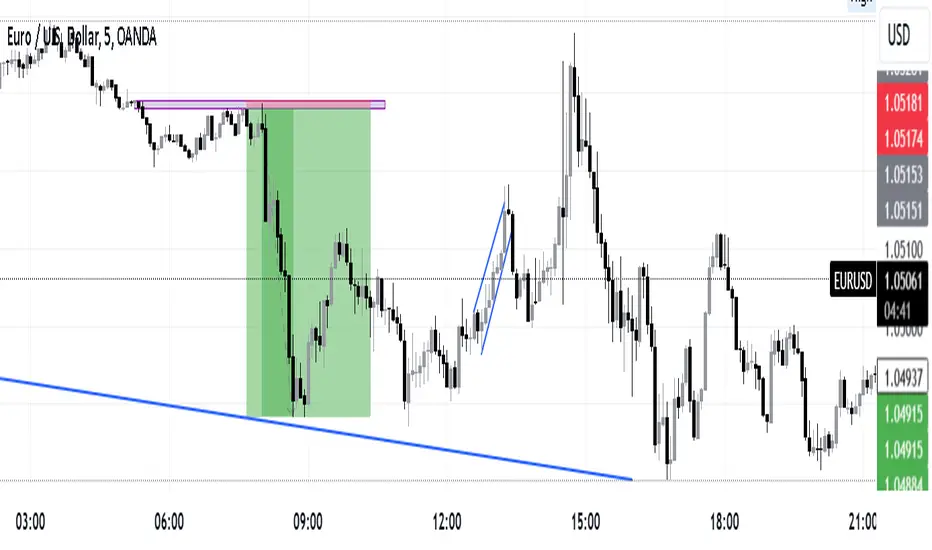
USDJPY vanilla indicatorThis Pine Script indicator, USDJPY Strength Index, helps traders evaluate the strength and momentum of the USD/JPY currency pair. It combines the strength of the US Dollar Index (DXY), the inverse of the Japanese Yen Index (JPYX), and the trend of USD/JPY based on moving averages.
Key Features:
1. Strength Measurement: Calculates a score between 0–100 to indicate USD/JPY momentum.
• Above 70: Strong bullish signal (uptrend likely).
• Below 30: Strong bearish signal (downtrend likely).
2. Trend Analysis: Uses 21 EMA and 50 EMA differences to assess trend direction and strength.
3. Visual Indicators:
• Blue line: USDJPY Strength Index.
• Orange line: 50-period EMA of the index for longer-term trends.
• Background colors: Green (bullish) and red (bearish) highlight strong momentum zones.
This indicator provides clear signals to help traders make informed buy or sell decisions for the USD/JPY pair.
tipp: use horizontal line for mark last low and high. when the blue line comes back again you must be ready for open position if the line bounce back. use engulfing pattern for extra confirmation.

Top-Down Analysis previous day Top-Down Analysis 2nd Candle with Enhanced Features
This powerful TradingView script is designed for traders looking for a comprehensive and customizable top-down analysis tool. The indicator plots horizontal lines based on significant price levels from multiple timeframes (Daily, 4-Hour, 1-Hour, and Weekly), offering clear reference points for technical analysis. Each timeframe is associated with high and low levels from the previous candle, and these levels are represented with customizable line styles, colors, and widths.
Key Features:
Multi-Timeframe Support: Displays high and low levels from the previous candle for the Daily, 4-Hour, 1-Hour, and Weekly timeframes. Customize which timeframes to show.
Customizable Line Appearance: Choose the line color, style (solid, dotted, dashed), and width for each timeframe. This allows for a personalized chart appearance to suit your trading strategy.
Text Labels: Add custom text labels to each line, and move them dynamically to the right, keeping them visible as the candles progress. The labels can be customized with user-defined text for each timeframe’s high and low levels.
Toggle Line Visibility: Easily control the visibility of the horizontal lines and their labels for each timeframe, allowing you to focus on the levels that matter most.
Price Alerts: Set price alerts when the price crosses any of the plotted levels, including the Daily, 4-Hour, 1-Hour, and Weekly levels. Receive notifications when significant price interactions occur.
User Control: With inputs for changing timeframes, colors, labels, and more, this indicator is fully customizable to fit your trading style.
This indicator is ideal for day traders, swing traders, and anyone utilizing multi-timeframe analysis for more informed decision-making.

Non-Psychological Levels🟩 Non-Psychological Levels is a structural analysis tool that segments price action into objective ranges, identifying Broken and Unbroken levels without relying on psychological or time-based assumptions. By emphasizing mechanically derived price behavior, it provides traders with a clear framework for analyzing support and resistance in a consistent and unbiased manner across various market conditions.
This indicator introduces a new approach to understanding market structure by focusing on price movement within defined segments, free from behavioral patterns, round numbers, or specific time intervals. While the indicator is time-agnostic in design, it works within the natural time progression of the chart, ensuring that segmentation aligns with the inherent structure of price movement. Broken levels, where price has breached a structural boundary, and Unbroken levels, which remain intact, are visualized with horizontal lines. These structural zones are complemented by dynamically boxed segments that contextualize both historical and ongoing price behavior.
By offering an objective perspective, the Non-Psychological Levels indicator complements psychology-based tools, helping traders explore market dynamics from multiple angles. When structural levels align with psychological zones, they reinforce critical price areas; when they differ, they provide opportunities to analyze price behavior from an alternative lens. This indicator is designed as both an educational framework and a practical tool, encouraging a deeper understanding of structural price behavior in technical analysis.
⭕ THEORY AND CONCEPT ⭕
The Non-Psychological Levels indicator is grounded in the principle of analyzing price behavior without reliance on psychological assumptions or time-based factors. Its primary purpose is to provide a structural framework for identifying support and resistance levels by focusing solely on price movement within mechanically defined segments. By removing external influences such as sentiment, time intervals, or market sessions, the indicator offers an unbiased lens through which traders can observe price dynamics.
Non-psychology, as defined here, refers to an approach that excludes behavioral and emotional patterns—like fear, greed, or herd mentality—from price analysis. Traditional tools often depend on these patterns to identify zones such as pivots or Fibonacci retracements, but these methods can be inconsistent in volatile markets. In contrast, the Non-Psychological Levels indicator focuses entirely on what price is doing, free from assumptions about trader behavior or external time constraints.
The indicator’s time-agnostic and mechanically driven design segments price action into consistent ranges, highlighting "Broken" levels (where price breaches structural boundaries) and "Unbroken" levels (where price holds). These structural zones remain unaffected by subjective or external influences, ensuring clarity and consistency across different markets and timeframes. By doing so, the indicator reveals a pure view of price structure, independent of psychological biases.
Importantly, the Non-Psychological Levels indicator is not intended to replace psychology-based tools but to complement them. When its structural levels align with psychological zones like round numbers or session highs/lows, the significance of these areas is reinforced. Conversely, when the levels differ, the contrast provides traders with alternative insights into market dynamics. This dual perspective—blending mechanical objectivity with behavioral analysis—enhances the depth and flexibility of market evaluation.
The following principles outline the theoretical foundation of the indicator and its unique contribution to structural price analysis:
Time-Agnostic Design : The indicator avoids reliance on time-based factors like daily opens, session intervals, or specific events. Instead, it segments price action using bar indexes, ensuring that structural levels are identified independently of external time variables. While the x-axis of a chart inherently represents time, this indicator abstracts away its influence, allowing traders to focus purely on price movement without the bias of temporal context.
Mechanical and Neutral Framework : Every calculation within the indicator is predetermined by a set of mechanical rules, ensuring no subjective input or interpretation affects the results. This objectivity guarantees that levels are derived solely from observed price behavior, providing a reliable framework that traders can trust to remain consistent across different assets, timeframes, and market conditions.
Broken and Unbroken Levels : Broken levels represent zones where price has breached a structural boundary, while Unbroken levels highlight areas where price has consistently respected its range. This distinction provides a clear and systematic method for identifying key support and resistance levels, offering insights into where future price interactions are most likely to occur.
Neutral Price Behavior : By dividing price action into equal segments, the indicator removes the influence of external factors like trader sentiment or psychological expectations. Each segment independently determines significant levels based purely on price action, enabling a structural view of the market that abstracts away behavioral or emotional biases.
Complement to Psychological Tools : While the indicator itself avoids behavioral assumptions, its levels can align with psychological zones like round numbers, pivots, or Fibonacci levels. When these structural and psychological levels overlap, it reinforces the importance of key areas, while divergences offer opportunities to examine price behavior from a new perspective.
Educational Value : The indicator encourages traders to explore the contrast between structural and psychological analysis. By introducing a framework that isolates price behavior from external influences, it challenges traditional methods of technical analysis, fostering deeper insights into market structure and behavior.
🔍 UNDERSTANDING STRUCTURAL LEVELS 🔍
The Non-Psychological Levels indicator offers a straightforward yet powerful way to understand market structure by segmenting price action into mechanically defined ranges. This segmentation highlights two key elements: "Broken" levels, where price has breached structural boundaries, and "Unbroken" levels, which remain intact and respected by price action. Together, these components create a framework for identifying potential areas of support and resistance.
Broken Levels : These are structural boundaries that price has surpassed, indicating areas where previous support or resistance failed. Broken levels often signal transitions in price behavior, such as shifts in momentum or the start of trending movements. They provide insight into zones where price has already tested and moved beyond.
Unbroken Levels : These levels remain intact within a given price segment, marking areas where price has consistently respected boundaries. Unbroken levels are particularly useful for identifying potential reversal points or zones of continued support or resistance. Their persistence across price action often makes them reliable indicators of market structure.
The visual segmentation of price action into distinct ranges allows traders to observe how price transitions between structural zones. For example:
- Clusters of Unbroken levels near the current price may suggest strong support or resistance, offering areas of interest for reversals or breakouts.
- Gaps between Unbroken levels highlight areas of price inefficiency or low interaction, which may become significant if revisited.
By focusing solely on structural price behavior, the Non-Psychological Levels indicator enables traders to analyze price independently of time or psychological factors. This makes it a valuable tool for understanding price dynamics objectively, whether used on its own or alongside other indicators.
🛠️ SETTINGS 🛠️
The Non-Psychological Levels indicator offers various customizable settings to help users tailor its visualization to their specific trading style and market conditions. These settings allow adjustments to sensitivity, level projection, and the source of price calculations (e.g., wicks or closing prices). Below, we outline each setting and its impact on the chart, along with examples to illustrate their functionality.
Custom Settings
Sensitivity : This setting adjusts the balance between detailed and broader structural levels by controlling the number of segments. Higher values result in more segments, revealing finer price levels, while lower values consolidate segments to highlight major price movements.
Source : Allows the user to choose between 'Wick' or 'Close' for detecting levels. Selecting 'Wick' emphasizes the absolute highs and lows of price action, while 'Close' focuses on closing prices within each segment.
Level Labels : Configures the visual representation of price levels, allowing users to toggle between price values, symbols (▲ ▼), or disabling labels altogether. This setting ensures clarity in how Broken and Unbroken levels are displayed on the chart.
Unbroken Levels : - - - Users can customize the colors and label styles for Unbroken levels, which highlight areas where price has respected structural boundaries.
Broken Levels : -|- Similar to Unbroken levels, users can specify the visual appearance of Broken levels, including color customization for Broken highs and lows. These settings help distinguish areas where price has breached a structural boundary.
Projection Options : This setting allows users to control how broken and unbroken levels are visually extended on the chart. The Future option projects lines forward to the right of the current price, showing potential future relevance of levels. The All option extends lines both forward and backward, providing a comprehensive view of how levels align with historical and potential future price action. The None option disables projections, keeping the chart focused solely on current segment levels without any extensions.
Segments : Includes options for customizing the segment visualization:
- Live Segment : Toggles the display of a highlighted box representing the current developing segment, helping users focus on ongoing price action.
- Boxes : Allows users to display filled boxes around each segment for additional visual emphasis.
- Segment Colors : Users can define separate colors for support (lower) and resistance (upper) segments, making it easier to interpret directional trends.
- Boundaries : Enables or disables vertical lines to mark segment boundaries, providing a clearer view of structural divisions.
Repaint : This setting allows users to enable or disable triangle labels within the live segment. When enabled, the triangles dynamically update to reflect real-time price behavior during the live bar but will repaint until the bar is fully confirmed. Disabling this option prevents the triangles from appearing during the live bar, reducing potential confusion as they may otherwise flash on and off during price updates. This setting ensures users can choose their preferred visualization while maintaining clarity in real-time analysis.
Color Settings : Offers extensive customization for all visual elements, including Broken and Unbroken levels, segment boundaries, and live segments. These settings ensure the indicator can adapt to individual preferences for chart readability.
🖼️ CHART EXAMPLES 🖼️
The following chart examples illustrate different configurations and features of the Non-Psychological Levels indicator. These examples highlight how the indicator’s settings influence the visualization of structural price behavior, helping traders understand its functionality in various scenarios.
Broken and Unbroken Levels : Orange prices are Broken HIghs. Blue prices are Broken Lows. Green and Red are Unbroken.
Boundaries : Enable Boundaries to visualize segments.
High Sensitivity Setting : A high sensitivity setting produces fewer segments and levels, emphasizing broader price ranges and major structural zones. This configuration is better suited for higher timeframes or identifying overarching trends.
Low Sensitivity Setting : A low sensitivity setting results in a greater number of segments and levels, offering a granular view of price structure. This configuration is ideal for analyzing detailed price movements on lower timeframes.
Live Segment with Triangles Enabled : This example shows the live segment box with triangle labels enabled. These triangles update dynamically during the live bar but may repaint until the bar is confirmed, helping traders observe real-time price behavior.
Broken and Unbroken Levels : This example highlights Broken levels (where price has breached structural boundaries and are drawn through subsequent price action) and Unbroken levels (where price has respected structural boundaries). These distinctions visually identify areas of potential support and resistance.
Broken and Unbroken Levels with Projection: All : This example demonstrates the "Project All" feature, where broken and unbroken levels are extended both forward and backward on the chart. This visualization highlights historical and potential future support and resistance zones, helping traders better understand how price interacts with these structural levels over time.
Segment Boxes with Boundaries : Filled boxes around individual segments visually distinguish each price interval, offering clarity in observing structural price transitions.
📊 SUMMARY 📊
The Non-Psychological Levels indicator provides a unique framework for analyzing structural price behavior through the identification of Broken and Unbroken levels. These levels act as a mechanical representation of support and resistance, independent of psychological biases or time-based factors. By focusing purely on price movement within defined segments, the indicator offers a neutral and consistent approach to understanding market dynamics.
This method complements traditional tools by providing an unbiased perspective. When structural levels align with psychological zones—such as round numbers or session-based highs and lows—they reinforce the significance of these areas as key price zones. When they diverge, the indicator introduces an alternative view, prompting further exploration of price behavior. This dual perspective enhances the depth of analysis by combining the mechanical and behavioral aspects of price action.
The Non-Psychological Levels indicator is not designed to generate trading signals or predict future price movements but serves as a visual and educational tool. Its adaptability across all markets and timeframes allows traders to integrate it into their broader strategies. By highlighting structural price dynamics, the indicator offers a fresh perspective on market analysis while remaining compatible with other technical tools.
⚙️ COMPATIBILITY AND LIMITATIONS ⚙️
Asset Compatibility :
The Non-Psychological Levels indicator is compatible with all asset classes, including cryptocurrencies, forex, stocks, and commodities. It can be applied to any chart or timeframe, making it a flexible tool for structural price analysis. Users should adjust the Sensitivity setting to ensure the segmentation aligns with the price behavior of the specific asset being analyzed. For instance, higher sensitivity values are more suitable for assets with large price ranges, while lower values work well for assets with tighter ranges.
Visual Range Dependency :
The indicator is optimized to perform calculations only within the visible range of the chart. This is a significant advantage, as it prevents unnecessary calculations and maintains efficient performance. However, because of this dependency, levels may appear to "recalculate" when the chart is zoomed in or out quickly or shifted abruptly. While this does not affect the integrity of the levels, it may cause a temporary lag as the indicator adjusts to the new visual range.
Persistence of Levels Beyond Visibility :
Even if levels are not visible on the chart due to zoom or scroll settings, they still exist in the background and are recalculated when revisited. This ensures that the structural price analysis remains consistent, regardless of the chart view.
Box Limitations in Pine Script :
The indicator is subject to Pine Script's inherent limitation of 500 boxes. This means that no more than 500 segments or level boxes can be drawn on the chart simultaneously. For most configurations, this limitation is mitigated by focusing on the visual range, but users employing very low sensitivity settings may exceed the limit. In such cases, only the most recent 500 boxes will be displayed, potentially omitting earlier segments.
Lag with Low Sensitivity Settings :
When sensitivity is set to a low value, the indicator creates many more segments, resulting in finer granularity and a higher number of boxes. While this provides detailed structural levels, it may increase the likelihood of exceeding Pine Script’s 500-box limit or cause a temporary lag when rendering a dense set of boxes over a wide visual range. Users should adjust sensitivity to balance detail with performance, especially on assets with high volatility or broad price ranges.
Live Segment Caution :
The live segment box updates in real time to reflect price movements as the segment is still developing. Since the segment high and segment low are not yet finalized, users should interpret this feature as a dynamic visualization of current price behavior rather than a definitive structural analysis. This ensures clarity during ongoing price action while maintaining the integrity of the indicator's framework.
Cross-Market Versatility :
The indicator’s time-agnostic and mechanical design ensures that it functions identically across all markets and timeframes. However, users should consider the unique characteristics of different markets when interpreting the results, as certain assets (e.g., highly volatile cryptocurrencies) may require sensitivity adjustments for optimal segmentation.
Visual Range Dependency: Levels recalculate efficiently within the chart's visible range but may lag temporarily when zooming or scrolling quickly.
These considerations ensure that the Non-Psychological Levels indicator remains robust and versatile while highlighting some inherent limitations of Pine Script and real-time recalculations. Users can mitigate these constraints by carefully adjusting sensitivity and understanding how the visual range dependency affects performance.
⚠️ DISCLAIMER ⚠️
The Non-Psychological Levels indicator is a visual analysis tool and is not designed as a predictive or trading signal indicator. Its primary purpose is to highlight structural price levels, providing an objective framework for understanding support and resistance within mechanically segmented price action.
The indicator operates within the visible range of the chart to ensure efficiency and adaptiveness, but this recalculation should not be interpreted as a forecast of future price behavior. While the structural levels may align with significant price zones in hindsight, they are purely a reflection of observed price dynamics and should not be used as standalone trading signals.
This indicator is intended as an educational and visual aid to complement other analysis methods. Users are encouraged to integrate it into a broader trading strategy and make adjustments to the settings based on their individual needs and market conditions.
🧠 BEYOND THE CODE 🧠
The Non-Psychological Levels indicator, like other xxattaxx indicators , is designed with education and community collaboration in mind. Its open-source nature encourages exploration, experimentation, and the development of new approaches to price analysis. By focusing on structural price behavior rather than psychological or time-based factors, this indicator introduces a fresh perspective for users to study.
Beyond its visual utility, the indicator serves as an educational framework for understanding the concept of non-psychological analysis. It offers traders an opportunity to explore price dynamics in a purely mechanical way, challenging conventional methods and fostering deeper insights into structural behavior. This approach is especially valuable for those interested in exploring new concepts or seeking alternative perspectives on market analysis.
Your comments, suggestions, and discussions are invaluable in shaping the future of this project. We actively encourage your feedback and contributions, which will directly help us refine and improve the Non-Psychological Levels indicator. We look forward to seeing the creative ways in which you use and enhance this tool. MVS

XRP Comparative Price Action Indicator - Final VersionXRP Comparative Price Action Indicator - Final Version
The XRP Comparative Price Action Indicator provides a comprehensive visual analysis of XRP’s price movements relative to key cryptocurrencies and market indices. This indicator normalises price data across various assets, allowing traders and investors to assess XRP’s performance against its peers and major market influences at a glance.
Key Features:
• Normalised Price Data: Prices are scaled between 0.00 and 1.00,
enabling straightforward comparisons between different assets.
• Key Comparisons: Includes normalised prices for:
• XRP/USD (Bitstamp)
• XRP Dominance (CryptoCap)
• XRP/BTC (Bitstamp)
• BTC/USD (Bitstamp)
• BTC Dominance (CryptoCap)
• USDT Dominance (CryptoCap)
• S&P 500 (SPY)
• DXY (Dollar Index)
• ETH/USD (Bitstamp)
• ETH Dominance (CryptoCap)
• XRP/ETH (Binance)
• Visual Clarity: Each asset is plotted with distinct colors for easy identification,
with thicker lines enhancing visibility on the chart.
• Reference Lines: Optional horizontal lines indicate the minimum (0) and maximum (1) normalised values, providing clear reference points for analysis.
This indicator is ideal for traders looking to understand XRP’s relative performance, gauge market sentiment, and make informed trading decisions based on comparative price action.

First 1-Minute Candle High/Low After Specific TimeDescription:
This indicator captures and marks the high and low of the first 1-minute candle after a specified time (default: 9:30 AM) and tracks the highs and lows of the first five candles. The levels marked by these initial candles are often critical in determining early session support and resistance, providing a visual guide for traders monitoring price action in the opening minutes of a trading session.
Key Features and Usage
1-Minute Candle High/Low: The indicator captures the high and low of the first 1-minute candle after the specified session start time. This level is marked with horizontal lines and labels, providing traders with an immediate reference for early-session price extremes.
5-Candle Range High/Low: After the first five candles, the indicator also highlights the highest and lowest levels within this range, offering additional support/resistance lines to aid in understanding early price movements.
Custom Labels and Dynamic Line Extension:
Labels update dynamically and display whether the 1-minute high/low coincides with the 5-minute range high/low, combining these labels if they match.
Horizontal lines extend to the current bar to remain visible throughout the session for consistent reference.
Customization Options
Colors and Label Text: Users can adjust colors for the 1-minute and 5-minute high/low lines and the label text for optimal readability.
Label Position Offset: Labels are placed slightly above or below their respective lines to avoid overlap with price action, maintaining clarity on the chart.
Intended Use
This indicator is especially useful for intraday traders focusing on opening range breakout strategies, scalping, or short-term trend analysis. It is intended for use on intraday charts (such as 1-minute or 5-minute intervals) and provides straightforward levels to assess early market structure.
Technical Details
Customization of Start Time: Users can change the default start time to any desired session opening time, adapting it to various markets or trading sessions.
Dynamic Line and Label Updates: Both lines and labels dynamically extend with the chart, while labels remain easy to read as they shift based on recent price action.
This script is designed to be simple yet powerful, offering key insights into session open levels without relying on predictive or lookahead features. It is useful for real-time analysis and adds value by helping traders identify critical levels in the market's early stages.
Volumatic Variable Index Dynamic Average [BigBeluga]The Volumatic VIDYA (Variable Index Dynamic Average) indicator is a trend-following tool that calculates and visualizes both the current trend and the corresponding buy and sell pressure within each trend phase. Using the Variable Index Dynamic Average as the core smoothing technique, this indicator also plots volume levels of lows and highs based on market structure pivot points, providing traders with key insights into price and volume dynamics.
Additionally, it generates delta volume values to help traders evaluate buy-sell pressure balance during each trend, making it a powerful tool for understanding market sentiment shifts.
BTC:
TSLA:
🔵 IDEA
The Volumatic VIDYA indicator's core idea is to provide a dynamic, adaptive smoothing tool that identifies trends while simultaneously calculating the volume pressure behind them. The VIDYA line, based on the Variable Index Dynamic Average, adjusts according to the strength of the price movements, offering a more adaptive response to the market compared to standard moving averages.
By calculating and displaying the buy and sell volume pressure throughout each trend, the indicator provides traders with key insights into market participation. The horizontal lines drawn from the highs and lows of market structure pivots give additional clarity on support and resistance levels, backed by average volume at these points. This dual analysis of trend and volume allows traders to evaluate the strength and potential of market movements more effectively.
🔵 KEY FEATURES & USAGE
VIDYA Calculation:
The Variable Index Dynamic Average (VIDYA) is a special type of moving average that adjusts dynamically to the market’s volatility and momentum. Unlike traditional moving averages that use fixed periods, VIDYA adjusts its smoothing factor based on the relative strength of the price movements, using the Chande Momentum Oscillator (CMO) to capture the magnitude of price changes. When momentum is strong, VIDYA adapts and smooths out price movements quicker, making it more responsive to rapid price changes. This makes VIDYA more adaptable to volatile markets compared to traditional moving averages such as the Simple Moving Average (SMA) or the Exponential Moving Average (EMA), which are less flexible.
// VIDYA (Variable Index Dynamic Average) function
vidya_calc(src, vidya_length, vidya_momentum) =>
float momentum = ta.change(src)
float sum_pos_momentum = math.sum((momentum >= 0) ? momentum : 0.0, vidya_momentum)
float sum_neg_momentum = math.sum((momentum >= 0) ? 0.0 : -momentum, vidya_momentum)
float abs_cmo = math.abs(100 * (sum_pos_momentum - sum_neg_momentum) / (sum_pos_momentum + sum_neg_momentum))
float alpha = 2 / (vidya_length + 1)
var float vidya_value = 0.0
vidya_value := alpha * abs_cmo / 100 * src + (1 - alpha * abs_cmo / 100) * nz(vidya_value )
ta.sma(vidya_value, 15)
When momentum is strong, VIDYA adapts and smooths out price movements quicker, making it more responsive to rapid price changes. This makes VIDYA more adaptable to volatile markets compared to traditional moving averages
Triangle Trend Shift Signals:
The indicator marks trend shifts with up and down triangles, signaling a potential change in direction. These signals appear when the price crosses above a VIDYA during an uptrend or crosses below during a downtrend.
Volume Pressure Calculation:
The Volumatic VIDYA tracks the buy and sell pressure during each trend, calculating the cumulative volume for up and down bars. Positive delta volume occurs during uptrends due to higher buy pressure, while negative delta volume reflects higher sell pressure during downtrends. The delta is displayed in real-time on the chart, offering a quick view of volume imbalances.
Market Structure Pivot Lines with Volume Labels:
The indicator draws horizontal lines based on market structure pivots, which are calculated using the highs and lows of price action. These lines are extended on the chart until price crosses them. The indicator also plots the average volume over a 6-bar range to provide a clearer understanding of volume dynamics at critical points.
🔵 CUSTOMIZATION
VIDYA Length & Momentum: Control the sensitivity of the VIDYA line by adjusting the length and momentum settings, allowing traders to customize the smoothing effect to match their trading style.
Volume Pivot Detection: Set the number of bars to consider for identifying pivots, which influences the calculation of the average volume at key levels.
Band Distance: Adjust the band distance multiplier for controlling how far the upper and lower bands extend from the VIDYA line, based on the ATR (Average True Range).

ADX Trend Strength Analyzer█ OVERVIEW
This script implements the Average Directional Index (ADX), a powerful tool used to measure the strength of market trends. It works alongside the Directional Movement Index (DMI), which breaks down the directional market pressure into bullish (+DI) and bearish (-DI) components. The purpose of the ADX is to indicate when the market is in a strong trend, without specifying the direction. This indicator can be especially useful for identifying market trends early and validating trading strategies based on trend-following systems.
The ADX component in this script is based on two key parameters:
ADX Smoothing Length (adxlen), which determines the degree of smoothing for the trend strength.
DI Length (dilen), which defines the look-back period for calculating the directional index values.
Additionally, a horizontal line is plotted at the 30 level, providing a widely used threshold that signifies when a trend is considered strong (above 30).
█ CONCEPTS
Directional Movement (DM): The core idea behind this indicator is the calculation of price movement in terms of bullish and bearish forces. By evaluating the change in highs and lows, the script distinguishes between bullish movement (+DM) and bearish movement (-DM). These values are normalized by dividing them by the True Range (TR), creating the +DI and -DI values.
True Range (TR): The True Range is calculated using the Average True Range (ATR) formula, and it serves to smooth out volatility, ensuring that short-term fluctuations don't distort the long-term trend signal.
ADX Calculation: The ADX is derived from the absolute difference between the +DI and -DI. By smoothing this difference and normalizing it, the ADX is able to measure the overall strength of the trend without regard to whether the market is moving up or down. A rising ADX indicates increasing trend strength, while a falling ADX signals weakening trends.
█ METHODOLOGY
Directional Movement Calculation: The script first determines the upward and downward price movement by comparing changes in the high and low prices. If the upward movement is greater than the downward movement, it registers a bullish signal and vice versa for bearish movement.
True Range Adjustment: The script then applies a smoothing function to normalize these movements by dividing them by the True Range (ATR). This ensures that the trend signal is based on relative, rather than absolute, price movements.
ADX Signal Generation: The final step is to calculate the ADX by applying the Relative Moving Average (RMA) to the difference between +DI and -DI. This produces the ADX value, which is plotted in red, making it easy to visualize shifts in market momentum.
Threshold Line: A blue horizontal line is plotted at 30, which serves as a key reference point. When the ADX is above this line, it indicates a strong trend, whether bullish or bearish.
█ HOW TO USE
Trend Strength: Traders typically use the 30 level as a critical threshold. When the ADX is above 30, it signifies a strong trend, making it a favorable environment for trend-following strategies. Conversely, ADX values below 30 suggest a weak or non-trending market.
+DI and -DI Relationship: The indicator also provides insight into whether the trend is bullish or bearish. When +DI is greater than -DI, the market is considered bullish. When -DI is greater than +DI, the market is considered bearish. While this script focuses on the ADX value itself, the underlying +DI and -DI help interpret the trend direction.
Market Conditions: This indicator is effective in trending markets, but not ideal for choppy or sideways conditions. Traders can use it to determine the best entry and exit points when trends are strong, or to avoid trading in periods of low volatility.
Combining with Other Indicators: The ADX is commonly used in conjunction with oscillators like RSI or moving averages, to confirm the trend strength and avoid false signals.
█ METHOD VARIANTS
This script applies the standard approach for calculating the ADX, but could be adapted with the following variants:
Different Timeframes: The script could be modified to calculate ADX values across higher or lower timeframes, depending on the trader's strategy.
Custom Thresholds: Instead of using the default 30 threshold, traders could adjust the horizontal line to suit their own risk tolerance or market conditions.

Power MarketPower Market Indicator
Description: The Power Market Indicator is designed to help traders assess market strength and make informed decisions for entering and exiting positions. This innovative indicator provides a comprehensive view of the evolution of Simple Moving Averages (SMA) over different periods and offers a clear measure of market strength through a total score.
Key Features:
Multi-Period SMA Analysis:
Calculates Simple Moving Averages (SMA) for 10 different periods ranging from 10 to 100.
Provides detailed analysis by comparing the current closing price with these SMAs.
Market Strength Measurement:
Assesses market strength by calculating a total score based on the relationship between the closing price and the SMAs.
The total score is displayed as a histogram with distinct colors for positive and negative values.
Smoothed Curve for Better View:
A smoothing of the total score is applied using a 5-period Simple Moving Average to represent the overall trend more smoothly.
Dynamic Information Table:
Real-time display of the maximum and minimum values among the SMAs, as well as the difference between these values, providing valuable insights into the variability of moving averages.
Visual Reference Lines:
Horizontal lines at zero, +50, and -50 for easy evaluation of key score levels.
How to Use the Indicator:
Position Entries: Use high positive scores to identify buying opportunities when market strength is strong.
Position Exits: Negative scores may signal market weakness, allowing you to exit positions or wait for a better opportunity.
Data Analysis: The table helps you understand the variability of SMAs, offering additional context for your trading decisions.
This powerful tool provides an in-depth view of market dynamics and helps you navigate your trading strategies with greater confidence. Embrace the Power Market Indicator and optimize your trading decisions today!
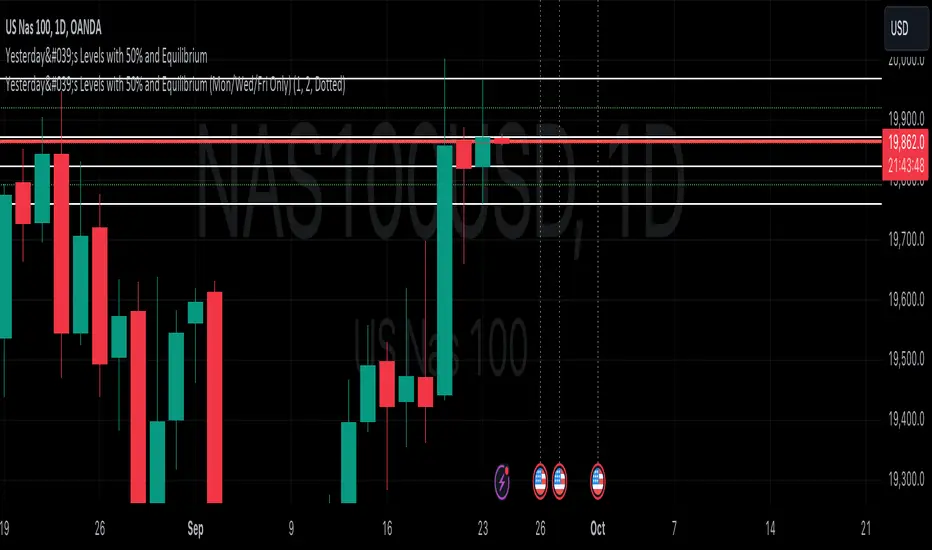
Yesterday's Levels with 50% wick and Equilibrium## Script Description
This Pine Script indicator highlights key levels from the previous day’s daily candle on any timeframe chart. It focuses exclusively on marking the following:
1. **Previous Day’s High, Low, Open, and Close**:
- Horizontal lines are drawn to indicate the previous day's high, low, open, and close prices.
- These lines are white and extend across the chart.
2. **50% of Candle Wicks**:
- If the previous day’s candle has wicks, two additional lines mark 50% of the top wick and 50% of the bottom wick.
- These lines are green and dotted, representing half the wick’s height.
3. **Equilibrium (50% of the Full Candle)**:
- A horizontal red line marks the midpoint (equilibrium) of the entire previous day’s candle, from high to low.
- This line is thicker than the others to emphasize the equilibrium level.
The script works by focusing only on the previous day’s daily candle, ensuring that it doesn’t plot lines for any older candles. These levels are visible on all timeframes.
Price Action Volumetric Order Blocks [UAlgo]"Price Action Volumetric Order Blocks" indicator aims to identify significant price zones in the market based on a combination of price action and volume analysis. It utilizes the concept of "Order Blocks," which are areas on the chart where large orders are believed to have been placed, influencing price behavior. By analyzing price swings and volume activity, the indicator attempts to highlight potential support and resistance levels.
🔶 Key Features
Swing Length: This input allows you to adjust the timeframe used to identify price swings for order block detection. A longer swing length will focus on larger timeframes and potentially capture stronger order blocks.
Show Last X Order Blocks: This controls the number of order blocks displayed on the chart. You can choose to visualize a specific number of the most recent order blocks.
Violation Check: This setting determines how the indicator identifies potential order block violations. You can choose between "Wick" or "Close" violations. A "Wick" violation occurs when the price (wick) extends beyond the order block boundaries, while a "Close" violation signifies that the closing price breaches the order block.
Hide Overlap: This option allows you to manage the display of overlapping order blocks. If set to "True," only non-overlapping order blocks will be shown, potentially offering a clearer visualization.
Colors: You can customize the color scheme for bullish (upward) and bearish (downward) order blocks to enhance visual clarity on the chart.
🔶 Interpreting the Indicator
Order Blocks: The teal-colored boxes represent bullish order blocks, indicating areas of demand where buying pressure is likely to be strong. Red-colored boxes represent bearish order blocks, indicating areas of supply where selling pressure is likely to be dominant. These zones often signal potential reversal points or consolidation areas.
Strength Calculations: The indicator calculates the relative strength of bullish and bearish blocks based on volume. A higher bullish strength indicates stronger buying pressure, while higher bearish strength suggests more selling pressure. Traders can use this information to gauge the strength of a price level and predict future price movements.
Market Structure Lines: The indicator displays horizontal lines to depict the current market structure, labeled as "MSB" (Market Sell Balance) or "BOS" (Break of Structure). These lines can help visualize the prevailing trend direction.
Order Block Violations: When a price wick or close breaches an order block (depending on the chosen violation type), the corresponding order block visualization is removed from the chart. This can signify a potential weakening of the identified support or resistance zone.
🔶 Disclaimer
Use with Caution: This indicator is provided for educational and informational purposes only and should not be considered as financial advice. Users should exercise caution and perform their own analysis before making trading decisions based on the indicator's signals.
Not Financial Advice: The information provided by this indicator does not constitute financial advice, and the creator (UAlgo) shall not be held responsible for any trading losses incurred as a result of using this indicator.
Backtesting Recommended: Traders are encouraged to backtest the indicator thoroughly on historical data before using it in live trading to assess its performance and suitability for their trading strategies.
Risk Management: Trading involves inherent risks, and users should implement proper risk management strategies, including but not limited to stop-loss orders and position sizing, to mitigate potential losses.
No Guarantees: The accuracy and reliability of the indicator's signals cannot be guaranteed, as they are based on historical price data and past performance may not be indicative of future results.

Revenue GridDescription:
The Revenue Grid indicator helps traders and investors visualize a stock’s valuation by plotting horizontal lines based on its price-to-sales (P/S) ratio. This tool displays how the stock price compares to multiples of its total revenue per share, giving a clear perspective on valuation benchmarks.
Fundamental Concept:
The price-to-sales ratio compares a company’s stock price to its revenue per share. It’s used to evaluate whether a stock is overvalued or undervalued based on its revenue.
This indicator offers a unique way to view this ratio by applying Fibonacci multiples to the revenue per share. It plots lines at these multiples to show how the stock price measures up against different valuation levels.
How It Works:
Data Inputs:
Total Revenue (TR): The company’s revenue over the past twelve months.
Total Shares Outstanding (TSO): The total number of shares in circulation.
Calculation:
Calculates the revenue per share (TR/TSO).
Plots lines at fixed Fibonacci multiples (e.g., 1x, 2x, 3x, 5x, 8x, 13x) of the revenue per share value.
How to Use:
1. Add the "Revenue Grid" indicator to your chart by searching for it in the indicator library and applying it.
2. Observe the lines plotted on the chart. If these lines are trending upwards, it indicates that the revenue is increasing.
3. Analyze how historical prices trend relative to these lines. Look for periods where the stock price supports around specific multiples, you can easily get a sense of overvaluation or undervaluation in certain periods.
Use this information to guide further analysis and investment decisions.
Benefits:
1. Clear Valuation View: Easily see how the company’s revenue translates into stock price levels.
2. Investment Insight: Identify if the stock price is lagging behind revenue growth, which might signal a buying opportunity.
3. Historical Context: Understand how the market has historically valued the company and assess the current valuation.
Do let me know your feedbacks in comments. Happy Investing :)

[KVA] KMACDKMACD Indicator: Advanced Market Analysis Through Central Tendency Metrics
The KMACD (KAMVIA Moving Average Convergence Divergence) indicator is an advanced, multi-dimensional tool designed to provide traders and analysts with a deeper understanding of market dynamics. By integrating the classical MACD framework with statistical measures of central tendency, KMACD offers a sophisticated approach to identifying trends, reversals, and potential trading opportunities.
Key Features of the KMACD Indicator:
1. Enhanced MACD Calculation :
- The KMACD employs dual moving averages (fast and slow) of user-defined types (SMA, EMA, WMA) to calculate the MACD line, which represents the difference between these moving averages. This traditional approach is further enhanced by customizable signal smoothing, allowing users to fine-tune the sensitivity of the indicator.
2. Central Tendency Metrics :
- The indicator integrates additional statistical measures, such as Mean, Median, Mode, Standard Deviation, and Variance, calculated over a rolling window. These metrics provide insights into the central tendencies of the MACD values, helping traders understand the overall trend direction and the dispersion of price movements around the trend.
3. RSI-Like Oscillator :
- A unique RSI-like value derived from the MACD line is included to highlight overbought and oversold conditions. This offers a dual-layered perspective, combining the power of MACD and RSI methodologies, to signal potential market extremes with greater precision.
4. Customizable Visual Elements :
- KMACD allows users to toggle the visibility of the MACD line, Signal line, and Histogram, providing flexibility in how the data is presented. The histogram dynamically changes color—green when above zero, indicating bullish momentum, and red when below zero, indicating bearish momentum.
5. Horizontal Line Customization :
- The indicator includes customizable horizontal lines for the zero level, overbought, and oversold thresholds. These lines serve as visual cues to identify key price levels and market conditions.
6. Adaptive to Various Market Conditions :
- KMACD's comprehensive features make it adaptable to various market conditions, from trending markets to sideways consolidations. Whether you're looking to capture momentum shifts or identify potential reversal points, KMACD provides the analytical power needed to make informed trading decisions.
How to Use KMACD:
- Trend Identification : Use the MACD line in conjunction with central tendency measures (Mean, Median, Mode) to gauge the overall market trend and its strength. A rising MACD line, supported by higher mean and median values, typically indicates an uptrend.
- Momentum Analysis : The histogram and RSI-like value help in identifying the momentum behind price movements. Positive histogram bars suggest increasing bullish momentum, while negative bars suggest increasing bearish momentum.
- Overbought/Oversold Conditions : Monitor the RSI-like oscillator and the overbought/oversold levels to detect when the market may be poised for a reversal.
- Divergence Detection : Look for divergences between the MACD line and price action, supported by the central tendency measures, to spot potential reversal points.
Conclusion
The KMACD indicator is more than just a traditional MACD; it’s a comprehensive tool designed to cater to both novice and experienced traders. By incorporating central tendency metrics and customizable features, KMACD stands out as a versatile and powerful indicator that enhances market analysis and trading strategies. Whether you're navigating volatile markets or steady trends, KMACD offers the precision and depth needed to stay ahead.
