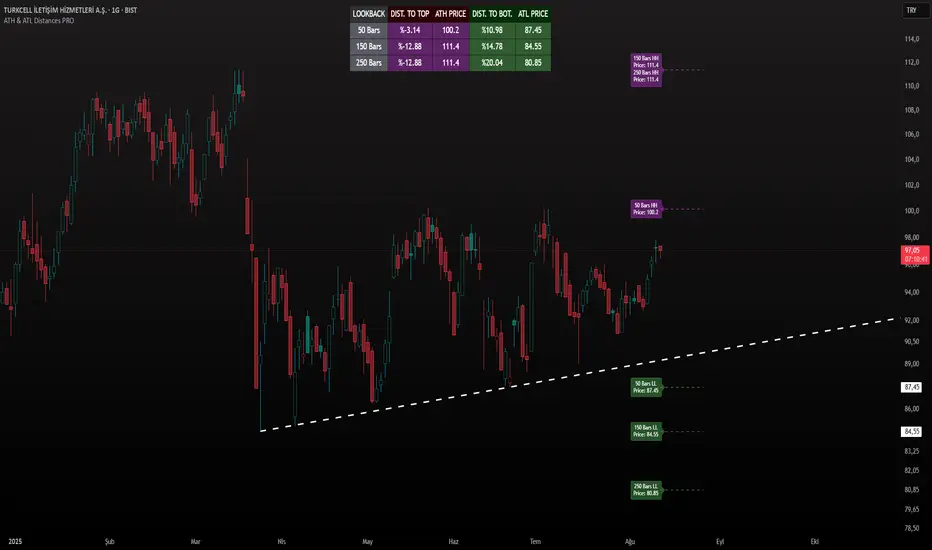
ATH & ATL Distances PROIndicator Description:
ATH & ATL Distances PROThis Pine Script indicator, built on version 6, helps traders visualize and monitor the percentage distances from the current closing price to the rolling All-Time High (ATH) and All-Time Low (ATL) over customizable lookback periods.
It's designed for overlay on your TradingView charts, providing a clear table display and optional horizontal lines with labels for quick reference.
This tool is ideal for assessing market pullbacks, rallies, or potential reversal points based on recent price extremes.
Key Features:
Customizable Lookbacks: Three adjustable periods (default: 50, 150, 250 bars) to calculate short-, medium-, and long-term highs/lows.
Percentage Distances: Shows how far the current price is from ATH (negative percentage if below) and ATL (positive if above).
Visual Aids: Optional dashed lines for ATH/ATL levels extending a set number of bars, with grouped labels to avoid clutter if levels overlap.
Info Table: A persistent table summarizing lookbacks, distances, and prices, with color-coded cells for easy reading (red for ATH/dist to top, green for ATL/dist to bottom).
User Controls: Toggle rows, lines, table position, and colors via inputs for a personalized experience.
How It Works (Logic Explained):
The script uses TradingView's built-in functions like ta.highest() and ta.lowest() to find the highest high and lowest low within each lookback period (capped at available bars to handle early chart data). It then computes:Distance to ATH: ((close - ATH) / ATH) * 100 – Negative values indicate the price is below the high.
Distance to ATL: ((close - ATL) / ATL) * 100 – Positive values show the price is above the low.
Unique ATH/ATL prices across lookbacks are grouped into arrays to prevent duplicate lines/labels; if prices match, labels concatenate details (e.g., "50 Bars HH\n150 Bars HH").
Drawings (lines and labels) are efficiently managed by redrawing only on the latest bar to optimize performance. The table updates in real-time on every bar close.How to Use:Add the indicator to your chart via TradingView's "Indicators" menu (search for "ATH & ATL Distances PRO").
Customize inputs:
Adjust lookback periods (1-1000 bars) for your timeframe (e.g., shorter for intraday, longer for daily/weekly).
Enable/disable lines, rows, or change colors/table position to suit your setup.
Interpret the table:
"DIST. TO TOP" (red): Percentage drop needed to reach ATH – useful for spotting overbought conditions.
"DIST. TO BOT." (green): Percentage rise from ATL – helpful for identifying support levels.
If lines are enabled, hover over labels for details on which lookbacks share the level.
Best on any symbol/timeframe; combine with other indicators like RSI or moving averages for confluence.
This script is open-source and free to use/modify. No external dependencies – it runs natively on TradingView. Feedback welcome; if you find it useful, a like or comment helps!
Cari dalam skrip untuk "horizontal line"
MK_OSFT - Multi-timeframe MA Lines with labelsProvides SMA/EMA levels on a chart for the 5m, 15m, 1H and 4H timeframes. It does not draw the full MA's on the chart but provides 'only' the actual MA values at the current candle as a horizontal line with a label.

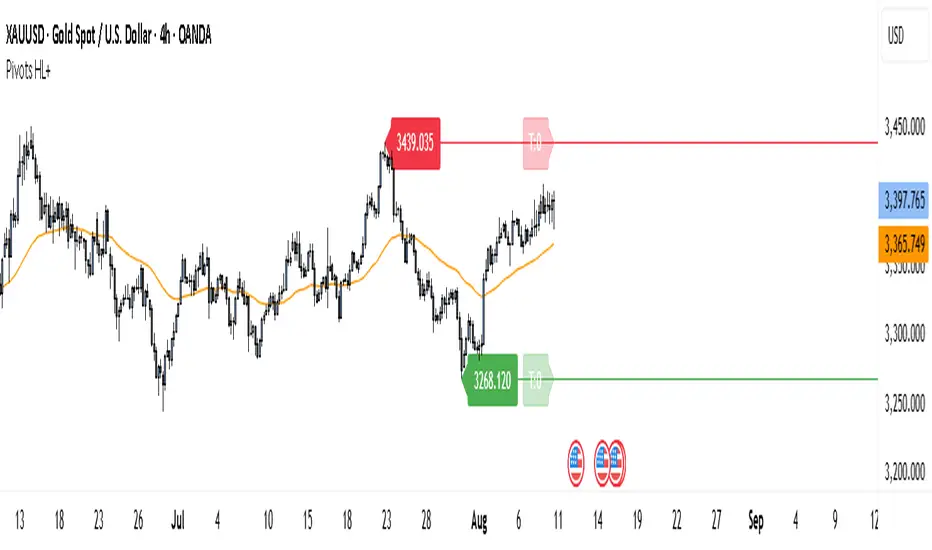
Pivot Points HL DetailedThis indicator marks important turning points in the market, showing you the most recent swing high and swing low as horizontal lines across the chart. Each pivot line has a price label where it formed and a small counter that updates whenever the market touches that level again. The line’s color reflects the prevailing trend, determined by an EMA filter, so you can quickly see if the level is likely acting as support or resistance in the current market environment.
It works by scanning recent bars for points where price made a local high higher than several bars to its left and right, or a local low lower than several bars to its left and right. These pivots are calculated directly from price action using the ta.pivothigh and ta.pivotlow functions. Once identified, the level is tracked in real time, counting every time price crosses it. The EMA provides context: if price is above the EMA, the market is considered in an uptrend and the pivots are colored to match; if price is below, they’re marked as part of a downtrend.
For traders, this offers a clean way to see where the market has turned before and whether those levels are still relevant. Strong levels often show multiple touches, which can be used for entries, exits, or risk management. The built-in alert system can notify you when price approaches either the most recent swing high or swing low, so you can react quickly.
This tool can be applied in almost any market — forex, stocks, indices, commodities, or crypto — because price tends to respect recent swing points regardless of the asset class. It tends to be most effective in liquid markets, where many traders see and react to the same key levels, and it’s valuable in both trending and ranging conditions, though the EMA trend filter adds extra clarity when the market is moving directionally.
VHX EMA 135/315📈 EMA 135/315 Cross Strategy – Your Trend Compass with Smart Confirmations
🔍 Core Idea
The EMA 135/315 Cross strategy is a trend-following system.
It tracks two moving averages:
EMA 135 → the “fast” line that reacts to short-term price moves
EMA 315 → the “slow” line that reacts to the bigger trend
When the fast EMA crosses above the slow EMA → market momentum is turning up → BUY signal 🟢
When the fast EMA crosses below the slow EMA → momentum is turning down → SELL signal 🔴
This gives you a clear entry trigger — no guessing, no overcomplication.
✨ On Your Chart
BUY/SELL Arrows
🟢 Green arrow = bullish cross → trend turning up
🔴 Red arrow = bearish cross → trend turning down
Trend Info Panel (Top Left)
Current Trend: BUY / SELL / Neutral
Last Cross: how many bars ago it happened
EMA Gap in %: measures the strength of the trend
Status: “Approaching” if EMAs are getting close → possible cross soon
Automatic TP/SL Levels
📈 TP line (+2% from entry)
📉 SL line (–0.5% from entry)
Saves time — you instantly see your target and protection
EMA Distance Meter
Big % gap = strong trend momentum 🚀
Small % gap = weak or sideways market ⚠️
Real-Time Alerts
You get notified when a cross happens, even if you’re away from the screen
🧠 The Logic Behind It
The EMA 135 reacts faster → it reflects short-term momentum
The EMA 315 moves slower → it reflects the main trend
When the fast EMA overtakes the slow EMA: short-term strength now aligns with the long-term trend → higher probability of a sustained move
The gap % tells you how strong the alignment is — large gap = cleaner moves, small gap = market in transition
“Approaching” status warns that the EMAs are converging, which often happens before a reversal
📊 Boosting the Strategy with Volume Analysis
The EMA cross is a strong trigger, but volume confirms the quality of the move:
High Volume + Cross → more reliable signal, as strong market participation is pushing the trend
Low Volume + Cross → caution, the move might be weak or a false breakout
💡 Tip:
Check the volume histogram or a volume-based indicator (e.g., Volume Profile, OBV).
On a BUY signal: volume should spike above the recent average.
On a SELL signal: watch for strong selling volume bars.
📍 Adding Support & Resistance for Precision
Support and resistance levels help filter out bad trades and optimize entries:
Best BUY setups:
EMA 135 crosses above EMA 315 near a known support zone
Bonus if volume confirms the move
Avoid buying directly into a strong resistance
Best SELL setups:
EMA 135 crosses below EMA 315 near a known resistance zone
Bonus if selling volume is strong
Avoid selling directly into a major support
💡 Use tools like horizontal lines, previous highs/lows, and Volume Profile nodes to spot these zones.
📈 Best Usage Practices
Timeframes
Lower timeframes (1m–5m) → more signals, but more noise → best for scalping with extra filters
Always Combine With Confirmation
EMA Cross = Trigger
Volume spike = Confirmation
S/R zone in your favor = High-probability setup
Manage Risk
Start with the built-in TP/SL
Adjust SL if volatility is higher than usual
Consider trailing stop once price moves in your favor
Avoid Sideways Markets
If EMA gap % is very small and crosses happen often → stand aside until a clear direction forms
Use Alerts
Set alerts for BUY & SELL crosses so you never miss a setup
In short:
This isn’t just an EMA cross indicator — it’s a trend system with built-in risk management, strength measurement, and pre-trade preparation. Combine it with volume confirmation and smart use of support/resistance, and you turn a simple signal into a high-probability trading edge.

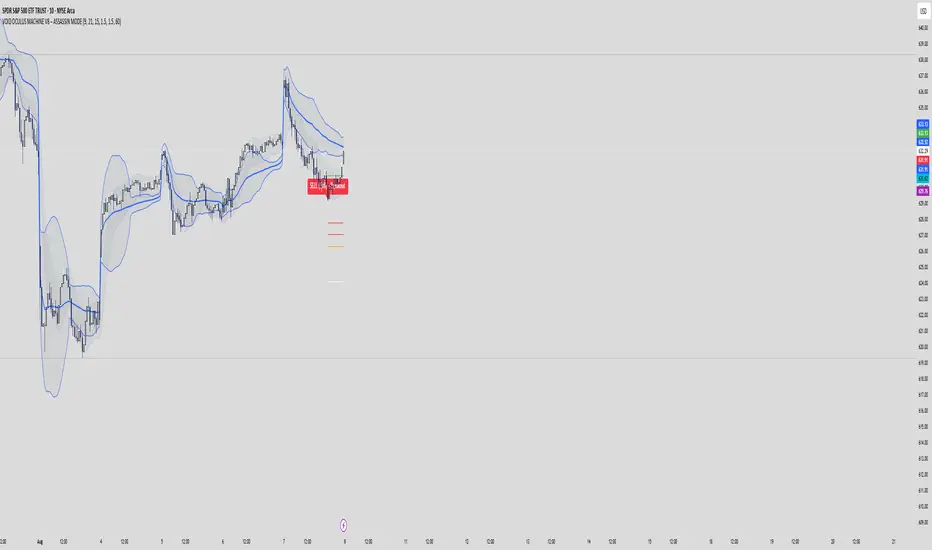
VOID OCULUS MACHINE V8 – ASSASSIN MODEVOID OCULUS MACHINE V8 – ASSASSIN MODE
Version 8.0 | Pine Script v6
Purpose & Originality
VOID OCULUS MACHINE V8 – ASSASSIN MODE brings together four advanced trading filters—EMA crossovers, TRIX momentum, VWAP band positioning, and a proprietary “Predictive Cloud”—into a single, high-precision entry system. Rather than relying on any one signal, it calculates a confidence score combining trend, momentum, volume, and volatility cues, then triggers only the highest-probability setups once a user-defined threshold is met. This multi-layer architecture offers traders laser-focused entries (“Assassin Mode”) with built-in risk (stop) and reward (targets) visualization.
How It Works & Component Rationale
EMA Trend Alignment
Fast EMA (9) vs. Slow EMA (21): Captures short-term versus medium-term trend. A bullish bias requires EMA9 > EMA21, bearish bias EMA9 < EMA21.
TRIX Momentum Filter
A triple-smoothed EMA oscillator over 15 bars, expressed as a percentage change. Positive TRIX confirms upward momentum; negative TRIX confirms downward momentum.
Gaussian Noise Reduction
Dual 5-period EMA smoothing of price removes short-term noise, creating a “cloud base.” Entries only fire when price interacts favorably with this smoothed baseline.
VWAP Band Confirmation (Optional)
Calculates session VWAP ± one standard deviation over 20 bars, plotting upper/lower bands. Traders can require price to sit above/below VWAP mid for trend confirmation.
Predictive Cloud Overlay
A dynamic band (Gaussian ± ATR) forecasts a near-term “value zone.” Pullback and reversal entries can occur as price re-enters or breaks out of this cloud.
Confidence Scoring
Starts at 0 and adds:
+30 for EMA trend alignment (bull or bear)
+20 for volume spike (>20-bar SMA)
+20 for non-zero TRIX slope
+20 for ATR expansion (volatility ramping)
+10 if price is above or below VWAP mid (if VWAP filter is enabled)
Only fires signals when confidence ≥ 60% (configurable), ensuring multi-factor confluence.
Entry Type Differentiation
Breakout: Price pierces prior 10-bar high/low on volume and ATR expansion.
Pullback: Trend bias plus a crossover of price with EMA9.
Reversal: Price crosses back into the Predictive Cloud from outside, confirmed by VWAP cross.
Automated Trade Visualization
On each signal, clears previous objects, plots a “BUY (xx%) – ” or “SELL (xx%) – ” label, four tiered ATR-based targets (1×, 1.5×, 2×, 3.5×), and a stop-loss (ATR × 1.5).
Inputs & Customization
Input Description Default
Fast EMA Length for short-term trend EMA 9
Slow EMA Length for medium-term trend EMA 21
TRIX Length Period for triple-smoothed momentum oscillator 15
Stop Multiplier ATR multiple for stop-loss distance 1.5
Target Multiplier ATR multiple for first profit target 1.5
Enable VWAP Filter Require price alignment above/below VWAP mid On
Minimum Confidence Confidence % threshold to trigger a signal 60
Show Predictive Cloud Toggle the Gaussian ± ATR cloud on/off On
How to Use
Apply to Chart: Suitable on 5 m–1 h timeframes for swing entries.
Adjust Confidence & Filters: Raise the Minimum Confidence to tighten setups; disable VWAP filter for pure price/momentum plays.
Read Signals:
“BUY (75%) – Breakout” label means 75% confluence across filters, triggered by a breakout entry type.
Four colored horizontal lines mark TP1–TP4; a red line marks your stop.
Manage the Trade:
Use the plotted stop-loss line; scale out at targets or trail behind the Predictive Cloud.
Unique Value
VOID OCULUS MACHINE V8 stands out by quantifying multi-dimensional market context into a single confidence score and providing automated trade object plotting—no more manual target calculations or cluttered charts. Its “Assassin Mode” ensures only the most compelling setups trigger, saving traders time and reducing noise.
Disclaimer
This indicator is for educational purposes. Past performance does not guarantee future results. Always backtest across symbols/timeframes, combine with personal discretion, and apply strict risk management before trading live.
Monthly Open Lines (Historical, Accurate)📝 Description:
This indicator plots horizontal lines at every monthly open across the entire chart, helping traders easily identify key support/resistance levels based on the start of each month.
✅ Accurately tracks all historical monthly opens
✅ Lines extend fully across the screen (like regular horizontal lines)
✅ Black lines for clean, minimal visual impact
✅ Works on any timeframe (intraday, daily, etc.)
📊 Ideal For:
Price action traders
Support/resistance mapping
Monthly level breakout strategies
Institutional order flow tracking

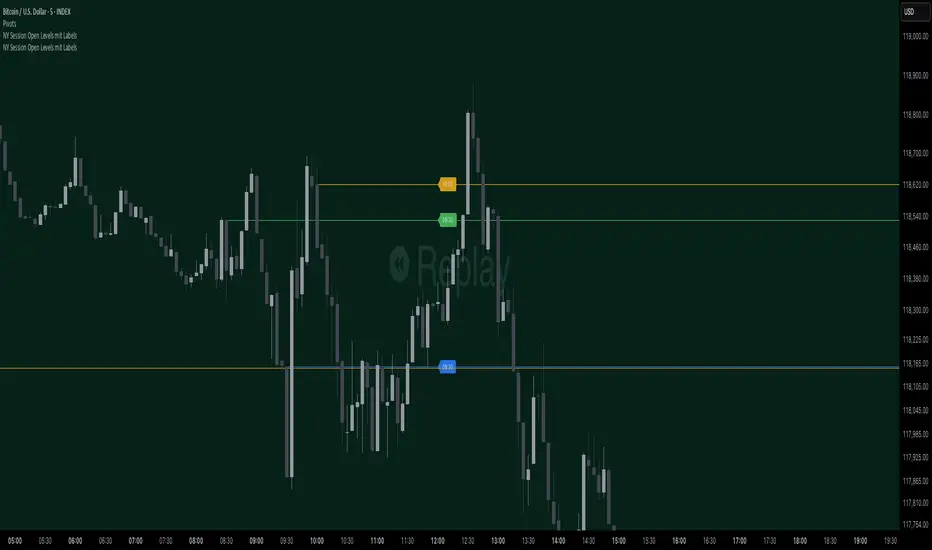
NY Session Open Levels This indicator automatically draws horizontal lines at the opening prices of the New York trading session at 08:30, 09:30, and 10:00 AM NY time. Each line is labeled and extended to the right, providing clear reference points for key intraday levels. The lines and labels reset daily and are ideal for identifying reaction zones during the early U.S. trading hours.

NY Session Open Levels mit LabelsThis indicator automatically draws horizontal lines at the opening prices of the New York trading session at 08:30, 09:30, and 10:00 AM NY time. Each line is labeled and extended to the right, providing clear reference points for key intraday levels. The lines and labels reset daily and are ideal for identifying reaction zones during the early U.S. trading hours.
Custom Opening TimesThis indicator displays custom opening levels on your chart. Define multiple opening times, each with its own customizable style. Display these levels as horizontal lines at the opening price, or as vertical lines to mark the opening time.
Custom Opening Times
4 Independent Groups with 4 custom opening levels each
Set any custom opening time (displayed in New York Local Time)
Choose between Opening Price lines, Vertical time markers, or Both
Cutoff Times: Stop extending lines after specified times
Higher Timeframe Levels
5 Configurable HTF levels supporting any timeframe
Display opening prices from Daily, Weekly, Monthly, Quarterly, and custom timeframes
Show Previous High/Low levels from higher timeframes

Order-Flow Market StructureOrder-Flow Market Structure by The_Forex_Steward
A precision tool for visualizing internal shifts, swing structure, BOS events, Fibonacci levels, and multi-timeframe alerts.
What It Does
The Order-Flow Market Structure indicator intelligently tracks and visualizes price structure using higher timeframe candles. It automatically detects:
• Internal bullish and bearish structure shifts
• Swing highs and lows (HH, HL, LH, LL)
• Break of Structure (BoS) confirmations
• Fibonacci retracement levels from recent swing moves
• Real-time alerts across LTF, MTF, and HTF modes
It’s a complete tool for traders who follow Smart Money Concepts, ICT, or institutional price action strategies.
How It Works
• You select a Higher Timeframe (HTF) to set the structural context
• Internal shifts are identified using HTF candle closes
• The indicator scans for swing highs/lows after each internal shift
• Breaks of previous swing points confirm BoS and plot horizontal lines
• Zigzag lines visually connect structural points (swings and BoS)
• Fibonacci levels are drawn between the latest swings
• Alerts can be configured for structure shifts, BoS events, and fib level breaks
How to Use It
Set your preferred HTF (e.g., 1H while trading on 5-minute)
Enable Fibonacci levels to visualize retracement zones
Watch for:
• Bullish internal shifts → HL to HH
• Bearish internal shifts → LH to LL
• BOS → Breakout confirmation
Enable alerts to catch structural events in real-time
Adjust the "Safe History Offset" if working with long lookbacks or volatile assets
Who It's For
• Traders using Smart Money, ICT, or market structure-based systems
• Scalpers, day traders, and swing traders
• Anyone needing precise structural insight across multiple timeframes
Features
• BoS detection with custom line styles and width
• HH, HL, LH, LL label plotting
• Optional Fibonacci retracement zones
• Custom alerts for swing shifts and fib level breaks
• LTF, MTF, and HTF alert modes
Stay aligned with structure, trade with precision, and get alerted to key shifts in real time.

Fractal Pullback Market StructureFractal Pullback Market Structure
Author: The_Forex_Steward
License: Mozilla Public License 2.0
The Fractal Pullback Market Structure indicator is a sophisticated price action tool designed to visualize internal structure shifts and break-of-structure (BoS) events with high accuracy. It leverages fractal pullback logic to identify market swing points and confirm whether a directional change has occurred.
This indicator detects swing highs and lows based on fractal behavior, drawing zigzag lines to connect these key pivot points. It classifies and labels each structural point as either a Higher High (HH), Higher Low (HL), Lower High (LH), or Lower Low (LL). Internal shifts are marked using triangle symbols on the chart, distinguishing bullish from bearish developments.
Break of Structure events are confirmed when price closes beyond the most recent swing high or low, and a horizontal line is drawn at the breakout level. This helps traders validate when a structural trend change is underway.
Users can configure the lookback period that defines the sensitivity of the pullback detection, as well as a timeframe multiplier to align the logic with higher timeframes such as 4H or Daily. There are visual customization settings for the zigzag lines and BoS markers, including color, width, and style (solid, dotted, or dashed).
Alerts are available for each key structural label—HH, HL, LH, LL—as well as for BoS events. These alerts are filtered through a selectable alert mode that separates signals by timeframe category: Low Timeframe (LTF), Medium Timeframe (MTF), and High Timeframe (HTF). Each mode allows the user to receive alerts only when relevant to their strategy.
This indicator excels in trend confirmation and reversal detection. Traders can use it to identify developing structure, validate internal shifts, and anticipate breakout continuation or rejection. It is particularly useful for Smart Money Concept (SMC) traders, swing traders, and those looking to refine entries and exits based on price structure rather than lagging indicators.
Visual clarity, adaptable timeframe logic, and precise structural event detection make this tool a valuable addition to any price action trader’s toolkit.

Machine Learning Key Levels [AlgoAlpha]🟠 OVERVIEW
This script plots Machine Learning Key Levels on your chart by detecting historical pivot points and grouping them using agglomerative clustering to highlight price levels with the most past reactions. It combines a pivot detection, hierarchical clustering logic, and an optional silhouette method to automatically select the optimal number of key levels, giving you an adaptive way to visualize price zones where activity concentrated over time.
🟠 CONCEPTS
Agglomerative clustering is a bottom-up method that starts by treating each pivot as its own cluster, then repeatedly merges the two closest clusters based on the average distance between their members until only the desired number of clusters remain. This process creates a hierarchy of groupings that can flexibly describe patterns in how price reacts around certain levels. This offers an advantage over K-means clustering, since the number of clusters does not need to be predefined. In this script, it uses an average linkage approach, where distance between clusters is computed as the average pairwise distance of all contained points.
The script finds pivot highs and lows over a set lookback period and saves them in a buffer controlled by the Pivot Memory setting. When there are at least two pivots, it groups them using agglomerative clustering: it starts with each pivot as its own group and keeps merging the closest pairs based on their average distance until the desired number of clusters is left. This number can be fixed or chosen automatically with the silhouette method, which checks how well each point fits in its cluster compared to others (higher scores mean cleaner separation). Once clustering finishes, the script takes the average price of each cluster to create key levels, sorts them, and draws horizontal lines with labels and colors showing their strength. A metrics table can also display details about the clusters to help you understand how the levels were calculated.
🟠 FEATURES
Agglomerative clustering engine with average linkage to merge pivots into level groups.
Dynamic lines showing each cluster’s price level for clarity.
Labels indicating level strength either as percent of all pivots or raw counts.
A metrics table displaying pivot count, cluster count, silhouette score, and cluster size data.
Optional silhouette-based auto-selection of cluster count to adaptively find the best fit.
🟠 USAGE
Add the indicator to any chart. Choose how far back to detect pivots using Pivot Length and set Pivot Memory to control how many are kept for clustering (more pivots give smoother levels but can slow performance). If you want the script to pick the number of levels automatically, enable Auto No. Levels ; otherwise, set Number of Levels . The colored horizontal lines represent the calculated key levels, and circles show where pivots occurred colored by which cluster they belong to. The labels beside each level indicate its strength, so you can see which levels are supported by more pivots. If Show Metrics Table is enabled, you will see statistics about the clustering in the corner you selected. Use this tool to spot areas where price often reacts and to plan entries or exits around levels that have been significant over time. Adjust settings to better match volatility and history depth of your instrument.

X ORTX ORT — Opening Range & Time Reference Tool
Overview
The X ORT indicator is a precision tool designed for intraday traders seeking to anchor their trading decisions to high-probability price levels. It captures key market reference points including Opening Ranges, Settlement Prices, and Time-Specific Opens, all based on New York time, to help identify potential pivots and directional bias in the market.
Key Features & Usage
🔹 Opening Range Boxes (ORs)
The indicator defines up to two customizable Opening Ranges (e.g., 9:30–9:59 and 8:20–8:49 ET). Each range dynamically tracks the high, low, and midpoint price as the session unfolds, and continues to extend those levels forward throughout the day.
Use as Pivots: The high and low of the Opening Range often act as intraday support and resistance zones. A breakout above the ORH (Opening Range High) may signal bullish intent, while a drop below the ORL (Opening Range Low) may suggest bearish momentum.
Use for Directional Bias: If price remains above or below the range after completion, it may indicate a continuation in that direction. The midpoint (dashed line) serves as a mean-reversion or fair value pivot.
🔸 Settlement Price Anchors
The indicator optionally plots Daily, Weekly, and Monthly Settlement Prices, which are significant institutional reference points.
Use as Market Anchors: Settlement prices are often used by professionals to gauge positioning. Price acceptance above or below settlement can signal strength or weakness and guide directional trades.
Historical weekly and monthly settlements help define multi-day or swing levels for broader context.
🔹 Time-Based Open Levels
X ORT also draws horizontal lines at the open price of specific time points: Midnight, 8:30 AM, 9:30 AM, and 1:30 PM ET.
Use for Session Anchors: These reference opens are useful for understanding session shifts, aligning with key economic releases (like 8:30 AM), and gauging session-to-session continuity.
Why Use X ORT?
Objective Structure: Provides rule-based levels to avoid emotional trading.
Visual Clarity: Transparent, extendable boxes and labeled lines help traders focus on key decision zones.
Multi-Time Context: Blends intraday and higher timeframe levels to support short-term and swing traders.
Whether you're breakout trading, fading range extremes, or gauging market bias, X ORT offers a reliable structural foundation that aligns with how professionals track price behavior throughout the trading day.

RSI-BBGun-v6.1RSI BB Gun – Operator's Guide
“Eyes on target. Wait for the right moment. Then strike.”
________________________________________
🎯 Mission Objective
RSI BB Gun identifies extreme market conditions using RSI and Bollinger Bands, then overlays trend and volatility intelligence so you know when the setup is real.
The ❌ is your target acquisition signal—price just moved from an extreme zone back into play. Now you’ve got a clean radar lock.
________________________________________
📡 How to Operate
🟣 Step 1: Watch for the ❌'s (Black X = RSI & Bollinger Band Extremes Encountered)
• The Purple X means price and RSI are both stretched—and just snapped back into range.
• The target is now in the cross hairs and potentially ready for engagement.
🟥 Step 2: Confirm the Trend
• The thick ribbon tells you if the trend is with you:
o 🟢 Green = Uptrend. Focus on long setups.
o 🔴 Red = Downtrend. Focus on puts or short plays.
• Align with trend. Only engage when the field favors your position.
🔺 Step 3: Evaluate Signal Context
• Green Triangles = price just crossed below lower Bollinger Band (oversold).
• Red Triangles = price crossed above upper Band (overbought).
• Horizontal Lines Disappeared = The bar after the green or red horizontal line disappears means its time. We patiently wait for this as it means the momentum may be changing.
• These are your early indicators—they scout the setup on the GO / NO GO DECISION.
• ❌ + triangle + trend = clean shot.
________________________________________
☁️ Avoid These Situations
• ❌ in a choppy/no-trend zone = false alarm. Don’t engage.
• Repeated black ❌s without a purple ❌confirmation = low conviction. Let it go.
________________________________________
________________________________________
🪖 Operator's Mindset
“You don’t chase trades. You stalk them. When the ❌ flashes, the system has found a target. What you do next is up to your discipline, your tools, and your plan.”
________________________________________
Note: This is a free version. Upcoming paid version includes multi-timeframes working together. Multiple strategies. Volatility meter. Make money and master the BB Gun so that you can elevate to the Snipers weapon.
🔒 Want More Firepower?
Upgraded version coming soon. Unlocks next-gen targeting tools:
• Multi-timeframe RSI intelligence in a live dashboard
• Precision-timed combo signals based on layered volatility + RSI logic
• Advanced trend filters, trade zone overlays, and sniper-level entry indicators
• Ideal for swing traders and options strategists who want clarity under pressure
💥 Budget-friendly. No subscription. Upgrade when you're ready to go Pro.
Tip: Make 4+ trades mastering this setup. Then use a small portion of the trades to gain more features. Always be in a position you cannot lose.
🆚 Why This Beats Standard RSI/BB Tools
Mission Feature Basic Indicators RSI Ribbon Lite
Trend Confirmation ❌ ✅ Ribbon Overlay
Multi-Timeframe Awareness ❌ ✅ 5-Timeframe RSI Grid
Volatility Confirmation ❌ ✅ Weighted ATR Scoring
Combo Signal Alerts ❌ ✅ ❌ Reentry Combo Alerts
TradingView Alerts ❌ ✅ Built-In Radar Ping
#rsi #bb #bollingerbands #hull ma #trend

Opening Range Breakout🧭 Overview
The Open Range Breakout (ORB) indicator is designed to capture and display the initial price range of the trading day (typically the first 15 minutes), and help traders identify breakout opportunities beyond this range. This is a popular strategy among intraday and momentum traders.
🔧 Features
📊 ORB High/Low Lines
Plots horizontal lines for the session’s high and low
🟩 Breakout Zones
Background highlights when price breaks above or below the range
🏷️ Breakout Labels
Text labels marking breakout events
🧭 Session Control
Customizable session input (default: 09:15–09:30 IST)
📍 ORB Line Labels
Text labels anchored to the ORB high and low lines (aligned right)
🔔 Alerts
Configurable alerts for breakout events
⚙️ Adjustable Settings
Show/hide background, labels, session window, etc.
⏱️ Session Logic
• The ORB range is calculated during a defined session window (default: 09:15–09:30).
• During this window, the highest high and lowest low are recorded as ORB High and ORB Low.
📈 Breakout Detection
• Breakout Above: Triggered when price crosses above the ORB High.
• Breakout Below: Triggered when price crosses below the ORB Low.
• Each breakout can trigger:
• A background highlight (green/red)
• A text label (“Breakout ↑” / “Breakout ↓”)
• An optional alert
🔔 Alerts
Two built-in alert conditions:
1. Breakout Above ORB High
• Message: "🔼 Price broke above ORB High: {{close}}"
2. Breakout Below ORB Low
• Message: "🔽 Price broke below ORB Low: {{close}}"
You can create alerts in TradingView by selecting these from the Add Alert window.
📌 Best Use Cases
• Intraday momentum trading
• Breakout and scalping strategies
• First 15-minute range traders (NSE, BSE markets)

GeeksDoByte 15m & 30m ORB + Prev Day High/LowCME_MINI:NQ1!
How It Works
Opening Ranges
At 9:30 ET, the script begins tracking the high & low.
It uses two fixed sessions:
15 min from 09:30 to 09:45
30 min from 09:30 to 10:00
On the very first bar of each session it initializes the range, then continuously updates the high/low on each new intraday bar.
Dashed lines are drawn when the session opens and extended horizontally across subsequent bars.
Previous Day’s Levels
Independently, it fetches yesterday’s high and low via a daily security call.
These historic levels are plotted as simple horizontal lines for daily context.
How to Use
Breakout Entries
A close above the 15 min ORB high can signal an early breakout; a further push above the 30 min ORB high confirms extended momentum.
Conversely, breaks below the respective lows can indicate short setups.
Support & Resistance
Yesterday’s high/low often act as magnet levels. If price is near the previous high when the opening ranges break, you get a confluence zone worth watching.
Trade Management
Combine the two opening-range levels to tier your stops or scale in.
For example, you might place an initial stop below the 15 min low and a wider stop below the 30 min low.

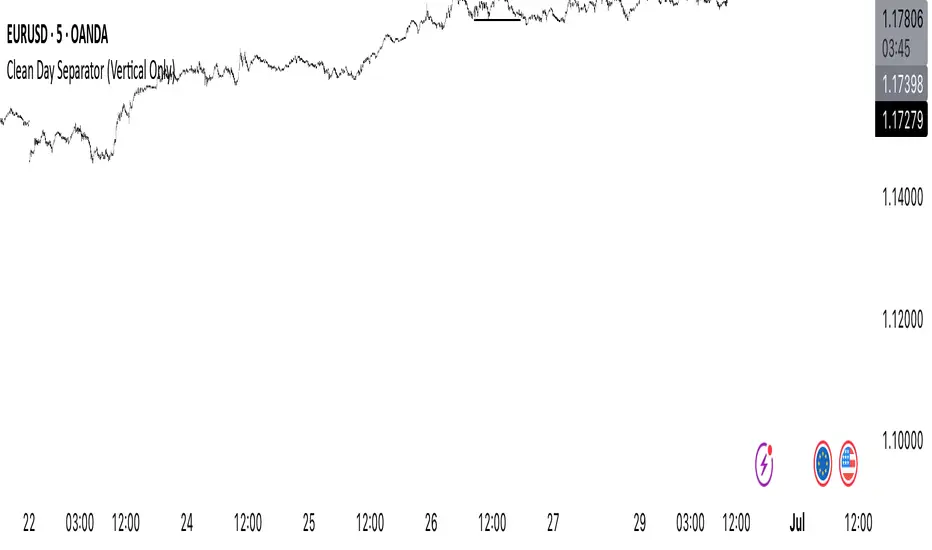
Clean Day Separator (Vertical Only)Clean Day Separator (Vertical Only) is a minimalist indicator for traders who value clarity and structure on their charts.
This tool draws:
✅ Vertical dashed lines at the start of each new day
✅ Optional day-of-week labels (Monday, Tuesday, etc.)
It’s designed specifically for clean chart lovers — no horizontal lines, no boxes, just what you need to mark time and keep your focus.
Perfect for:
Intraday traders who track market rhythm
Price action purists
Anyone who wants to reduce visual noise
Customizable settings:
Toggle day labels on/off
Choose line and text colors
Set label size to match your chart style
Manual VAH/VAL LevelsManual VAH/VAL Levels is a utility indicator that lets traders manually display the Value Area High (VAH) and Value Area Low (VAL) from the prior trading day, based on a Fixed Range Volume Profile tool.
This script is designed to:
Draw horizontal lines at the manually input VAH and VAL levels
Label each line with the corresponding price, aligned clearly to the right of the chart
Display levels only during the regular trading session for focused market context
Maintain a clean chart appearance with transparent label backgrounds
💡 How to Use:
Apply TradingView's Fixed Range Volume Profile tool to the prior day's session
Manually enter the VAH and VAL values into the script settings
The script will draw and label these levels dynamically during the NY market session
This tool is ideal for:
Traders using volume-based key levels for intraday decision-making
Contextualizing price action near areas of prior day value
Confluence analysis when paired with opening range, CVD, or breakout systems

Breakout Confirmation🔍 Indicator Name: Breakout Confirmation (Body + Volume)
📌 Purpose:
This indicator is designed to detect high-probability breakout setups based on price structure and volume strength. It identifies moments when the market breaks through a key support or resistance level, confirmed by two consecutive strong candles with large real bodies and high volume.
⚙️ How It Works
1. Support and Resistance Detection
The indicator uses pivot points to identify potential horizontal support and resistance levels.
A pivot high or pivot low is considered valid if it stands out over a configurable number of candles (default: 50).
Only the most recent valid support and resistance levels are tracked and displayed as horizontal lines on the chart.
2. Breakout Setup
The breakout condition is defined as:
First Candle (Breakout Candle):
Large body (compared to the recent body average)
High volume (compared to the recent volume average)
Must close beyond a resistance or support level:
Close above resistance (bullish breakout)
Close below support (bearish breakout)
Second Candle (Confirmation Candle):
Also must have a large body and high volume
Must continue in the direction of the breakout (i.e., higher close in bullish breakouts, lower close in bearish ones)
3. Signal Plotting
If both candles meet the criteria, the indicator plots:
A green triangle below the candle for bullish breakouts
A red triangle above the candle for bearish breakouts
📈 How to Interpret the Signals
✅ Green triangle below a candle:
Indicates a confirmed bullish breakout.
The price has closed above a recent resistance level with strength.
The trend may continue higher — possible entry for long positions.
🔻 Red triangle above a candle:
Indicates a confirmed bearish breakout.
The price has closed below a recent support level with strength.
Potential signal to enter short or exit long positions.
⚠️ The plotted horizontal lines show the last key support and resistance levels. These are the zones being monitored for breakouts.
📊 How to Use It
Timeframe: Works best on higher timeframes (1H, 4H, Daily), but can be tested on any chart.
Entry: Consider entries after the second candle confirms the breakout.
Stop Loss:
For longs: Below the breakout candle or the broken resistance
For shorts: Above the breakout candle or broken support
Take Profit:
Based on previous structure, risk:reward ratios, or using trailing stops.
Filter with Trend or Other Indicators (optional):
You can combine this with moving averages, RSI, or market structure for confluence.
🛠️ Customization Parameters
lengthSR: How many candles to look back for identifying support/resistance pivots.
volLength: Length of the moving average for volume and body size comparison.
bodyMultiplier: Multiplier threshold to define a “large” body.
volMultiplier: Multiplier threshold to define “high” volume.
✅ Ideal For:
Price action traders
Breakout traders
Traders who use volume analysis
Anyone looking to automate the detection of breakout + confirmation setups

Wavelet-Trend ML Integration [Alpha Extract]Alpha-Extract Volatility Quality Indicator
The Alpha-Extract Volatility Quality (AVQ) Indicator provides traders with deep insights into market volatility by measuring the directional strength of price movements. This sophisticated momentum-based tool helps identify overbought and oversold conditions, offering actionable buy and sell signals based on volatility trends and standard deviation bands.
🔶 CALCULATION
The indicator processes volatility quality data through a series of analytical steps:
Bar Range Calculation: Measures true range (TR) to capture price volatility.
Directional Weighting: Applies directional bias (positive for bullish candles, negative for bearish) to the true range.
VQI Computation: Uses an exponential moving average (EMA) of weighted volatility to derive the Volatility Quality Index (VQI).
Smoothing: Applies an additional EMA to smooth the VQI for clearer signals.
Normalization: Optionally normalizes VQI to a -100/+100 scale based on historical highs and lows.
Standard Deviation Bands: Calculates three upper and lower bands using standard deviation multipliers for volatility thresholds.
Signal Generation: Produces overbought/oversold signals when VQI reaches extreme levels (±200 in normalized mode).
Formula:
Bar Range = True Range (TR)
Weighted Volatility = Bar Range × (Close > Open ? 1 : Close < Open ? -1 : 0)
VQI Raw = EMA(Weighted Volatility, VQI Length)
VQI Smoothed = EMA(VQI Raw, Smoothing Length)
VQI Normalized = ((VQI Smoothed - Lowest VQI) / (Highest VQI - Lowest VQI) - 0.5) × 200
Upper Band N = VQI Smoothed + (StdDev(VQI Smoothed, VQI Length) × Multiplier N)
Lower Band N = VQI Smoothed - (StdDev(VQI Smoothed, VQI Length) × Multiplier N)
🔶 DETAILS
Visual Features:
VQI Plot: Displays VQI as a line or histogram (lime for positive, red for negative).
Standard Deviation Bands: Plots three upper and lower bands (teal for upper, grayscale for lower) to indicate volatility thresholds.
Reference Levels: Horizontal lines at 0 (neutral), +100, and -100 (in normalized mode) for context.
Zone Highlighting: Overbought (⋎ above bars) and oversold (⋏ below bars) signals for extreme VQI levels (±200 in normalized mode).
Candle Coloring: Optional candle overlay colored by VQI direction (lime for positive, red for negative).
Interpretation:
VQI ≥ 200 (Normalized): Overbought condition, strong sell signal.
VQI 100–200: High volatility, potential selling opportunity.
VQI 0–100: Neutral bullish momentum.
VQI 0 to -100: Neutral bearish momentum.
VQI -100 to -200: High volatility, strong bearish momentum.
VQI ≤ -200 (Normalized): Oversold condition, strong buy signal.
🔶 EXAMPLES
Overbought Signal Detection: When VQI exceeds 200 (normalized), the indicator flags potential market tops with a red ⋎ symbol.
Example: During strong uptrends, VQI reaching 200 has historically preceded corrections, allowing traders to secure profits.
Oversold Signal Detection: When VQI falls below -200 (normalized), a lime ⋏ symbol highlights potential buying opportunities.
Example: In bearish markets, VQI dropping below -200 has marked reversal points for profitable long entries.
Volatility Trend Tracking: The VQI plot and bands help traders visualize shifts in market momentum.
Example: A rising VQI crossing above zero with widening bands indicates strengthening bullish momentum, guiding traders to hold or enter long positions.
Dynamic Support/Resistance: Standard deviation bands act as dynamic volatility thresholds during price movements.
Example: Price reversals often occur near the third standard deviation bands, providing reliable entry/exit points during volatile periods.
🔶 SETTINGS
Customization Options:
VQI Length: Adjust the EMA period for VQI calculation (default: 14, range: 1–50).
Smoothing Length: Set the EMA period for smoothing (default: 5, range: 1–50).
Standard Deviation Multipliers: Customize multipliers for bands (defaults: 1.0, 2.0, 3.0).
Normalization: Toggle normalization to -100/+100 scale and adjust lookback period (default: 200, min: 50).
Display Style: Switch between line or histogram plot for VQI.
Candle Overlay: Enable/disable VQI-colored candles (lime for positive, red for negative).
The Alpha-Extract Volatility Quality Indicator empowers traders with a robust tool to navigate market volatility. By combining directional price range analysis with smoothed volatility metrics, it identifies overbought and oversold conditions, offering clear buy and sell signals. The customizable standard deviation bands and optional normalization provide precise context for market conditions, enabling traders to make informed decisions across various market cycles.

High/LowPrevious Day High/Low & Weekly Open Indicator
A clean and simple indicator that displays key reference levels for intraday trading.
Features:
Previous day's high and low levels
Current week's opening price
Auto-hides levels once broken (prevents clutter)
Resets automatically at the start of each trading day
No repainting - uses proper security function calls
How it works:
The indicator plots yesterday's high/low as horizontal lines on your chart. When price breaks above the previous day's high, that level disappears. Same for the low. This keeps your chart clean and shows only unbroken levels.
Perfect for:
Day traders using previous day's range as reference
Breakout trading strategies
Support/resistance analysis
Clean chart setup without manual level drawing
The cyan lines show previous day's high/low, while the orange line displays the weekly open. All levels use non-repainting data for reliable backtesting.
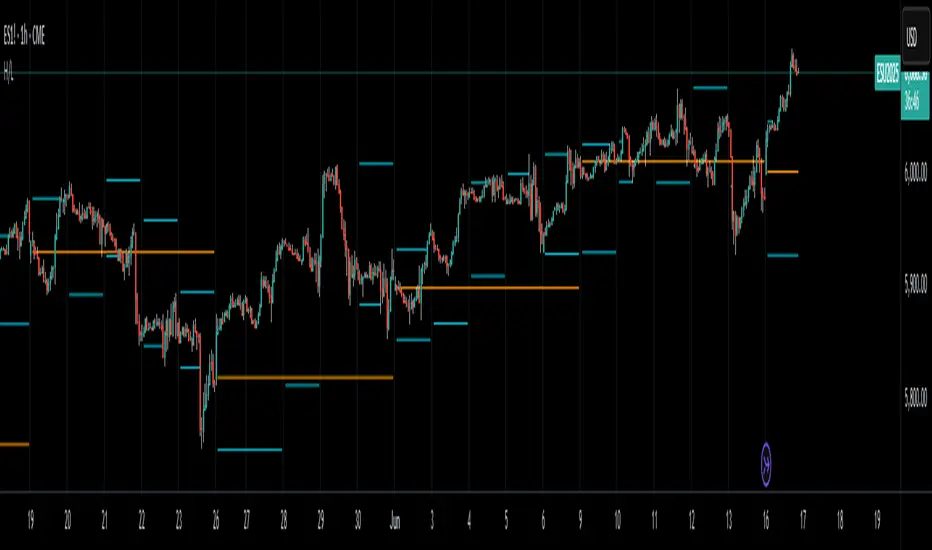
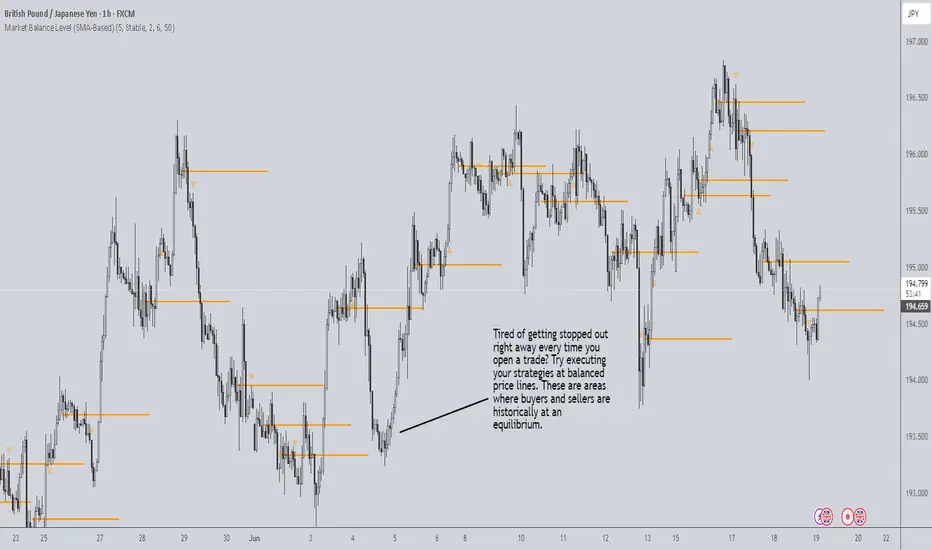
Market Balance LevelMarket Balance Level (MBL)
This indicator dynamically identifies price consolidation zones (market balance levels) and plots a horizontal line at the average midpoint of the range once a valid breakout occurs. It helps traders visualize key zones where the market was previously in equilibrium and is likely to retest before continuing its trend.
How It Works:
Detects consolidation ranges using consecutive candles within a tight high-low structure.
When a breakout occurs (above or below the range), it plots a line at the average midpoint of the consolidation.
Triangles are drawn on breakouts to visually confirm the breakout direction.
Lines can be customized by color, width, and breakout direction (bullish, bearish, or both).
Recommended Use:
Wait for price to return to the Market Balance Level (MBL). These levels often act as strong support or resistance.
Enter upon engulfment (candle closes strongly in the direction of the breakout), confirming continuation.
Features:
Adjustable consolidation sensitivity and line length.
Option to show/hide bullish or bearish MBLs.
Visual breakout markers (triangles) with alert support.
Optional alert messages for breakout events.
Use this tool to enhance your structure-based or SMC-style trading strategies.
Volatility Quality [Alpha Extract]The Alpha-Extract Volatility Quality (AVQ) Indicator provides traders with deep insights into market volatility by measuring the directional strength of price movements. This sophisticated momentum-based tool helps identify overbought and oversold conditions, offering actionable buy and sell signals based on volatility trends and standard deviation bands.
🔶 CALCULATION
The indicator processes volatility quality data through a series of analytical steps:
Bar Range Calculation: Measures true range (TR) to capture price volatility.
Directional Weighting: Applies directional bias (positive for bullish candles, negative for bearish) to the true range.
VQI Computation: Uses an exponential moving average (EMA) of weighted volatility to derive the Volatility Quality Index (VQI).
vqiRaw = ta.ema(weightedVol, vqiLen)
Smoothing: Applies an additional EMA to smooth the VQI for clearer signals.
Normalization: Optionally normalizes VQI to a -100/+100 scale based on historical highs and lows.
Standard Deviation Bands: Calculates three upper and lower bands using standard deviation multipliers for volatility thresholds.
vqiStdev = ta.stdev(vqiSmoothed, vqiLen)
upperBand1 = vqiSmoothed + (vqiStdev * stdevMultiplier1)
upperBand2 = vqiSmoothed + (vqiStdev * stdevMultiplier2)
upperBand3 = vqiSmoothed + (vqiStdev * stdevMultiplier3)
lowerBand1 = vqiSmoothed - (vqiStdev * stdevMultiplier1)
lowerBand2 = vqiSmoothed - (vqiStdev * stdevMultiplier2)
lowerBand3 = vqiSmoothed - (vqiStdev * stdevMultiplier3)
Signal Generation: Produces overbought/oversold signals when VQI reaches extreme levels (±200 in normalized mode).
Formula:
Bar Range = True Range (TR)
Weighted Volatility = Bar Range × (Close > Open ? 1 : Close < Open ? -1 : 0)
VQI Raw = EMA(Weighted Volatility, VQI Length)
VQI Smoothed = EMA(VQI Raw, Smoothing Length)
VQI Normalized = ((VQI Smoothed - Lowest VQI) / (Highest VQI - Lowest VQI) - 0.5) × 200
Upper Band N = VQI Smoothed + (StdDev(VQI Smoothed, VQI Length) × Multiplier N)
Lower Band N = VQI Smoothed - (StdDev(VQI Smoothed, VQI Length) × Multiplier N)
🔶 DETAILS
Visual Features:
VQI Plot: Displays VQI as a line or histogram (lime for positive, red for negative).
Standard Deviation Bands: Plots three upper and lower bands (teal for upper, grayscale for lower) to indicate volatility thresholds.
Reference Levels: Horizontal lines at 0 (neutral), +100, and -100 (in normalized mode) for context.
Zone Highlighting: Overbought (⋎ above bars) and oversold (⋏ below bars) signals for extreme VQI levels (±200 in normalized mode).
Candle Coloring: Optional candle overlay colored by VQI direction (lime for positive, red for negative).
Interpretation:
VQI ≥ 200 (Normalized): Overbought condition, strong sell signal.
VQI 100–200: High volatility, potential selling opportunity.
VQI 0–100: Neutral bullish momentum.
VQI 0 to -100: Neutral bearish momentum.
VQI -100 to -200: High volatility, strong bearish momentum.
VQI ≤ -200 (Normalized): Oversold condition, strong buy signal.
🔶 EXAMPLES
Overbought Signal Detection: When VQI exceeds 200 (normalized), the indicator flags potential market tops with a red ⋎ symbol.
Example: During strong uptrends, VQI reaching 200 has historically preceded corrections, allowing traders to secure profits.
Oversold Signal Detection: When VQI falls below -200 (normalized), a lime ⋏ symbol highlights potential buying opportunities.
Example: In bearish markets, VQI dropping below -200 has marked reversal points for profitable long entries.
Volatility Trend Tracking: The VQI plot and bands help traders visualize shifts in market momentum.
Example: A rising VQI crossing above zero with widening bands indicates strengthening bullish momentum, guiding traders to hold or enter long positions.
Dynamic Support/Resistance: Standard deviation bands act as dynamic volatility thresholds during price movements.
Example: Price reversals often occur near the third standard deviation bands, providing reliable entry/exit points during volatile periods.
🔶 SETTINGS
Customization Options:
VQI Length: Adjust the EMA period for VQI calculation (default: 14, range: 1–50).
Smoothing Length: Set the EMA period for smoothing (default: 5, range: 1–50).
Standard Deviation Multipliers: Customize multipliers for bands (defaults: 1.0, 2.0, 3.0).
Normalization: Toggle normalization to -100/+100 scale and adjust lookback period (default: 200, min: 50).
Display Style: Switch between line or histogram plot for VQI.
Candle Overlay: Enable/disable VQI-colored candles (lime for positive, red for negative).
The Alpha-Extract Volatility Quality Indicator empowers traders with a robust tool to navigate market volatility. By combining directional price range analysis with smoothed volatility metrics, it identifies overbought and oversold conditions, offering clear buy and sell signals. The customizable standard deviation bands and optional normalization provide precise context for market conditions, enabling traders to make informed decisions across various market cycles.
