[astropark] Ichimoku Cloud Strategy [alarms]Dear Followers,
today a Great Swing Trading Strategy , runnable on a bot , which works great on High Timeframes (1D is suggested!) but also even better on 1m Renko chart.
If you are a scalper, you will love suggested entries for fast profit. You can run it on 1h timeframe (below is not suggested) if you are used to scalp trading and close each trade whenever you feel happy (a proper trailing stop strategy is suggested anyway).
This strategy is based on the Ichimoku Cloud Indicator and let's you set a lot of settings:
works on all timeframes (but 1D and above is suggested on normal candlesticks chart)
you can run this indicator on 1m Renko chart (be sure to enable the "USING RENKO CHART? ENABLE THIS OPTION" setting)
you can use 4 kind of Ichimoku Cloud (Custom, Slow, Standard and Fast - keep only one enabled)
you can make the Ichimoku Cloud show or not
you can enable showing the possibile re-entries
you can enable an heiking ashi analysis
you can enable a trailing stop strategy ("Auto Trailing Stop Loss" and "Close Trade When Price Breaks Above the Ichimoku Cloud" are two options very much suggested to keep enabled, especially on bot trading)
you can create your own trailing stop stategy and take profit strategy
you can enable a simple take profit strategy based on RSI Overbought and Oversold levels
This strategy only trigger 1 buy or 1 sell, but if you missed the possibility to open your long or short position don't get mad, but just enable the "show re-entry signals" option, so yout will be able to enter again (be sure to always use a proper money management ).
By the way, you can set any alarms you like in order to get notified when any kind of signal is triggered (you need to use the "alarms" version for this).
Strategy results are calculated on the timeframe from May 2017 to now, so on 2 years and half, using 10000$ as initial capital and working at 1x leverage (so no leverage at all! If you like to use leverage, be sure tp use a safe option, like 3x or 5x at most in order to have liquidation price very far).
This is not the "Holy Grail", so use a proper risk management strategy.
This script will let you set all notifications you may need in order to be alerted on each triggered signals (there is also an "ALL-IN-ONE" option for free tradingview users.
The backtesting version of this indicator, which will let you backtest how the indicator will perform on any chart you may test, can be found by searching for "Ichimoku Cloud Strategy" and then choosing the astropark indicator with "red and green arrows" at the end of the name. You can find it here below too:
This is a premium indicator , so send me a private message in order to get access to this script.
Cari dalam skrip untuk "ichimoku"

[DEM] Ichimoku Bars Ichimoku Bars is designed to color price bars based on their relationship to the Ichimoku Cloud (Kumo) by comparing the current close price to both Leading Span A and Leading Span B from the traditional Ichimoku system, but with added smoothing modifications. The indicator calculates the standard Ichimoku components using Donchian midlines for the Conversion and Base lines, then creates smoothed versions of Leading Span A (20-period RMA of the average between Conversion and Base lines) and Leading Span B (20-period RMA of the 52-period Donchian midline), both displaced forward by the lagging span period. Bars are colored green when price is above both leading spans (indicating strong bullish conditions above the cloud), red when price is below both leading spans (indicating strong bearish conditions below the cloud), and magenta when price is within the cloud (indicating neutral or transitional conditions), providing traders with immediate visual feedback about price position relative to the Ichimoku equilibrium zone.
SKT's Volume Weighted Ichimoku Conviction Candle ColoringOverview
This indicator is a customized, volume-weighted variation of the classic Ichimoku Kinko Hyo system, designed to provide traders with an "at-a-glance" visualization of trend conviction and exhaustion. It overlays dynamic candle coloring on your chart, using a smooth gradient from deep green (strong bullish conviction) to gray (neutral or exhausted) to deep red (strong bearish conviction). The colors are driven by a composite score (-10 to +10, displayed as -100% to +100% strength), which quantifies probabilistic bias based on historical Ichimoku patterns, normalized for volatility and enhanced with volume dynamics.
Unlike standard Ichimoku, this version emphasizes "conviction strength" through gradients, helping identify not just trends but their reliability—e.g., fading colors signal potential reversals or pullbacks. It's particularly suited for trending assets like BTC/USD on daily or higher timeframes, where volume-weighted adjustments make lines hug price action during high-participation moves.
Key Benefits
Visual Heat Map: Candles shift colors based on score intensity, making it easy to spot weakening trends (pale shades) or strong continuations (deep shades).
Exhaustion Detection: Incorporates slope flattening, volume divergences, and cloud thinning to proactively desaturate colors near potential turns.
Strength Box: A persistent top-right label shows current % strength (e.g., "+75% Bull"), synced to the candle gradient for quick reference.
Adaptability: Works on any timeframe/asset; inputs allow tuning (e.g., for crypto's 24/7 volatility).
How It Works
The indicator computes a conviction score per bar, ranging from -10 (max bearish) to +10 (max bullish), then maps it to candle colors and a % strength display. The score is a weighted sum of five factors (total 100%), each normalized by ATR for scale-invariance:
Base: Normalized Price-Cloud Distance (40% Weight): Measures how far price is above (bullish) or below (bearish) the cloud. Calculation: Distance / ATR, clamped via tanh sigmoid for smoothness. Penalty: Fades score if distance <0.5 ATR (approaching cloud edge). Rationale: Large separations historically predict ~60-70% continuation; proximity hints at reversals.
Cloud Thickness & Color Alignment (15% Weight): Thickness = |Senkou A - B| / ATR; compared to SMA average. Boost if thick (>average: up to +3); penalty if thin (<0.5 average: up to -3). +1 bonus if cloud color aligns (green bull, red bear). Rationale: Thicker clouds act as stronger support/resistance; thinning signals exhaustion.
Other Lines: Chikou & Tenkan/Kijun Positions (15% Weight): Chikou distance from price/cloud ( / ATR): +4 if aligned far; -0.5 penalty if misaligned. Tenkan-Kijun separation ( / ATR): +3 if diverging (>0.5 ATR). Averaged for contribution. Rationale: Chikou confirms momentum from history; diverging lines indicate strength.
Exhaustion: Slope Calculation (Tenkan/Kijun) (15% Weight): Avg slope = (Tenkan linreg * 0.7 + Kijun linreg * 0.3) / ATR. Boost if steep (>0.2 abs: +3); penalty if flat (<0.1 abs: -3) or declining in trend (-4). Doubled if lines converging (<0.5 ATR sep). Rationale: Flattening/declining slopes detect fading momentum early.
Exhaustion: Volume Boost/Penalty (15% Weight): Dynamic thresholds: High = SMA(vol) + STD; Low = max(SMA - STD, 0). Boost if vol > high & slope aligns (up to +3). Penalty if vol < low or slope diverges (up to -3); skipped on new-bar first tick (barstate.isnew). Symmetric clamp: volContrib bounded ±3 to avoid spikes. Rationale: High aligning volume confirms conviction; low/diverging signals traps/exhaustion.
Score clamped ±10 overall. Gradients use RGB mixing: Deep colors for high abs(score), desaturated near 0 for smooth fades. Neutral bars vary gray shades by cloud thickness.
Inputs and Customization
All parameters are adjustable via TradingView's indicator settings:
Tenkan/Kijun/Senkou B Periods (9/26/52): Standard Ichimoku lengths; increase for smoother lines on volatile assets.
Displacement (26): Cloud shift; tweak for forward projection.
ATR Length (14): Volatility normalizer; longer for less sensitivity.
Slope/Volume/Thickness Lookbacks (5/20/20): Periods for slopes, vol SMA/STD, cloud avg—balance responsiveness vs. noise.
Scale Factor (2.0): Controls sigmoid clamping sharpness; lower for more gradual scores.
For BTC/USD: Try 20/60/120 periods on 1H/4H for crypto's non-stop trading.
Usage Instructions
Add to your chart via TradingView's Indicators menu.
Interpret Gradients: Deep Green: Strong bull (>+70% strength)—ride trends. Pale Green: Weakening bull (~+20-50%)—watch for exhaustion. Gray: Neutral (inside cloud)—avoid directionals. Symmetric for reds (bearish).
Strength Box: Top-right label shows live % (updates per tick).
Combine with: RSI/MACD for reversals (e.g., RSI divergence + pale gradient = potential turn).
Timeframes: Works on all; daily+ for best results. Test settings per asset/TF.
Notes and Disclaimer
- Performance: Backtest on your assets—score aligns with ~60% historical continuation in strong trends, but markets are unpredictable.
- Limitations: Volume-sensitive on low-TF or illiquid assets (fixed with clamps/barstate.isnew); no built-in alerts (add via TradingView).
- Disclaimer: For educational purposes only—not financial advice. Past performance ≠ future results; use with risk management.

MTF Ichimoku Conversion Line SMA with H/L mirrored levelsWelcome to MTF Ichimoku Conversion Line with SMA Highs/Lows Extended Lines!
1. Overview
It is designed to provide a multi-timeframe view of market trends and potential support/resistance levels by obtaining a Simple Moving Average (SMA) of the Conversion Line of Ichimoku Equibilium (Ichimoku Kinko-Hyo), which acts as a substantial trend line on the candlestick chart. The SMA of the conversion line smooths out price fluctuations and indicates the overall trend direction—if the candles are above it, the trend can be read as an uptrend, while below it, the trend can be read as a downtrend.
2. Calculation
The indicator first calculates the Conversion Line (see the description of Ichimoku theory anywhere, e.g., Wikipedia), as the average of the highest high and lowest low over a user-defined period (Conversion Line Length, default is 9, also recommended is 9).
It then retrieves this Conversion Line from a higher timeframe (MTF Timeframe) to add a broader perspective. Using a specified period (SMA Length)., an SMA is computed on this multi-timeframe conversion line. This SMA serves as a trend line that visually represents the prevailing price trend, making it easier to assess market direction.
3. Pivot Highs/low detection and drawing their extensions
In addition, the indicator identifies pivot highs and lows from the SMA data using a defined pivot length. When these pivots occur, horizontal lines are drawn and extended across the chart. These extended lines (drawn in a yellowish color by default) include a full extension, a half extension, and a middle extension line representing the midpoint between the high and low pivot.
4. Mirror lines
The indicator also offers optional mirror line features. When the Mirror Upside option is enabled, five additional lines are drawn above the highest extended yellow line at equal intervals. Similarly, when the Mirror Downside option is enabled, five lines are drawn below the lowest extended yellow line. These light gray mirror lines serve as extra reference levels, which can help identify potential support or resistance zones.
5. Parameters
User parameters include:
- Conversion Line Length: The period used to calculate the conversion line.
- MTF Timeframe: The higher timeframe from which the conversion line is obtained.
- SMA Length: The period over which the SMA is calculated on the conversion line.
- SMA Mode: A toggle to display either the SMA or the raw conversion line (SMA recommended).
- SMA Line Width: The thickness of the SMA line.
- Pivot Length for SMA Highs/Lows: The period used to detect pivot highs and lows in the SMA.
- Horizontal Extension: Number of bars by which the pivot and extended lines are drawn across the chart
- Colors for High and Low Pivot Lines and Extended Lines: Customizable colors are used to draw the lines.
Mirror Upside and Mirror Downside: These options enable drawing additional mirror lines above and below the extended lines.
- Hide Old Lines: An option to hide previous pivot lines once new ones are drawn for a cleaner chart. Turned on by default.
6. Conclusion
Overall, the Conversion Line SMA in this indicator smooths out the conversion line data and effectively functions as a trend line for the candlestick chart, helping traders visually interpret the underlying market trend. The extended and mirror lines provide further context for potential price reversal or continuation areas, making this a powerful tool for multi-timeframe technical analysis.

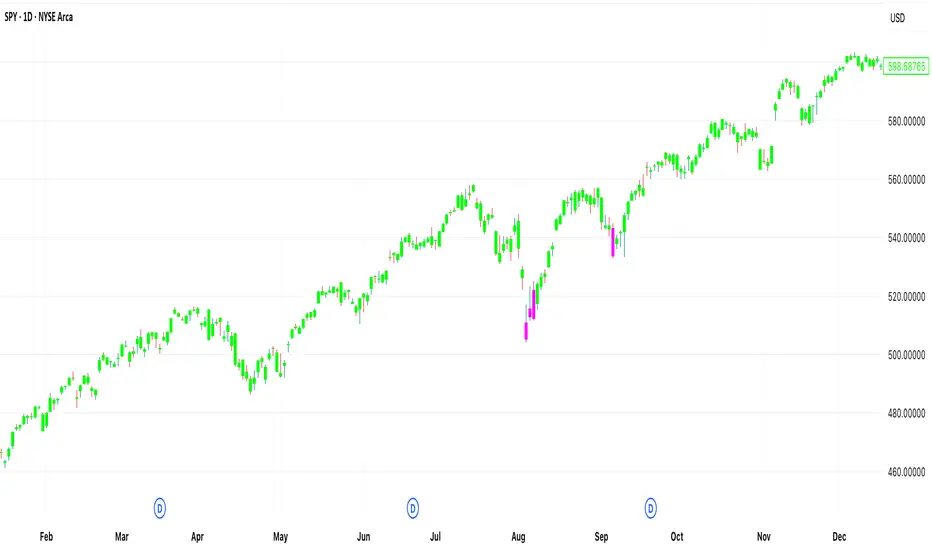
Educational Inidicators - Ichimoku CloudThis indicator is part of the Indicator Educational Series, intended to help newer traders understand and interact with various indicators. The goal is to allow users to gain a stronger understanding of an indicator's underlying philosophy, and visually see how changes to an indicator's parameters affects the trades suggested by that indicator.
The scripts in this series are all open source, with the code broken up into logical section and notated so beginner users can also understand some PineScript fundamentals.
Please understand that no indicator presented in and of itself constitutes a complete trading strategy. Rather, this series is to help users determine which indicators make sense to them, and which ones to combine to create their own trading strategy. All material presented is purely for educational purposes.
Presented here is the Ichimoku Cloud.
The Ichimoku Cloud was developed by Goichi Hosada, and first published in the late 1960s. It is used by traders to understand price momentum, and help forecast future price movements.
The indicator at its core can be understood from four component parts:
The Conversion Line - An average of the highest and lowest price in a given window. Typically, this is a "fast" average, and as such, this line has the lowest period
The Base Line - An average of the highest and lowest price in a given window. This is a "slower" average than the Conversion Line, and as such should have a larger period than the Conversion Line
Leading Span A - The average of the Conversion Line and the Base Line
[*}Leading Span B - An average of the highest and lowest price in a given window. This is the "slowest" average of all three, and as such should have the largest period
When plotted, the Conversion Line (orange by default), Base Line (purple by default), Leading Span A (blue by default), and Leading Span B (red by defaults) are all drawn on the chart along with the price candles. The area between the Leading Span A and Leading Span B lines are also shaded depending on which of the two lines is greater: whenever Leading Span A is greater the area is shaded positively (blue by default), whenever Leading Span B is greater the area is shaded negatively (red by defaults).
One interesting feature of the Ichimoku Cloud is that it drawn a certain number of candles forward. What this means is that where the cloud is drawn on the chart is reflective of prices that have occurred a number of candles in the past. This is done intentionally to help traders see how the current price is moving in relation to historical price movements on the asset.
See below for how the indicators look in their default colors on the chart
These indicators can then be used to start analyzing the price movement, and making trade decisions.
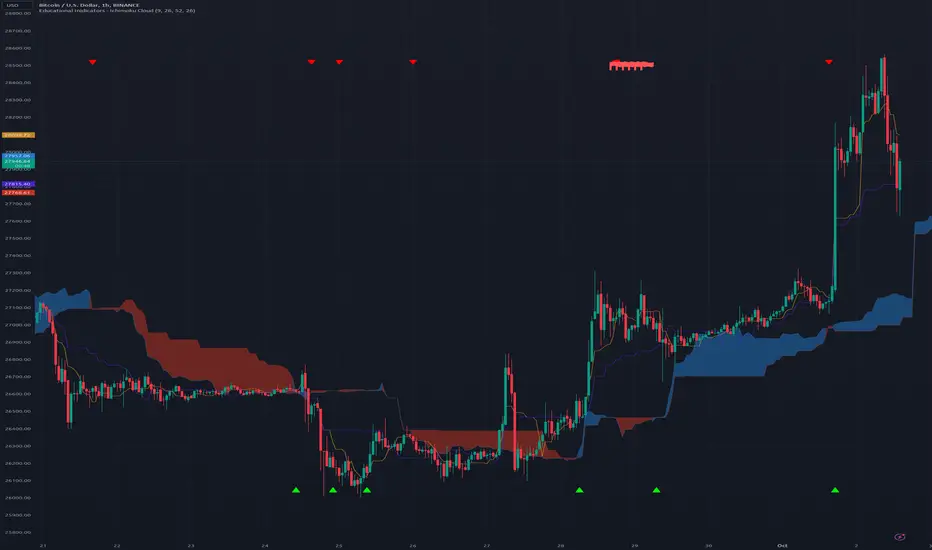
The first inference we can make is the momentum of the price. Since the lines are drawn from averages of varying speeds, the shaded area between the Leading Span lines can tell us whether the momentum is bullish (up) or bearish (down).
Whenever Leading Span A, the faster of the two lines, is above Leading Span B, that means that price is moving upward faster than it typically has, ergo we are in Bullish Momentum. On the chart, this is indicated in two ways:
The area is shaded positively (blue by default)
A green upward triangle is added to the chart to indicate where the momentum first turned Bullish
Whenever Leading Span A is below Leading Span B, that means that price is moving downward faster than it typically has, ergo we are in Bearish Momentum. On the chart, this is indicated in two ways:
The area is shaded negatively (red by default)
A red downward triangle is added to the chart to indicate where the momentum first turned Bearish
The next inference we can make is possible trading points. When we're in a period of momentum, as determined above, we know that price is going up or down, depending on the momentum we're in. We can then use the Conversion Line, Base Line, and the Price itself to confirm a good trade price.
When the asset is in Bullish Momentum, and the Conversion Line, our fastest average, is above the Base Line, our mid speed average, we know that the price is coming up quickly in the short term. When the Base Line and current Price are also above the cloud, then we have triple confirmation that price is going up, and we should enter a Long position. On the chart, this point is indicated with a green flag.
When the asset is in Bearish Momentum, and the Conversion Line is below the Base Line, we know that the price is going down quickly in the short term. When the Base Line and current Price are also below the cloud, then we have triple confirmation that price is going down, and we should enter a Short position. On the chart, this point is indicated with a red flag.
The script presented here also allows users to customize the various parameters of the Ichimoku Cloud, and visually see how analysis is affected by these changes. This is designed to allow users to modify parameters as they see fit, within certain constraints, to find the best set for them. The lines, cloud, and chart indicators will all update automatically with the users' inputs.
Consensus Tables - Oscillators, Multi-MA , DFMA, and IchimokuThis indicator is a series of underlaid tables that determine a consensus value using a simple positive or negative score for a set signal. This consensus value is also shown as a histogram and reflected on the chart's bar colors. There are a total of four different table options to choose from: a set of trend and volume oscillators, a set of 11 moving averages, a set of Fibonacci moving averages and their own consensus line, and a set of Ichimoku-based conditions. The type of table can be chosen from a drop-down menu at the top of the user settings, with settings for each of the table types grouped up respectively.
Oscillator Table:
The Oscillator table consists of the Average Directional Index (ADX) set as a value instead of +/- and is not used in the scoring to gather consensus. Rather, a value of 25 or above is used to confirm the trend regardless of positive or negative. The Chande Momentum Oscillator (CMO), Detrended Price Oscillator (DPO), Momentum, Rate of Change (ROC), Relative Strength Index (RSI), True Strength Index (TSI), and Volume Oscillator are used in the Oscillator table for a consensus value and given a + or - depending on the condition being met. The conditions and weighting are as follows:
-- CMO > or < 0, given a weight of +/- 2
-- DPO > or < 0, given a weight of +/- 2
-- Momentum > or < 0, given a weight of +/- 2
-- ROC > or < 0, given a weight of +/- 2
-- RSI > or < 50, given a weight of +/- 1
-- TSI Value Line > or < 0, given a weight of +/- 1
-- TSI Signal Line > or < 0, given a weight of +/- 1
-- Volume Osc. > or < 0, given a weight of +/- 2
The consensus value is determined by adding these values together and dividing by 13.
Multi-MA Table:
For the Moving Average Ribbon/Multi-MA table the user is able to determine the source, type, and lengths of 11 moving averages. The type selection consists of EMA, DEMA, TEMA, SMA, RMA, VWMA, WMA, SMMA, and a Hull MA. The preset values for the 11 moving averages are 5, 7, 10, 14, 21, 26, 50, 75, 100, 150, and 200. The consensus conditions and weighting are as follows:
-- If MA(1 through 10) < or > the price source, given a weight of +/- 1
-- If MA(11) < or > the price source, given a weight of +/- 2
The consensus value is determined by adding these values together and dividing by 12.
DFMA Table:
The Democratic Fibonacci Moving Average table is derived from our indicator of the same name. The source for the DFMA can be chosen by the user, but the SMA lengths are predetermined in Fibonacci intervals from 3 to 233. The DFMA line itself is determined by finding the average value of these 10 Fibonacci MA lengths. The consensus conditions and weighting are as follows:
-- If Fib. MA (3-233) < or > the source, given a weight of +/- 1
-- If DFMA value < or > the source, given a weight of +/- 2
The consensus value is determined by adding these values together and dividing by 12.
Ichimoku Table:
The Ichimoku table values a handful of conditions using the Tenkan-sen/Conversion Line, Kijun-sen/Base Line, Senkou-span A and B, and the Chikou-span, each of which are given their standard values of 9, 26, 52, and 26, respectively, but can be changed in the user settings if desired. As opposed to the other tables, there are fewer conditions to be met and given values to. All of the conditions are given the same weighting (+/- 1). The conditions are as follows:
-- Kijun-sen < or > the source
-- Tenkan-sen < or > the source
-- Kijun-sen > or < the Chikou-span
-- Tenkan-sen > or < the Kijou-sen
-- Senkou Span A > or < Senkou Span B
The consensus value is determined by dividing the total value by 5.
Overall consensus and overall trend values are given alongside each of these options. The overall consensus value is determined by taking the average of the 4 respective consensus values. Trend values are determined as such:
-- If consensus value >= 0.75, considered a "Strong Buy"
-- If consensus value is between 0.25 and 0.75, considered a "Buy"
-- If consensus value is between 0.25 and -0.25, considered "Neutral"
-- If consensus value is between -0.25 and -0.75, considered a "Sell"
-- If consensus value is <= -0.75, considered a "Strong Sell"
Table colors are set as either green, red, or gray to reflect positive, negative, and neutral sentiment sentiment. Bar colors reflect the consensus value and the determined table trend:
-- If trend for the chosen table is "Strong Buy", bar color is green
-- If trend for the chosen table is "Buy", bar color is lime
-- If trend for the chosen table is "Neutral", bar color is gray
-- If trend for the chosen table is "Sell", bar color is orange
-- If trend for the chosen table is "Strong Sell", bar color is red

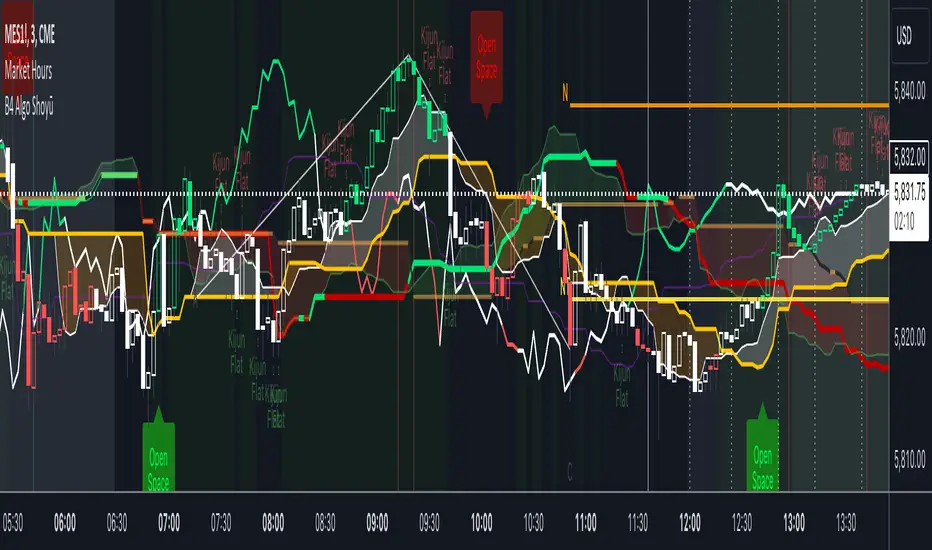
B4Signals Ichimoku Premium Addon ShoyūThis indicator is based on "Ichimoku" with additional and useful features. It is designed to complement B4Signals Ichimoku as an add-on.
FEATURES
The indicator is mainly divided into 5 parts:
* Future Tenkan-sen, Kijun-sen & Kumo Lines: Tenkan-sen next 5 days projection, Kijun-sen next 10 days, Senko Span A next 5 days and Senko Span B next 14 days will be displayed to increase depth of your analysis and help forecast price movements.
* QualityLine + DirectionLine for determining beginning and end of trend as well as a visual to spot Kijun bounces and crosses.
* 9 /26 Tenke-sen/Kijun-sen pullback detection lines, “KISS Lines”, for better entries on pullbacks.
* Flat Kijun-sen signal to determine trend exhaustion and possible reversals.
* Open Space Chikou coloring and confirmation signal for Identifying momentum breakouts and spotting areas of projected consolidation.
* Ichimoku Hosoda Target Price Targets. Simply choose point A,B and C and have 4 Hosoda price targets appear on your chart.
The addition of these features provides traders with a collection of technical metrics capable of outlining directional trend momentum, proposed pullbacks and possible continuations in any financial market. Using multiple plots, this indicator plots a forecast where the Han-ne lines might travel in the future. The Direction line gives you a clear perspective of price in relation to the Kijun. While the Quality Line gauges the health or quality of the Kumo, helping determine entries and exits, while confirming pullbacks and areas of consolidation. The “KISS Lines” help identify Tenken-sen / Kijun-sen 9/26 pullbacks and the Kijun Flat alert signals you when trend exhaustion is identified by a flat Kijun-sen.
Another significant aspect of this indicator is that it identifies the Chikou Span reaching ‘Open Space' by coloring the Chikou Span's line giving you a signal as well. This can help traders identify the market’s dominant trend (bullish or bearish) and determine an appropriate time to enter/exit active positions.
Disclaimer
Copyright by B4Signals.
The information contained in our scripts/indicators/ideas does not constitute financial advice or a solicitation to buy or sell any securities of any type. We will not accept liability for any loss or damage, including without limitation any loss of profit, which may arise directly or indirectly from the use of or reliance on such information.
All investments involve risk, and the past performance of a security, industry, sector, market, financial product, trading strategy, or individual’s trading does not guarantee future results or returns. Investors are fully responsible for any investment decisions they make. Such decisions should be based solely on an evaluation of their financial circumstances, investment objectives, risk tolerance, and liquidity needs.
BigBendFX Ichimoku Cloud | Cloud BreakoutCloud breakout is an enhancement of TradingView's built-in Ichimoku Cloud Indicator. By default, only the cloud is visible. The other Ichimoku lines can be toggled on if needed. This indicator focuses on the breakout of the Kumo cloud. An additional simple moving average filter can be added as well.
Breakout Condition
2 candlesticks are part of the breakout condition
Candlestick 1: 'open' price is still within the cloud and 'close' price breaks out of the cloud
Candlestick 2: 'open' price confirms that candlestick 1 'close' remains as a breakout
There are 4 possible breakout conditions: 2 bullish direction moves crossing each senkou span and 2 bearish direction moves crossing each senkou span
Note: ranging markets will cause false breakouts, so a moving average is integrated to help filter this out
Moving Average Integration
A simple moving average can easily be toggled on/off to filter out cloud breakout signals
The SMA length and color can be adjusted in the settings
Alerts
There are 2 alert options: bullish or bearish
Alerts will confirm if the Moving Average Integration is activated
To add to your chart simply search for the title "BigBendFX Ichimoku Cloud" in indicators & strategies.
If you would like any added features or functionalities, please comment/share below. Be sure to check out our website (link below)!
Thank you!

SSABU MTF Ichimoku Cloud✅ MTF Ichimoku Cloud (multi-time frame Ichimoku cloud) is an indicator.
This indicator is a supplementary indicator for viewing the cloud profile of a high-frame burst in a low-frame burst.
If you set the indicator instead of entering the time directly, you can set 1/3/5/13/30/45 minutes 1/2/3 / hour 1 day 1 day in Cloud MTF Set (Minute).
The default setting is 4H.
The screenshot above shows the Ichimoku Cloud with a 4-hour bar on a 15-minute chart.
Clouds of 4 hours seen from 15 minutes of sky blue, cloud of 15 minutes of blue
✅ MTF Ichimoku Cloud (멀티 타임 프레임 이치모쿠 클라우드) 지표입니다.
본 지표는 낮은 프레임의 분봉에서 높은 프레임의 분봉의 구름대 모습을 볼 수 있는 보조지표 입니다.
직접 시간을 입력 하는 건 아니고 지표를 설치하시면 Cloud MTF Set(Minute)에서 1/3/5/13/30/45분 1/2/3/시간 1일 1주로 설정이 가능합니다.
기본설정은 4H으로 되어있습니다.
위의 스크린샷은 15분봉의 차트에서 4시간봉의 Ichimoku Cloud를 적용한 모습입니다.
하늘색이 15분봉에서 보는 4시간봉의 구름, 파란색이 15분봉에 해당하는 구름
✅ Other indicators to help you trade
✅ 매매에 도움되는 다른 보조지표
Basel major 2.2

ULTIMATE ICHIMOKU TRADING SUITEThis is an update of "Uncle Mo's Ultimate Ichimoku V1"
Main features:
2 x Ichimoku Cloud
5 x EMA
2 x MA
1 x HullMA
Williams Fractal
Bollinger Bands - ***NEW***
ATR - ***NEW***
PSAR - ***NEW***
Candlestick Patterns - ***NEW***
Price Action Bars- ***NEW***
List of credits:
@br0qn for the Ichimoku
@RicardoSantos for the Bill Williams Fractal
@EmilianoMesa for the EMAs/MAs
@mohamed982 for the HullMA
@ymaheshreddy4u for the Bollinger Bands
@ChrisMoody for the Price Action Bars and PSAR
@HPotter for the ATR
@repo32 for the Candlestick Patterns
The script is open source and free to use. Feel free to change it around to suit your needs.
***If you copy & paste code from other traders to make your own script, please do remember to give them credit for their amazing work.***
Happy trading!

Ultimate Ichimoku Trend Board MTF – 6× Cloud Analyzer⚡️ Ultimate Ichimoku Trend Board MTF – 6× Cloud Analyzer
Unleash the full power of Ichimoku with this multi-timeframe trend dashboard ⚙️
Quickly identify whether each timeframe is Bullish 🟢, Bearish 🔴, or Inside the Cloud 🟠, and align your trades with the dominant trend like a pro.
🔥 Features:
✅ 6 customizable timeframes (M5 → H4)
✅ Clean & minimal dashboard — no chart clutter
✅ Instantly visualize market direction across all layers
✅ Perfect for scalpers, intraday, and swing traders
💡 See the Clouds. Read the Trends. Dominate the Market. 🌥💪

pyogi24 Intraday Ichimoku + RSIcustom script to get entry exit
its based on the ichimoku cloud indicator
and the cross over of the leading ang lagging spans to get the signals,
its under development.
i have also integrated the vwap so we know the bias of the trend.
this should work on a trending day.

RN3 Ichimoku PVSRA Scalper IndicatorThis indicator will place long (buy) and short (sell) orders using the Ichimoku Tenkan Kijun Cross strategy. When in a trade position, it will create take profit levels using Fibonacci against the highest high or lowest low of the past 2 days. You can define your own level and set your own stop loss just in case.
Senkou Span will act as your main bias.
if the price under the cloud so the bias will be bearish. You may want to focus on selling(short) on this direction.
if the price above the cloud so bias will be bullish, You may want to focus on buying(long) on this direction.
This is for scalping, but it possible to do swing.
Suggested Symbols : Forex / Crypto / Commodities
Timeframe for Entry : Less than 1D TF
Additional controls include:
PVSRA Candle
M Pivot
VWAP
B1: Yesterday High B2: Yesterday Low
C1: Today High C2: Today Low.
Here's the way you can utilize the script.
First look at the Yesterday high, and Yesteday Low.
You need to consider that would be the symbols can travel into.
If today high has broke yesteray high, there's possibly the price will can keep higher and will create new high. Likewise if today lowest broke yesterday low, there's possibly the price can keep dropping and create new low.
VWAP : You can use this to determine if the price is fair or not, the more it's trading away away the vwap this will determine if it's overbought, or oversold.
PVSRA :
using 10 Periods, it's determine the volume.
Blue(Bullish) and Pink(Bearish) the 150% more Volume from previous bar.
Green(Bullish) and Red(Bearish) the 200% more Volume from previous bar.

Best Ichimoku Buy and Sell with alertsThis is Indicator is based on Ichimoku Clouds with Buy and Sell positions and alerts. Before using this indicator take note of the following:
1. This indicator is not Repaiting.
2. there are three ways to put your SL/TP:
* you can use the yellow line above or below the candles to put your SL and your R/R ratio will be 1:1, 1:2, 1:3 (depending on the timeframe and the pairs you choose; I advise you to backtest in your desired timeframe and your currency pairs to choose the right R/R)
* You can choose SL/TP based on Percentage or ATR (It is configurable in the setting; I again advise you to backtest in your desired timeframe and your currency pairs to choose the right R/R)
3. Please pay attention to the Green and Red circles. If there is a Green circle before the Buy position it gives it more confirmation and if there is a Red circle before the Sell position it gives more confirmation on the Sell position (pay attention that these circles appear with latency)
4. If the yellow line is below the candles and it gives Sell signal or the yellow line is above the candles and it gives Buy signal, it is better to avoid that signals.
4. Use this indicator with top 30 Crypto pairs (You can also backtest on other coins as well)
5. Please use this indicator at your discretion and backtest first.
6. If you have any idea to improve the results please let me know in the comments.

[_ParkF]RSI (+ichimoku cloud)RSI
Typical RSI indicators were plotted with candles and expressed wick to resemble a candle chart,
and linear regression was added to predict changes in force intensity,
which allowed us to confirm support and resistance within linear regression .
In addition, divergence signal was marked as an additional basis for the price fluctuation point due to support and resistance .
In other words,
if the diversity signal appears together when the rsi candle is supported and resisted within linear regression ,
this is the basis for predicting that it is a point of change in the existing trend.
Finally, the period value and standard deviation of linear regression can be arbitrarily modified and used.
I hope it will help you with your trading.
--------------------------------------------------------------------------------------------------------------------------------------------------------------
(+ichimoku cloud)
Clouds made of the preceding span 1 and the preceding span 2 of the balance table can predict the trend by displaying the current price balance ahead of the future.
In addition to the role of clouds in the above-described balance sheet, this indicator also shows the cloud band support and resistance of the current RSI value.
일반적인 RSI 지표를 캔들화 하였고 꼬리까지 포함하여 캔들 차트와 유사하게 표현 하고,
캔들화한 RSI 지표에 선형회귀(채널)를 추가 하여 RSI 지표 특유의 힘의 강도의 변화를 지지와 저항으로 확인할 수 있게 해봤습니다.
또한 다이버전스 신호를 추가하여 선형회귀(채널)로 인한 지지와 저항에 따른 가격 변동의 근거로 삼을 수 있습니다.
즉, 선형회귀(채널) 안에서 RSI 캔들이 지지와 저항을 받을 때 다이버전스 신호가 함께 나타난다면 이는 기존 추세의 변화 지점임을
예측해 볼 수 있는 근거가 됩니다.
마지막으로 선형회귀(채널)의 기간값과 표준편차는 임의로 수정하여 사용할 수 있습니다.
당신의 트레이딩에 도움이 되었으면 합니다.
--------------------------------------------------------------------------------------------------------------------------------------------------------------
(+일목균형표의 구름)
일목균형표의 선행스팬1과 선행스팬2로 만들어진 구름은 현재 가격의 균형을 미래에 선행하여 표시하여 추세를 예측해볼 수 있습니다.
본 지표에서는 위에서 설명한 일목균형표의 구름의 역할과 더불어 현 RSI 값의 구름대 지지, 저항 또한 확인해볼 수 있습니다.
* I would like to express my gratitude to zdmre for revealing the linear regression source.

Kyushu Legs - Advanced Ichimoku Kinko Hyo TechniqueWhat is Kyushu Legs?
Kyushu Legs created by the open price of 9 previous weekly candle and current weekly close price.
P/s: This is the advanced Ichimoku Kinko Hyo technique by Master Goichi Hosoda
Donchian Ichimoku HybridWhat if we took the best elements from the Donchian Channel and the Ichimoku cloud and combined them into a complete system?
Strengths of the Donchian Channel:
-Dynamic support and resistance
-Measures volatility
Strengths of the Ichimoku Cloud:
-Can detect when price is trending vs ranging
-Retracement zones
-Trend identification
=== HOW TO USE THE INDICATOR ===
Green and Red bars are when price is trending. Green for trend up, Red for trend down.
Gray bars are when price is in a trading range. You can either play the edges or wait until price is trending again.
The clouds are retracement zones for pullbacks when price is trending.
Alerts are set up for when price starts to trend and starts a trading range.
=== MISC ===
Option for Dark Mode
2 VWAP with selective timeframe and Display liked Ichimoku CloudSET:CKP
This is my first indicator of VWAP that I fork from the original script by public script "VWAP Periodic".
You can see that original script by type "VWAP Periodic" from "New" in "Pine Indicator".
The reason that I want to share my script is only one thing. That I need to discuss, Is this indicator can identify the trend and can use it to adapt to the "Buy-On-Dip" strategy?
Double VWAP can show you 2 lines of VWAP form different periods as my default is "Week" and "Month" timeframe.
Not at all, it fulfils with the background of the simple colour which can be defined Trend just liked "Ichimoku Cound" (Yes indeed, green is uptrend and red is downtrend).
I hope this indicator will help :)
Wishing you good health and get wealth too. :) :) :)
---------------------------------------------------------------------------------------------
สวัสดีครับมิตรสหายทุกท่าน อินดิเคเตอร์ที่ผมจะมานำเสนอมิตรสหายนี้ เป็นอินดี้ที่จะแสดงเส้น VWAP ได้ทั้งหมด 2 เส้น โดยท่านสามารถระบุ Timeframe ของ VWAP ที่ท่านต้องการได้เลยครับ
ก่อนอื่นผมของออกตัวก่อนครับ ว่าอินดิเคเตอร์นี้ผมโฟร์คมาจาก Original Public Script จากใน Pinescript แห่ง Trading View นี่ละครับ จากอินดิเคเตอร์ที่มีชื่อว่า "VWAP Periodic" ซึ่งท่านสามารถ กดดู Original Script ได้จากการกดที่
1) ไพน์อินดิเคเตอร์
2) กดเลือกคำว่า "ใหม่"
3) หาอินดิเคเตอร์ที่ชื่อว่า "VWAP Periodic"
้เท่านี้ท่านก็จะได้สคลิปต้นแบบที่ผมนำมาปรับใช้ได้ทันทีครับ
แต่กระนั้นแล้ว ผมจะเปิดโชว์สคริปของผมที่นำมาโฟร์คแล้วให้ทุกท่านได้รับชมกันด้านล่างในส่วนของโค้ดนะครับ
จุดประสงค์ของอินดิเคเตอร์นี้คือได้ฟังแนวคิดของ VWAP จากกัลยาณมิตรเทรดเดอร์ด้วยกันแล้วรู้สึกคลิ๊ก กับอินดิเคเตอร์นี้มากครับ
จะมีอะไรดีไปกว่าการได้รู้ต้นทุนราคาของแต่ละช่วงเวลา ทั้งไทม์เฟรมที่ใหญ่อย่างระดับ "เดือน (เส้นสีเขียว)" และ ระดับ "สัปดาห์ (เส้นสีแดง)" ได้พร้อมกันและดูแท่งเทียนเพื่อ "จับจังหวะซื้อ"(ในไทม์เฟรม ระดับ วัน) ที่ราคาต่ำกว่าค่า VWAP อีกเล่าอรชุน
จุดประสงค์หลักของอินดิเคเตอร์นี้ คือมีไว้เพื่อระบุเทรนด์โดยอาศัยการดูระยะห่างของเส้น VWAP ทั้ง 2 เส้นนี้ และระบุ "จุดกลับตัว" เมื่อก้อนเมฆสีเขียวและแดงเริ่มหายไป เสมือนกับอินดิเคเตอร์ "เมฆหมอกแห่งอิชิโมคุ"
นอกจากนี้เมื่อราคาหุ้นปรับตัวเป็นเทรนด์ขาขึ้นแล้ว เรายังสามารถซื้อเฉลี่ยขาขึ้น หรือใช้กลยุทธ์ Buy-on-Dip ได้อีกด้วยครับ โดยเฉลี่ยซื้อเมื่อราคาตกย่อมาอยู่ที่เส้นสีเขียว แบบนี้เป็นต้นครับ
ผมหวังว่าอินดิเคเตอร์นี้จะเป็นประโยชน์ให้แก่มิตรสหาย และกัลยาณมิตรเทรดเดอร์ทุกท่านนะครับ
ผมขออวยพรให้ทุกท่านมีความสุข ออกจากสนามแข่งหนูนี้ ได้รับอิสระภาพทางการเงิน และ "มีสุขภาพที่แข็งแรง" Work life balance ทุกท่านครับ
ขอบคุณครับ :) :) :)

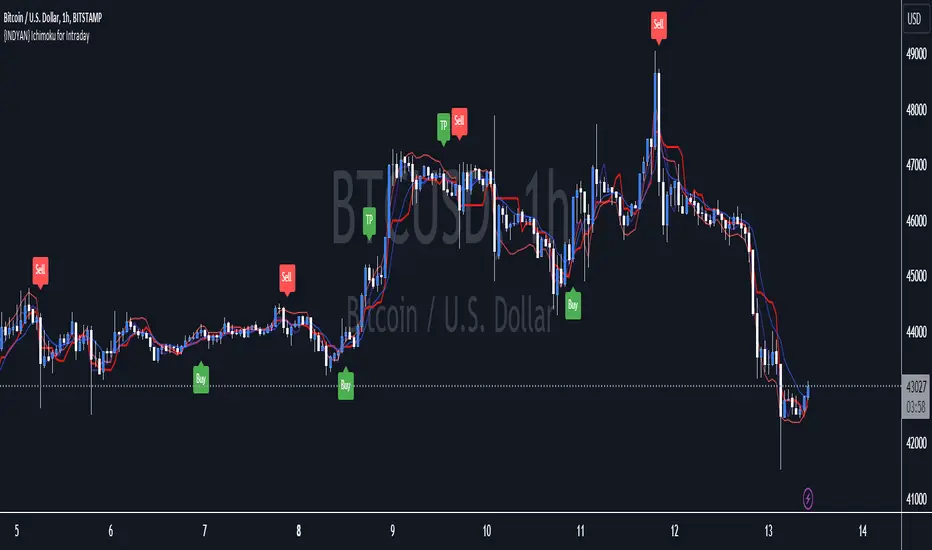
{INDYAN} Ichimoku for IntradayIts based on ichimoku, i removed cloud and mod some changes for better use in intraday trading. It can be used in stocks and index as well.Not tested on MCX and Forex.
Just watch at crossover of tenkan and kijun that RSI macd is above 60 and zero or not? If all three parameters meet go for long... exit when again another cross happen or rsi go below 40.for sell side watch for rsi below 40 and macd below zero line while crossover of kijun tenkan.
Better to use it with RSI+Macd Fast to get more accurate results.
#for better confirmation look value of VWAP and decide accordingly
Do back test before using it.
Happy Trading
Love INDyAN
#change line color as per ur wish but value should be same as it was default entered.
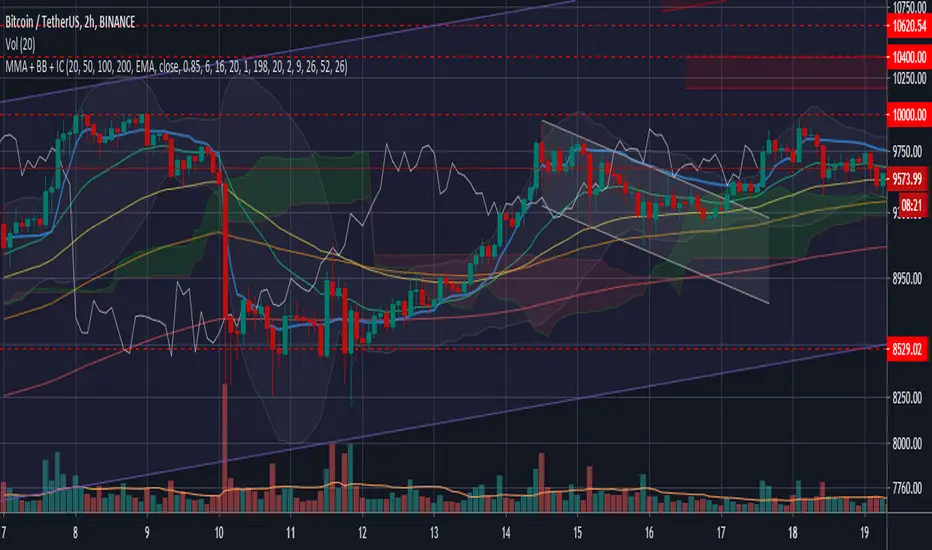
Multiple MA + Bollinger bands + Ichimoku cloudThis is an extension of my previous script 'Multiple MA', now featuring also an Ichimoku Cloud and Bollinger bands.
More, I added more functionality to the integrated Bollinger bands script, that by default use only Standard Moving Average to plot the bands. With this script you can plot Bollinger bands using the MA you prefer from the ones included in the 'Multiple MA' script (SMA, EMA, WMA, VWMA and Hull MA), allowing you to better fit your preferences.
About Ichimoku cloud I choose to enable by default only the cloud and the lagged price, which I consider the most useful components of this indicator, however you can enable each component from the settings.
I tried to make 3 indicators fit well with each other using some graphical customization (It works quite well with dark background). However keep in mind that i made this script as much customizable as possible, letting you enable and disable each one of the components from the plot. So you can take advantage of the whole indicators, and in case, clean the plot when you feel it's too much full of drawings and lines.
Please show me your support if you like the script, and find it useful, thanks!
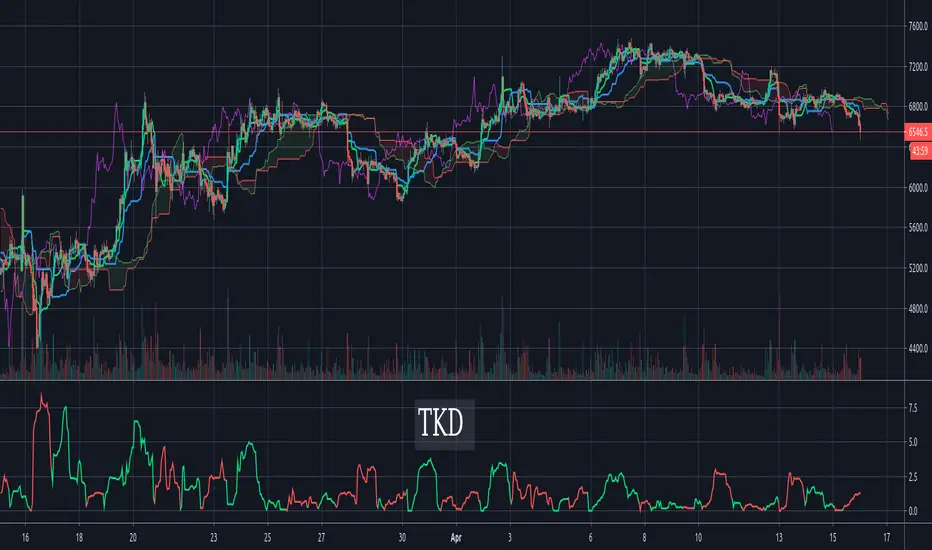
Tenkan-Sen Kijun-Sen Distance (TKD) Oscillator - IchimokuThe TKD is the distance between the Tenkan-Sen and the Kijun-Sen, expressed in percentage of current price. The further apart the tenken-sen and kijun-sen are, the more they want to snap back together. This makes for a decent oscillator. When the Tenkan-Sen is above the Kijun-Sen, the TKD is green. When it is below, the TKD is red. At the crossing points, it turns blue.
For those more familiar with Ichimoku Cloud techniques, one might also think of this indicator as a C-Clamp indicator. Bar coloring is supported and enabled by default. There's also an option to flip/invert the green/red colors in case you want to use it to judge pending cycles rather than current ones.
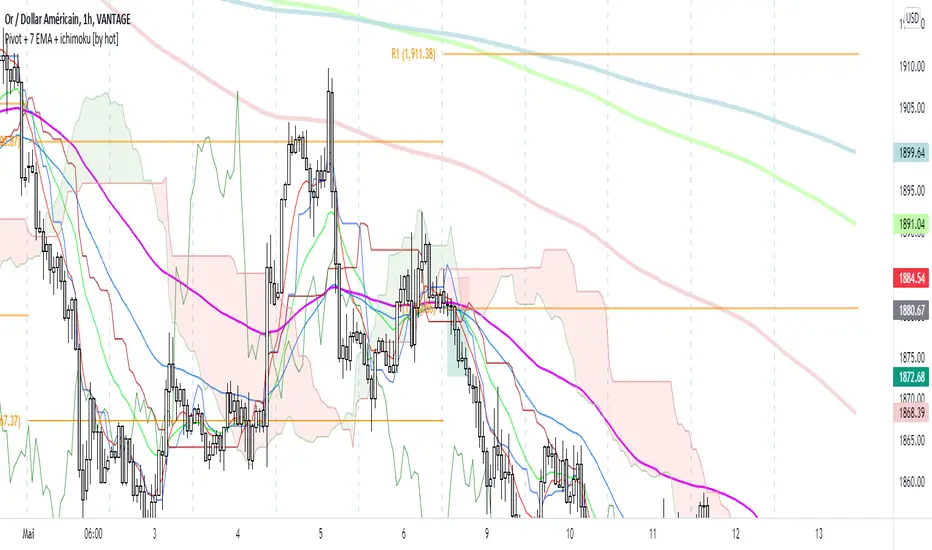
Pivot Boss 4 EMA + BB + Parabolic SAR + IchimokuA combination of a few of my favorite indicators.
1) Pivot Boss 4 EMA
2) Bollinger Bands
3) Parabolic SAR
4) Ichimoku Cloud
All credit to original authors.
