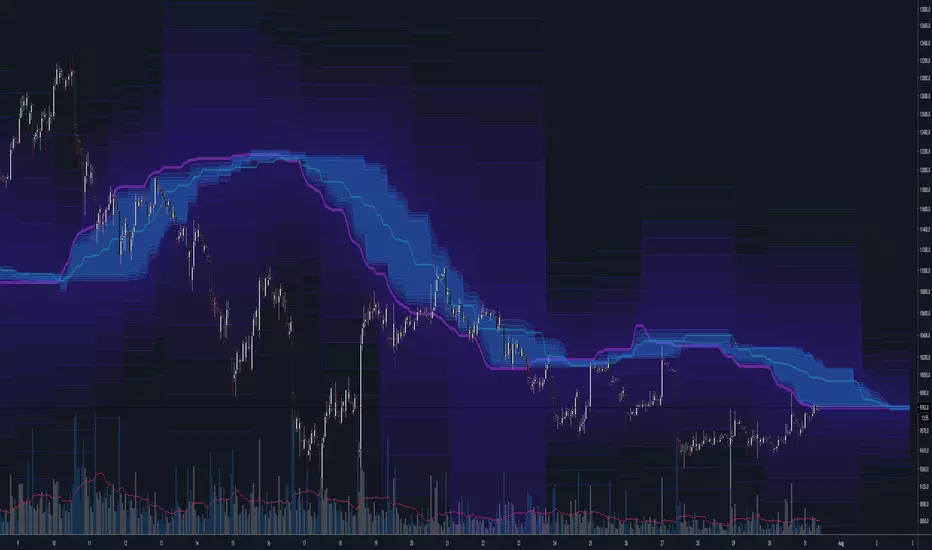
Atareum Volume Ichimuku CandleAVIC (Atareum Volume Ichimoku Candles) is clearly an awesome indicator that is based on Ichimoku concepts by combination with volume. This is a new approach of volume candles that is combined with Ichimoku concepts and creates such a powerful tool to trace the market and assists traders to make better decisions, truly.
Concept:
Using Ichimoku leading periods and calculations on redesigning new candles in combination with volume, that makes unique reform candles on Tenkansen movement, but these new candles clearly omit noises in combination with volume, and then the new redesigned system of cloud calculations builds, new series of data for Senko Span A and Senko Span B which is so odd in first view, because they will barely ever cross each other, but they show very more informative and useful.
Parameters:
Section 1 : Candle colour setting for flourishing just as you desire !
Section 2 : Defining Periods of standard Ichimoku and source of candle data in combination with determining the smoothing type of moving averages and signal period.
Section 3 : Select using Heikin Ashi based candles alongside with redesigned cloud calculation type and three additional moving averages which can plot on each newly generated candles and standard candles on a chart with the type mode defined in the previous section.
Note: if you want to omit any or all of these moving averages, you can use 0 in period, instead of selecting "None" in the plot moving option!
Usage :
Overall:
Regardless of the additional moving averages which will lead to so many situations of market according to their types and designs, that is four different period for new redesign AVIC and three period for standard chart. You can easily select periods and type for these moving averages. Also, do not forget that signal moving averages is shown only on AVIC chart and have two different colour for upward and downward trends. Other moving averages are plot by just one single colour.
Cloud levels are so important because AVIC candles show respect to them and when they break the clouds upward or downward it's surly beginning of a trend that is may last long. Also when cloud levels flatten, it is determining a support or resistance according to up cloud or down cloud nature and as long as they will continue or repeated periodically on same level of AVIC chart, it will implement their weakness or strength.
Support and Resistance:
Any flattens of cloud up or down level means the support or resistance level due to its nature, but important thing is how long the cloud lasts flatten or how many times repeated in the same level in AVIC chart.
For plotting the support or resistance you should trace first candle of start of flattens in standard chart just like following picture.
Divergence:
All Higher high or Lower low of standard chart has its reflect in AVIC chart but there is secret in it, It is named divergence. When standard chart price candles generating lower low but the AVIC chart candles do not cross the bottom, it means we will spike high as soon as AVIC candle chart complete its divergence. You can see perfect example in following picture.
Cloud level Ends
When cloud down level become flattens and cloud up level start a bull run it means we will face a great up trend movement but as soon as cloud down level starts to move up it mean we are going to finish the bull run and maybe it goes with consolidation phase or reversal phase. This reaction is exactly happen in vice versa for bear run trend. You can see both examples in following pictures.
Note: if we face end of bull run and cloud down level make a U turn shape upside down it means we will have reversal phase even not too long but it is sharp and fast reversal. If cloud down level just turn right slightly, it means we should have consolidation phase, mostly or we can continue the last trend slightly. All these situations can happen in vice versa bear run. You can see example in following picture.
Signals:
Long but risky:
You can go long when AVIC candles are green and be in position as long as they are not change in colour.
Long and safe :
You can go long when AVIC candles cross up cloud down level and be in position as long as AVIC candles cross down cloud up level.
Long and sure:
You can go long when AVIC candles cross up cloud up level and be in position as long as AVIC candles cross down cloud down level.
Short but risky:
You can go short when AVIC candles are red and be in position as long as they are not change in colour.
Short and safe :
You can go short when AVIC candles cross down cloud up level and be in position as long as AVIC candles cross up cloud down level.
Short and sure:
You can go short when AVIC candles cross down cloud down level and be in position as long as AVIC candles cross up cloud up level.
Notice : Candles with large body are so strong but if a body candle is weak or flatten it may a signal of changing colour and direction, especially when using Heikin Ashi type.
It is the result of many years of experience in markets and there are so many details about this AVIC chart which I am in the experiment phase to publish in the future, so please help me with your ideas and do not hesitate to comment and inform me any suggestions or criticism.
Cari dalam skrip untuk "ichimoku"

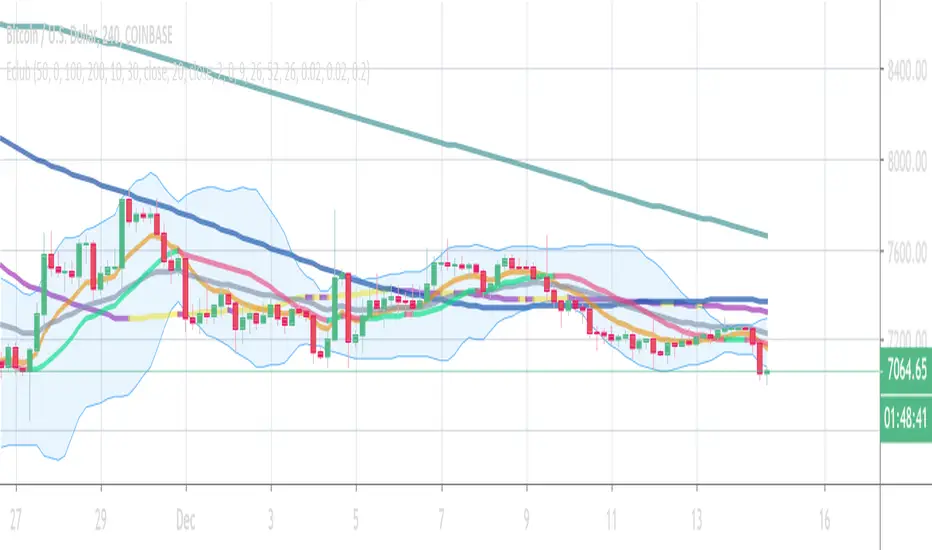
Kurotoga CloudKurutoga Cloud is a cousin-inpired cloud of the Ichimoku Kinko Hyo.
It removes the unnecessary fluff and just focus drawing the 50% levels on current mainframe for the typical RSI standard length (14) settings on current time-frame (Lead A) and the Higher time-frame (Lead B)
User should pay particular attention to where the cloud will draw longer straight-lines. Those ranges are 50% ranges of significance and likely to act as target zones for support/resistances in the future.
The cloud can also act a a very reliable trend indicator.
Intraday = D
D = W
W = M
M = 4M

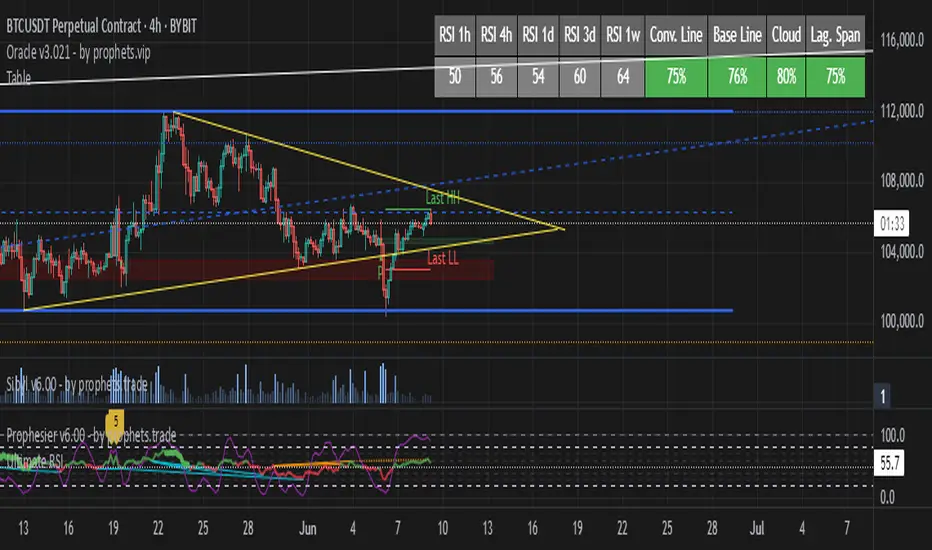
TableRSI and Ichimoku Strength Table
This indicator displays whole-number RSI values (1h, 4h, 1d, 3d, 1w) and Ichimoku strengths (Conversion Line, Base Line, Cloud, Lagging Span) in a customizable table. Toggle between horizontal (9x2) or vertical (2x10) layouts, with adjustable position (e.g., Top Right), text size (Tiny to Large), and colors (border, header, text, RSI: >70 red, <30 green, 30-70 yellow; Ichimoku: >50 green, <50 red). Ichimoku components are plotted on the chart. It offers a clear view of momentum and trend strength for traders.
IchiAlerts StudyIchimoku Alerts is an indicator born from the Ichimoku Cloud .
The Ichimoku Cloud is a collection of technical indicators that show support and resistance levels, as well as momentum and trend direction. It does this by taking multiple averages and plotting them on the chart. It also uses these figures to compute a cloud which attempts to forecast where the price may find support or resistance in the future.
We have combined several key elements of the Ichimoku Cloud to produce our unique Ichimoku Alerts indicator.
There is also a strategy version so you can backtest results if you so wish to, which I will also share on TradingView.
This indicator can be automated and adapted to fit other timeframes (I've managed to create a nice bot on the 5M timeframe with specific Ichimoku settings).
The Indicator will also print exit signals when the conversion line (blue line in the image) crossed the base line (white line in the image).
If these blue and white lines were to cross again while all other conditions of this indicator are still being met, it will fire a secondary long/short signal. The image above provides a perfect example of a primary short signal, followed by an exit signal, followed by a secondary short signal. In this instance, both signals were winning trades.
Settings within the study contain exactly the same settings you'd find in the standard Ichimoku cloud ...
- Recommended settings for Crypto are 20-60-120-30
When framing a trade after receiving a signal, you should....
- place your stop loss a the lowest cloud line (for longs) or the highest cloud line (for shorts). See image above for a short example
- Your Take profit target is yours to decide, but taking proper risk management is key, and I would advise to aim for a risk/reward ratio of 1:1.5
Hopefully I have covered the basics of this indicator. It's simple yet very effective at providing signals of changes in trend, and with the added bonus of being able to alert those changes, means you don't have to check multiple charts every hour or so!

Flunki cloud multiplier Simple ichimoku cloud multiplier for working with different time frames
Example here is a 15 minute time frame chart with a x16 cloud multiplier, therefore, a 4hr ichimoku cloud plot on a 15m chart..
Enjoy - come and join me on OneX discord, learn, trade, profit : - discord.gg
*note - screenshot is default settings, you need to put 16 in the multiplier box to get the 4hr ichimoku cloud plot.
*also note - use 24 as a multiplier on the hourly chart to get the daily cloud

bg_Ichimoku_AlertsVersion 1.0
This script is a version of the Ichimoku Cloud indicator, which has its default settings optimized for Cryptocurrency trading. (20 Period Tenkan, 60 Period Kijun, 120 Period Senkou A, 30 Period Senkou B, 30 Period Offset/Displacement).
This script contains shape-plots and alert conditions for the following events:
- Bullish Entry into Red Kumo Cloud (Long Signal)
- Bearish Entry into Green Kumo Cloud (Short Signal)
- Edge-To-Edge(E2E) Completion on either type of Cloud (Possible Reversal Signal)
- Red & Green Kumo Cloud Breakout (Long or Continuing Long Signal)
- Kumo Cloud Support Breakdown, Top and Bottom of Cloud (Short Signal)
- Kumo Cloud Potential Bounce and Rejection
- Tenkan/Kijun Crossup/Down
Some things to note:
- Using short timeframes can cause certain alerts to fire many times, such as an E2E detection in a very thin cloud, or short/breakout when price is back-and-fourth at the edge of a cloud.
- The shapes are mostly there to provide a way to backtest when alerts would be triggered. They can be turned off in the settings if they become obnoxious and fill the screen with clutter.
At the time of releasing this script, the strategy version of this is still in development, but should be similarly released relatively soon. This indicator version of the script is intended for alerts, notifications, bot calls, and just general visual analysis of price action.
Thanks,
Bryan

Eclub Multi IndicatorThis multi Indicator includes:
3 Moving Averages
2 Exponential Moving Averages
Bollinger Band
Ichimoku
Parabolic SAR
You can change the colors if you want. Go to setting to enable Ichimoku or SAR or disable others.
The color tolerance is by default zero which results in a very sensitive color change. You can change it to decrease the sensitivity. The value should be the last decimal of the price or the last two decimals of price etc.
If you like this indicator donate some BTC to the following address:
BTC address:
18NSD2xdJyYWoC4CSr4xg1hMk2q5cBbr8T
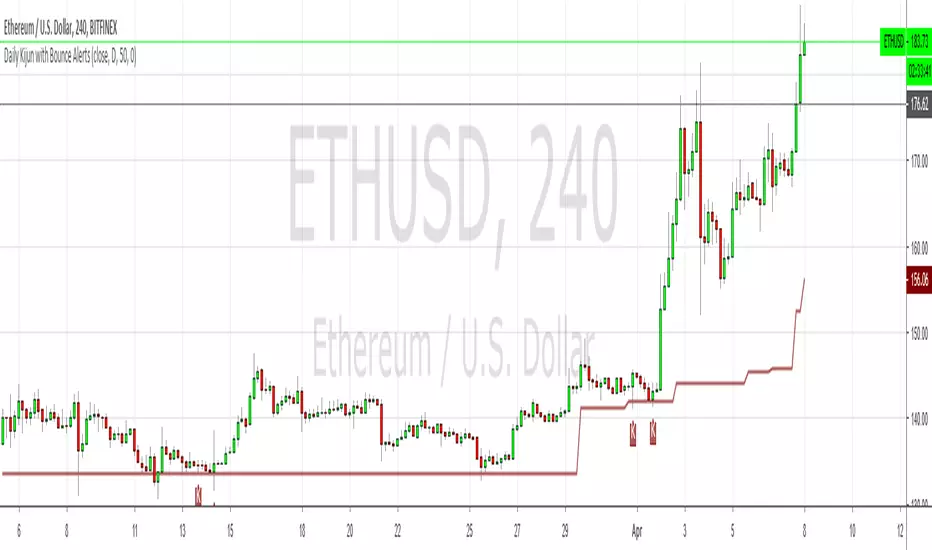
Daily Kijun with Bounce AlertsShows the daily Kijun on all timeframes using a period of 50, which makes it into a dynamic 50% fib of sorts, especially when it's flat. Also shows Kijun bounces labeled with Ks, and allows you to set alerts for bullish, bearish or bi-directional bounces.
It doesn't show any of the other Ichimoku components.
9Week_CandleThe 9-week candle is a candlestick writing method introduced in "Ichimoku Kinko Hyo, Weekly”, which creates positive and negative candles at the closing price of the current week and the opening price of 9 weeks ago to know the current state of the market. By combining the period of the basic numerical value of 9 as one candlestick, it becomes easier to grasp the direction and time relationship.
By default, the upper and lower shadows are displayed, but if you set the shadow color to the same as the background color in the settings, you can display the positive and negative of only the body.
I also created a 3-day candle based on the same method, so please use it as well.
9週足は「一目均衡表週間編」で発表されたローソク足の書き方で、当週の終値と9週前の始値で陽線・陰線を作成し、相場の現在性を知ろうとするものです。9という基本数値の期間を1本のローソク足としてまとめることで方向性と時間関係が把握しやすくなります。
デフォルトでは上ヒゲと下ヒゲが表示されていますが、設定でヒゲの色を背景色と同じにすれば実体のみの陰陽表示が可能です。
同じ考え方で3日足も作成しましたので、併せてご利用ください。

The Rumpy CloudSimilar basic principle to Ichimoku cloud, more sophisticated implementation.
I've exposed cloud width multipliers in the setting in case anyone wants to experiment with them, there are likely to be other widths of significance.
Lots of lines so settings includes easy batch way of altering color settings.
--------------------------------------
If you find it useful please consider a tip/donation :
BTC - 3BMEXEDyWJ58eXUEALYPadbn1wwWKmf6sA
--------------------------------------
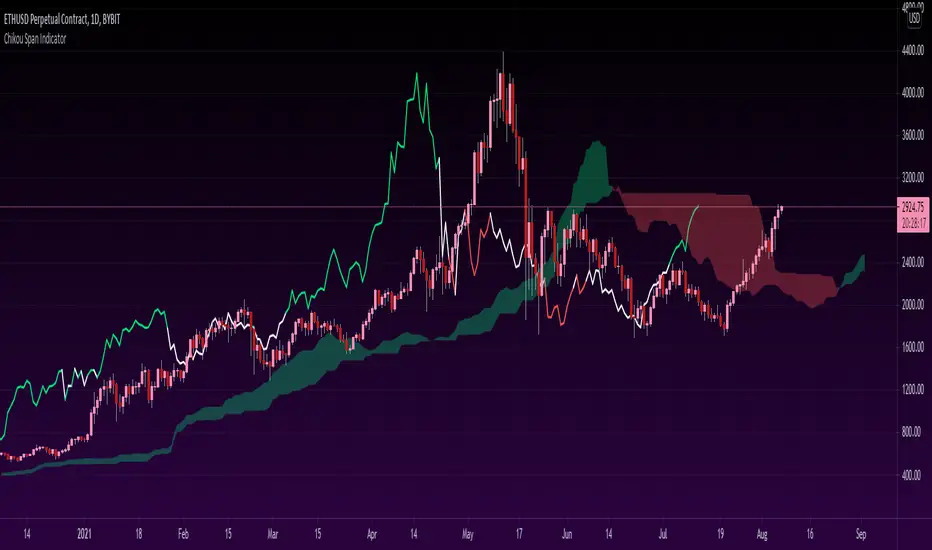
Chikou Span 'Open Space' ColorsThe Ichimoku Clouds strategy has been one of my favorite scripts to work with since I came across it a few months ago, so I thought I'd share one of the automated features I created for the strategy.
For the purpose of this script, I'll only explain the Chikou Span aspect of it since there are plenty of other explanations about Ichimoku Clouds.
The Chikou Span is one of the most useful aspects of the Ichimoku Clouds strategy despite it not being used in most people's strategies. It is calculated by simply taking the current closing value and plotting it backwards 26 bars. The Chikou Span is used to identify large trend moves and trend reversals by what is referred to as 'open space'. This occurs when the Chikou Span is not intersecting any candlestick within 10 bars (if you were to draw a horizontal line from the tip of the Chikou Span, it would not touch any part of a candle within 10 bars).
The purpose of this script is to better identify the Chikou Span reaching 'open space' by coloring the Chikou Span's line:
- Green when it is in upwards open space (bullish trend), and
- Red when it is in downwards open space (bearish trend).
I've also included my personal color scheme for the Ichimoku Clouds strategy as well as inputs to turn on/off every aspect of the strategy.
** Disclaimer: THIS IS NOT TRADING ADVICE. The Chikou Span should not be used on its own to make any trades. When trading with the Ichimoku Cloud strategy, one should utilize all 5 lines of the strategy to make realistic trades. If you'd like to learn more, I'd recommend reading "Trading with Ichimoku Clouds - The Essential Guide to Ichimoku Kinko Hyo Technical Analysis" **
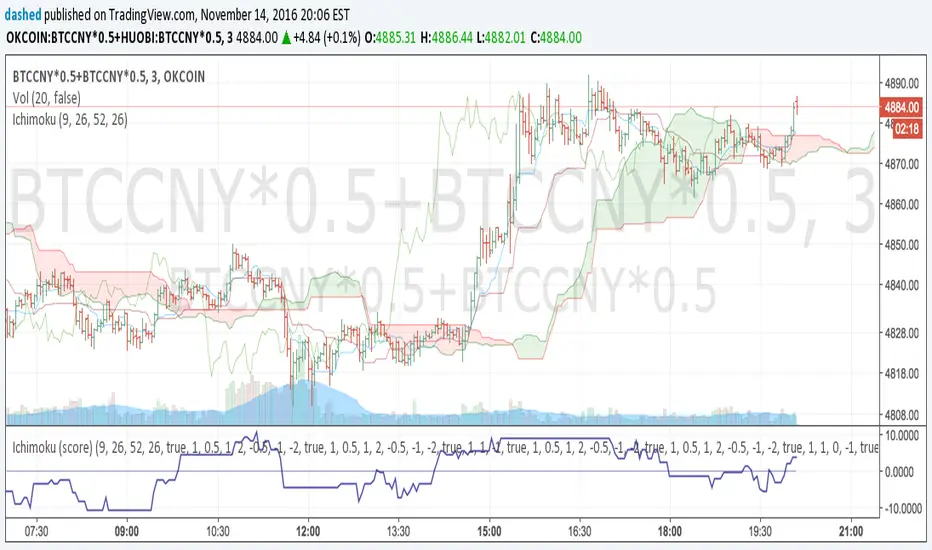
Ichimoku Cloud Signal Score v2.0.0Associate various ichimoku signals with a score. For example, bullish signal => positive score, and bearish signal => negative score. If the total score is above 0, it may indicate a bullish trend. Otherwise, if it is below 0, it may indicate a bearish trend.
Signals from: ichimokutrader.com/signals.html
- Tenkan Sen (turning line) / Kijun Sen Cross (standard line)
- Kijun Sen Cross (price and standard line)
- Kumo breakout
- Senkou Span Cross
- Chikou Span Cross (lag line)
- Lag line relative to cloud (misc. metric)
- Price relative to cloud (misc. metric)
The bearish/bullish scores of all the ichimoku signals + misc. metrics are totalled up and plotted.
-----
Updated script from
LTF Signal with KTS ConfirmationLTF Signal with Ichimoku KTS Confirmation
If you cant to learn more about ichimoku and KTS strategy from Forex Kei trader.
This indicator is based in multiple indicators. I will try to explain how it works.
Input
The only input is the major trend resolution. This is for Ichimoku and KTS trend confirmation
Signals
This script provide sell or buy signals provided on some condition explained just below
Mandatory conditions
Ichimoku KTS : kumo up, SSA or SSB up and kijun up or kumo down, SSA or SSB down and kijun down
RSI or Accumulation/Distribution should be rising or falling
Price should be moving up or down
Price should have break previous 6 candles high or low
2 optional conditions explained below
optional conditions
EMA 9 should have crossed EMA 21
Price should have crossed SMA 50
Stochastic 30 10 10 should have gold cross
Price should have cross vwap
The signals are triggered if all mandatory conditions are filled and at least 2 optional conditions

Ichimoku Cloud Signal ScoreAssociate various ichimoku signals with a score. For example, bullish signal => positive score, and bearish signal => negative score.
Signals from: ichimokutrader.com/signals.html
The scores of all the ichimoku signals are totalled up and plotted.

Core Suite Essentials This script provides institutional-grade, multi-factor market analysis in a unified toolkit. Its true sophistication lies in its ability to reveal the critical interplay—the "dance"—between its core components, offering a profound view of market structure, momentum, and trend health that goes far beyond standard indicators.
Core Differentiators
Reveals the Core Trend "Dance":
The script masterfully visualizes the critical interaction between three foundational elements:
Ichimoku (Tenkan Sen & Kijun Sen): The leading actors defining momentum and equilibrium.
Bollinger Middle Band (BBM): The dynamic stage of support/resistance.
This interaction provides an institutional-grade read on trend integrity:
Strong Trend: A clean, bullish alignment with the Tenkan Sen leading, the Kijun Sen following, and the BBM acting as firm support confirms a powerful, unified move.
Trend Break Warning: The BBM moving between the Tenkan and Kijun signals convergence and compression, a critical alert of weakening momentum and a potential reversal.
Multi-Timeframe Momentum Confirmation:
This core trend analysis is fortified with a layered momentum gauge, providing a robust, institutional-style confirmation system:
Proprietary RSI-Based Bands across weekly, daily, and intraday frames.
Stochastic Channels (Sto12/Sto50) for additional context on price position.
Strategic Filters for Swing & Position Traders:
For higher-timeframe analysis, it delivers essential quantitative tools:
AnEMA29 Angle: Objectively quantifies trend strength and direction.
PDMDR (DMI Ratio): Measures directional dominance to filter low-conviction markets.
Integrated Cross-Asset Intelligence:
Completing the institutional perspective is a Correlation & Hedging Assistant, contextualizing price action against peers and identifying strategic opportunities based on RSI divergences.
Conclusion
This is not a mere collection of indicators; it is a consolidated analytical workstation. It captures the nuanced "dance" of the core trend triad, layers on multi-timeframe momentum confirmation, and provides strategic filters for timing and cross-asset context. This holistic, institutional-grade approach delivers a definitive and actionable market narrative.
ICHIMOKU
@insomniac_vampire

Ant_JJun 5분봉 데이 트레이딩 지표[체험판]Ant_JJun — 5분봉 단기 규칙 기반 데이 트레이딩 프레임워크
(Ichimoku 구조 + 거래량 논리 기반)
이 지표는 BTC 5분봉 환경에서의 단기 트레이딩 의사결정을 돕기 위해 설계되었습니다.
목표는 진입 신호의 빈도를 늘리는 것이 아니라, 추세 구간과 비추세 구간을 구별하여 불필요한 노출을 줄이는 것에 있습니다.
많은 보조지표는 가격이 이미 움직인 뒤에만 유효하게 작동합니다.
이 시스템은 반대로, 방향성이 형성되기 전의 횡보 구간에서 자본 손실을 억제하는 것을 우선합니다. 이를 위해 일목 구조(선행스팬 기반)로 환경을 분류하고, 거래량 비대칭과 캔들 성향을 추가 필터로 사용합니다.
핵심 작동 개념
• 선행스팬 기반 구조 판별로 추세/중립 환경을 분리
• 구조 + 거래량 + 캔들조건이 모두 정렬될 때만 방향 라벨 출력
• 정렬되지 않을 경우 진입 강제가 아닌 ‘대기’ 상태 유지
• 리페인트 없음 / 사후 라벨 생성 없음 / 실시간 판정
사용 환경
• 5분봉 단기 매매
• 데이터 발표 등 변동성 이벤트 인접 구간 관찰 목적
• 자동매매가 아닌 규칙 기반 의사결정 필터링용
이 스크립트는 독자적 방식이 포함되어 있어 공개 배포되지 않습니다.
Ant_JJun — 5-Minute Rule-Based Day-Trading Framework
(Ichimoku structure + volume logic)
This indicator is designed to support short-term decision-making on the BTC 5-minute chart.
Its goal is not to increase signal frequency, but to reduce unnecessary exposure by distinguishing trending from non-trending conditions.
Most indicators only function effectively after price has already moved.
This framework prioritizes capital protection during pre-move consolidation.
It classifies market context using Ichimoku leading spans, and adds volume imbalance and candle behavior as additional filters.
Core operating logic
• Leading-span structure to classify trend vs. neutral zones
• Directional labels only when structure + volume + candle conditions align
• When alignment is absent, the system remains in a waiting state rather than forcing entries
• No repainting / no post-hoc labels / real-time evaluation only
Intended environment
• 5-minute intraday trading
• Particularly around volatility events such as economic data releases
• Used as a rule-based decision filter rather than an automation engine
This script is not publicly distributed due to proprietary methodology.

Ant_JJun 5-Minute Day-Trading IndicatorThis invite-only indicator is designed for short-term BTC and crypto trading, focusing on precision during volatile data-driven markets and capital protection during sideways conditions.
It integrates Ichimoku-based structure mapping with volume asymmetry analysis and proprietary rule-based filters.
Unlike a traditional mashup, this system does not simply overlay multiple indicators.
It uses Ichimoku’s leading spans to classify structural bias (trend vs. neutral), then evaluates directional confirmation through candle displacement and volume pressure imbalance.
Only when both structure and momentum align is a directional label printed.
If the system detects indecision (flat or overlapping clouds with contracting volume), it enters a neutral state to avoid unnecessary exposure.
Key concept:
— Preventing bleed during non-trending phases
— Adaptive response around macro/volatility events (e.g., CPI, PMI)
— Rule-based execution to remove emotional decision-making
Usage notes:
— Intended for 5-minute intraday use
— Long/Short labels appear only on rule-confirmed entries
— No repainting / no backfill logic
— Analytical use only — not investment advice

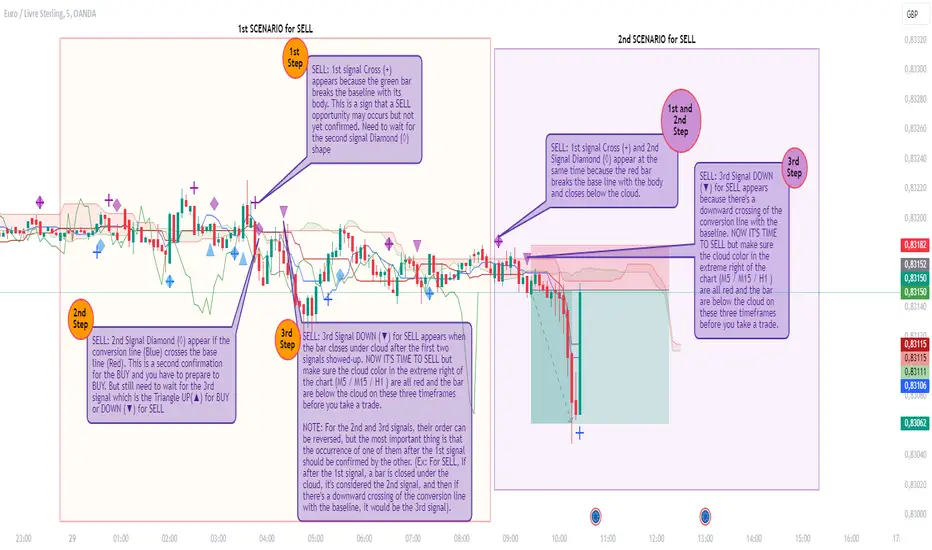
Rado Ichi Alerts v1.2This indicator is based on the “Ichimuko Cloud” indicator, but in addition, it can display signals in graphs and can also send you an alert for each signal.
Indeed, this script uses the open-source Ichimoku Cloud standard. However, the additional features I've implemented, such as the display of different signals (e. g : Cross (+) “First signal” to warn about BUY or SELL opportunities that could arise, Diamond (◊) “Second signal” to warn about BUY or SELL preparation and Triangle UP(▲) or DOWN (▼) “Third and last signal” for BUY or SELL NOW action) as well as the ability to configure ALERTS related to these signals are not included in the standard Ichimoku Cloud script and are also not reproduced by the Ichimuko Cloud script.
The logic behind these signals is based on a customized Ichimoku strategy that we've been able to develop over a long period of back-testing.
What makes this script unique and original is its capacity to display signals and at the same time send alerts for each signal. This can help traders to not sit in front of their screens all the time and only take action when the third signal appears with an alert. Then, traders visually check whether the signal is valid in relation to the strategy before placing a trade.
This is the reason why I put my script in Closed-source.
Types of Signals and Alerts: (See also the chart for more explanation)
1) Cross (+): This means that an opportunity arises when it appears (BUY or SELL). The alert associated with this signal is the “1st Alert”, which you can view and configure in the alerts dialog box during its creation. Default message for this alert: “Ichi_Opportunity_(BUY or SELL) ”.
2) Diamond (◊): This means you should get ready to (BUY or SELL). Normally, this signal appears after the Cross (+) but it can appear at the same time as the Cross (+).The alert associated with this signal is the “2nd Alert” which you can see and configure in the alerts dialog box during its creation. Default message for this alert: “Ichi_Prepare_to_(BUY or SELL) ”.
3) Rectangle Up or Down (▲ / ▼): This means you should (BUY or SELL) now. Normally, this signal appears after the Diamond (◊) but it can appear at the same time as the Diamond (◊). The alert associated with this signal is the “3rd Alert”, which you can view and configure in the alerts dialog box during its creation. Default message for this alert: “Ichi_(BUY or SELL)_NOW ”.
Alerts can be configured for BUY or SELL only, depending on your needs (and the bias you've chosen). Alert messages can also be customized.
You can also choose the alerts that interest you, (e.g. 2nd Alert only so you can prepare, or 3rd Alert only if you only need to be alerted when you should take action to buy or sell). But you can combine all three alerts on a single chart.
CORRECTIVE :
- Correction to display missing signals (which are not displayed sometimes) on each step of the strategy.
IMPROVEMENTS :
- A new function has been added to the indicator dialog to change the reset time for the first two signals if they are not triggered within 10 bars (default value) after their last execution. This feature is necessary to better organize (visualize) the display of signals.
DIY Custom Strategy Builder [ZP] - v1DISCLAIMER:
This indicator as my first ever Tradingview indicator, has been developed for my personal trading analysis, consolidating various powerful indicators that I frequently use. A number of the embedded indicators within this tool are the creations of esteemed Pine Script developers from the TradingView community. In recognition of their contributions, the names of these developers will be prominently displayed alongside the respective indicator names. My selection of these indicators is rooted in my own experience and reflects those that have proven most effective for me. Please note that the past performance of any trading system or methodology is not necessarily indicative of future results. Always conduct your own research and due diligence before using any indicator or tool.
===========================================================================
Introducing the ultimate all-in-one DIY strategy builder indicator, With over 30+ famous indicators (some with custom configuration/settings) indicators included, you now have the power to mix and match to create your own custom strategy for shorter time or longer time frames depending on your trading style. Say goodbye to cluttered charts and manual/visual confirmation of multiple indicators and hello to endless possibilities with this indicator.
What it does
==================
This indicator basically help users to do 2 things:
1) Strategy Builder
With more than 30 indicators available, you can select any combination you prefer and the indicator will generate buy and sell signals accordingly. Alternative to the time-consuming process of manually confirming signals from multiple indicators! This indicator streamlines the process by automatically printing buy and sell signals based on your chosen combination of indicators. No more staring at the screen for hours on end, simply set up alerts and let the indicator do the work for you.
Available indicators that you can choose to build your strategy, are coded to seamlessly print the BUY and SELL signal upon confirmation of all selected indicators:
EMA Filter
2 EMA Cross
3 EMA Cross
Range Filter (Guikroth)
SuperTrend
Ichimoku Cloud
SuperIchi (LuxAlgo)
B-Xtrender (QuantTherapy)
Bull Bear Power Trend (Dreadblitz)
VWAP
BB Oscillator (Veryfid)
Trend Meter (Lij_MC)
Chandelier Exit (Everget)
CCI
Awesome Oscillator
DMI ( Adx )
Parabolic SAR
Waddah Attar Explosion (Shayankm)
Volatility Oscillator (Veryfid)
Damiani Volatility ( DV ) (RichardoSantos)
Stochastic
RSI
MACD
SSL Channel (ErwinBeckers)
Schaff Trend Cycle ( STC ) (LazyBear)
Chaikin Money Flow
Volume
Wolfpack Id (Darrellfischer1)
QQE Mod (Mihkhel00)
Hull Suite (Insilico)
Vortex Indicator
2) Overlay Indicators
Access the full potential of this indicator using the SWITCH BOARD section! Here, you have the ability to turn on and plot up to 14 of the included indicators on your chart. Simply select from the following options:
EMA
Support/Resistance (HeWhoMustNotBeNamed)
Supply/ Demand Zone ( SMC ) (Pmgjiv)
Parabolic SAR
Ichimoku Cloud
Superichi (LuxAlgo)
SuperTrend
Range Filter (Guikroth)
Average True Range (ATR)
VWAP
Schaff Trend Cycle ( STC ) (LazyBear)
PVSRA (TradersReality)
Liquidity Zone/Vector Candle Zone (TradersReality)
Market Sessions (Aurocks_AIF)
How it does it
==================
To explain how this indictor generate signal or does what it does, its best to put in points.
I have coded the strategy for each of the indicator, for some of the indicator you will see the option to choose strategy variation, these variants are either famous among the traders or its the ones I found more accurate based on my usage. By coding the strategy I will have the BUY and SELL signal generated by each indicator in the backend.
Next, the indicator will identify your selected LEADING INDICATOR and the CONFIRMATION INDICATOR(s).
On each candle close, the indicator will check if the selected LEADING INDICATOR generates signal (long or short).
Once the leading indicator generates the signal, then the indicator will scan each of the selected CONFIRMATION INDICATORS on candle close to check if any of the CONFIRMATION INDICATOR generated signal (long or short).
Until this point, all the process is happening in the backend, the indicator will print LONG or SHORT signal on the chart ONLY if LEADING INDICATOR and all the selected CONFIRMATION INDICATORS generates signal on candle close. example for long signal, the LEADING INDICATOR and all selected CONFIRMATION INDICATORS must print long signal.
The dashboard table will show your selected LEADING and CONFIRMATION INDICATORS and if LEADING or the CONFIRMATION INDICATORS have generated signal. Signal generated by LEADING and CONFIRMATION indicator whether long or short, is indicated by tick icon ✔. and if any of the selected CONFIRMATION or LEADING indicator does not generate signal on candle close, it will be indicated with cross symbol ✖.
how to use this indicator
==============================
Using the indicator is pretty simple, but it depends on your goal, whether you want to use it for overlaying the available indicators or using it to build your strategy or for both.
To use for Building your strategy: Select your LEADING INDICATOR, and then select your CONFIRMATION INDICATOR(s). if on candle close all the indicators generate signal, then this indicator will print SHORT or LONG signal on the chart for your entry. There are plenty of indicators you can use to build your strategy, some indicators are best for longer time frame setups while others are responsive indicators that are best for short time frame.
To use for overlaying the indicators: Open the setting of this indicator and scroll to the SWITCHBOARD section, from there you can select which indicator you want to plot on the chart.
For each of the listed indicators, you have the flexibility to customize the settings and configurations to suit your preferences. simply open indicator setting and scroll down, you will find configuration for each of the indicators used.
I will also release the Strategy Backtester for this indicator soon.

Trend IndicatorThis indicator has different features:
1. Ichimoku = this indicator can plot Ichimoku calculated both in the common formula and with the volume average, you can choose the calculator method for each line.
2. Channel and Bands = this mode allows the user to choose from channel and band, "channel" shows the Keltner channel, and "band" shows the Bollinger bands. Both the indicators are calculated including the volume in the formula of the average midpoint.
3. Color candle = this function allows the user to see two different colors of candles on the chart, the positive color occurs when both the long-term average and the short team average of price calculated using the volume is above the two averages calculated without the volume. This function is great to analyze the volume pressure, useful to identify trend continuation and exhaustion.
4. Extreme reversal zones = this is a version of the Keltner channels calculated over a high number of candles and with high deviation, to identify the potential zones of reversal.
Note that in the "Ichimoku" indicator, the backline is the T.R.A.M.A. indicator, created and published open source by Lux Algo, which I thank for the script.

Regression Channel Trend DetectionThis is a regression channel that uses ichimoku to determine trend. The sensitivity is customizable. The centerline will change color according to the trend detected by ichimoku, and each line can act as support/resistance. The bands of the channel also change colors according to how far price is getting away from them. If you notice in this example, the lower band is turning orange when the price is getting too far away from it, suggesting that it may have risen too fast and too soon. This is still in testing so feel free to comment with any suggestions or fixes.
EMA ICHI BB [Rogulabo]3 indicators in 1.
Included Indicators are:
- EMA 8,13,21,55,100,200,450
- Ichimoku
- Bollinger Band
These can be used to determine changes in trends when:
- EMA's collide, trajectories shift, or certain levels are reached.
- Ichimoku cloud is above or below the candles.
- Bollinger Band's width changes, or range is broken.
Reasons for 3 in 1 assembly:
This indicator is intended to be used by students, and followers of Dan Takahashi
(a prominent educator of investing in Japan who is also a user of TradingView) .
Those who wants to use and learn with the same setup as Dan, would greatly benefit from this since,
the complex setting up process which can be a pain for beginners can be skipped with a simple click.
Every stylistic choice of color and placement were made to make it similar to the chart used by Dan.
Simple customizations are available such as:
- Changing color
- Changing the values
- Hide/show controls
Notes:
This is intended to be used alongside “STOCH RSI ” for the complete the setup.
Any questions, please refer to:
@rogulabo
==
高橋ダンさんが使用されてるチャートと同様のセットアップの為にご活用ください。
複数のインジケータをグループにしておりますので、無料版を使われてる方は効率よく使っていただけると思います。
また、“STOCH RSI ”どいうタイトルのインジケータも同時に公開しておりますので、セットアップを完成させたい方はこちらもご活用ください。
以下のインジケータを含みます。
・EMA線
・一目均等表
・ボリンジャーバンド
カスタマイズされたい方はご自由に値を変更ください。
ご質問は @rogulabo までよろしくお願いいたします。
