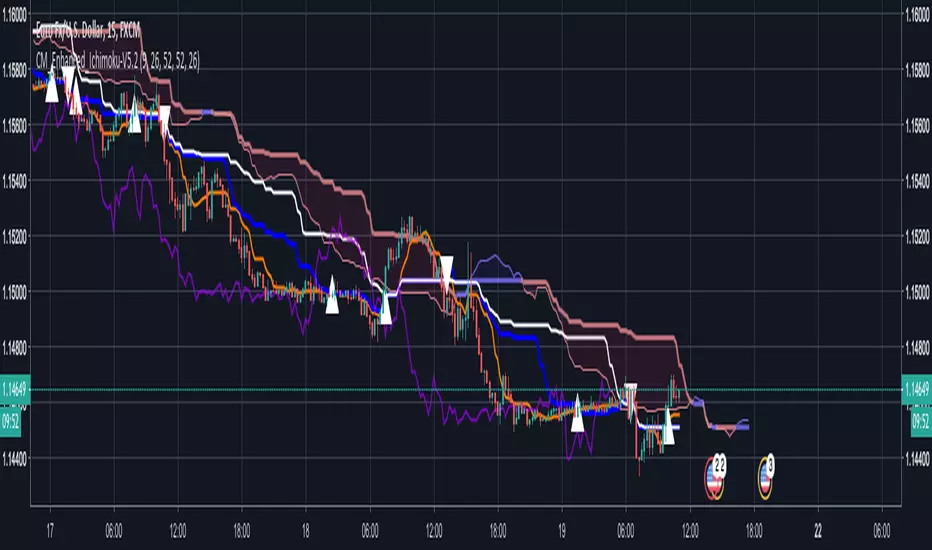
Sto RSI and kijun-sen line to determine and follow the trend This script uses 25-75 treshold of stochastic RSI with the help of kijun-sen as confirmation, to find entry points to any trend either newly developed or an established one. I just realized it on the 1 hour SPX chart. Sure it can be used on other symbols. Crossing above/below 25/75 line of sto RSI is considered as buy/sell signal. Signals are evaluated whether price be above/below kijun-sen line. If a sell signal below kijun-sen is generated it is a continuation signal for downtrend, otherwise it is a countertrend signal (maybe a signal for a new downtrend). A countertrend signal must be evaluated carefully and only accepted in the right side of kijun-sen. e.g entering a sell signal generated above kijun-sen should be accepted only below the kijun-sen, vice-versa.
Cari dalam skrip untuk "ichimoku"

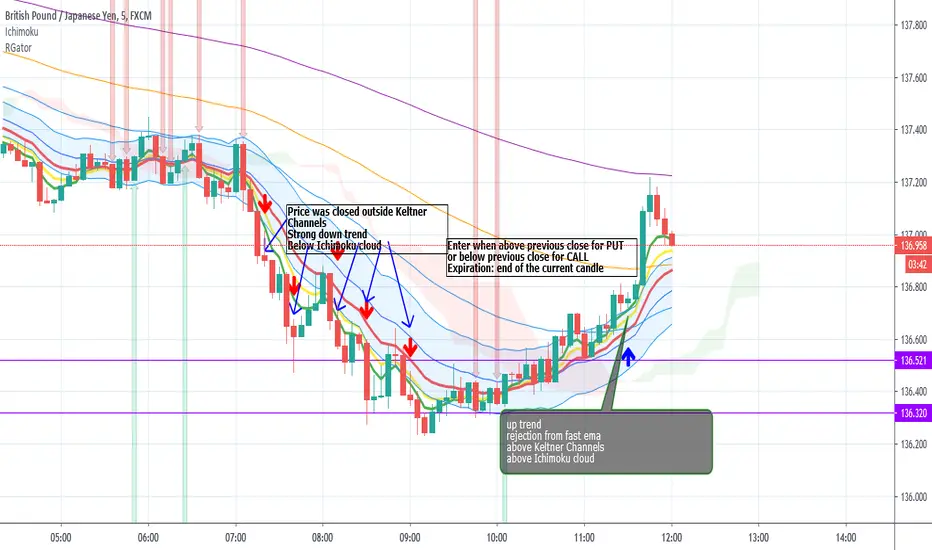
Rainbow Gator - EMAs strategy for Binary OptionThis is an EMAs indicator for Binary Option or Scalping Alert designed for lower Time Frame Trend (2-5minutes).
Although you will find it a useful tool for higher time frames as well.
The Alerts are generated when the fast EMA cross over/under other slower EMAs, you then have the chance to wait for the pullback during the new trend then enter for trend momentum (follow the trend).
Beware when the trend is close to EMA200.
You must draw your SRT (Support-Resistance-Trendline) before looking for setups.
Good luck.
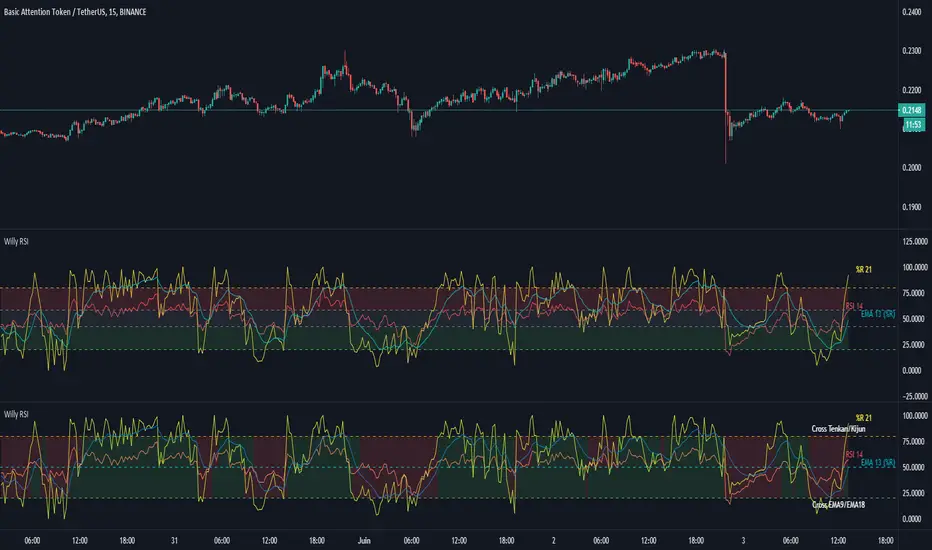
Williams %R + RSI + EMA - [Silver-Wong]
Williams %R + EMA + RSI
Un seul indicateur avec :
- William %R
- RSI
- EMA
- Une ligne médiane
- Les étiquettes des indicateurs
Odin's Kraken (TK Cross Strategy)A simple, yet profitable, trend following system based on 1 hour TK Crosses and ADX.
Works best on ETH/BTC, but is also profitable on other large-cap altcoin BTC pairs (ADA/BTC, EOS/BTC, and TRX/BTC ).
I'm still just getting started in the algo trading world, but if you have any questions I am more than happy to answer them in the comment section here or on Twitter (@pascaltmn).
Cheers.


Filtered Waves [NXT2017] #Linda Raschke #basics on Arthur MerrilHI BIG PLAYERS,
this script I wrote for an enquiry of a tradingview-user. It should represent the Filtered Waves idea from Arthur Merril and used by Linda Raschke.
It's similar like a visualization of Elliott Waves.
On YouTube title "MTA UK Chapter Presentation with Linda Raschke" between 34-36 minutes Linda Raschke shows the rules for her Filterd Waves.
Any questions? Ask me!
King regards
NXT2017
========
TO MY PERSON
I'm the second winner of the official German Forex Trading Competition in 2018.
Look here to the ranks:
deutsche-trading-meisterschaften.de
I speak german, english and russian.
My strength in trading are Wolfe Wave pattern.

Bollinger bands/Lagging span crossHello my dear ambitious traders
I'm working hard this week to publish some great indicators this week and open sourced. Hope you'll enjoy, learn and use them.
This will be my greatest reward but comments showing appreciation are also very welcomed (actually likes too) :)
For today, I'll share a simple indicator but it's coming along with some insightful knowledge ^^
Anyway, I'm not here to ask you to this but to share a very cool indicator I made a few months ago and wanted to share for FREE with the community today
The indicator is related to this educational post : What-a-Bollinger-Bands-Lagging-span-cross-can-tell-us/
This trading technique was invented by Robbytrade, a famous french trader twitter.com
I wanted to have those visual signals on the chart so I coded it.
The advantage of being a developer is that you can litteraly code what you miss and get your life better in the process. The one that will find a way to code a new form of money will be rich... wait.... that guy is called Satoshi Nakamoto...
That's all for me today my friends
PS
Trying to update the Trade Manager shared yesterday with some cool features. More to come in the upcoming days
Enjoy
Dave

[astropark] Power Tools Overlay//******************************************************************************
// Power Tools Overlay
// Inner Version 1.2.1 13/12/2018
// Developer: iDelphi
// Developer: astropark (Ichimoku Cloud), SMA EMA & Cross tools
//------------------------------------------------------------------------------
// 21/11/2018 Added EMA SMA WMA
// 21/11/2018 Added SMA-EMA EMA-WMA WMA-SMA (Thanks to mariobros1 for the idea of the Simultaneous MA)
// 21/11/2018 Added Bollinger Bands
// 21/11/2018 Added Ichimoku Cloud (Thanks to astropark for all the code of the Ichimoku Cloud)
// 23/11/2018 Show all the indicator as default
// 23/11/2018 Added a cross when single Moving Averages crossing (Thanks to astropark for the idea)
// 24/11/2018 Descriptions Fix
// 24/11/2018 Added Option to enable/disable all Moving Averages
// 10/12/2018 Added EMAs and Crosses
// 13/12/2018 indicator number fixes
//******************************************************************************

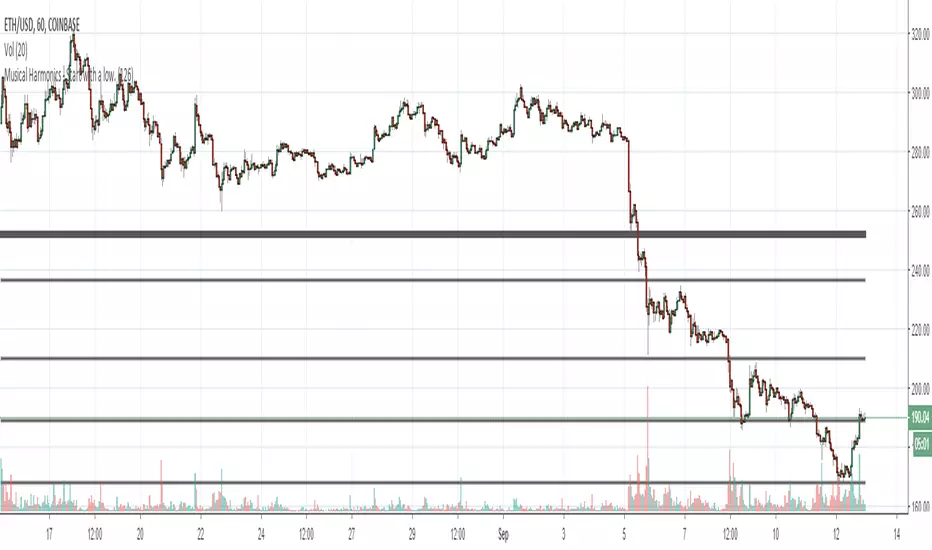
Musical Harmonics - Start with a low.Octaves double from one octave to another, so start with octaves beginning with the number one, for example:
1 doubled is 2, 2 doubled is 4, 4 double is 8 and then we go on to this sequence:
1,2,4,8,16,32,64,126,256,512,1024,2048,etc,etc
Find one of the numbers near a range, so for example on this chart Ethereum was trading at 190.31. That price is in between the octaves of 126 and 256. The number I use as the low for the indicator is 126.
Working on updating with labels and such

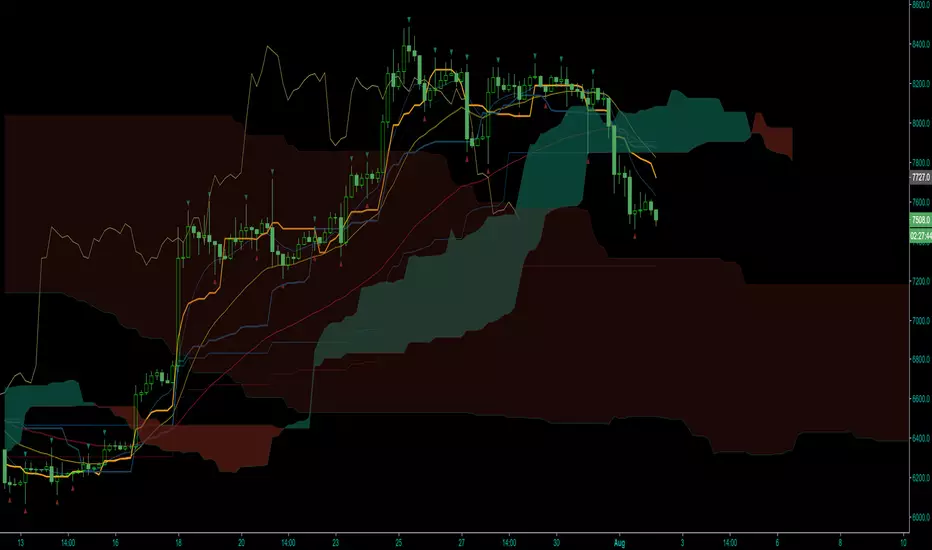
2xIchimoku Cloud + 4xEMA + Williams FractalCopy+Pasted/edited the code from :
Moku
www.tradingview.com
EMA
www.tradingview.com
Fractal
www.tradingview.com


vdub Atlasvdub Atlas, Multiple strategy combined indicator
ichmoku,
inside bollinger bands,
Multiple ma's,
Strength indicator MA's
Hull ma,
vdub binaryPro,
Session background colours.
Switch out any indicator you don't want.

saodisengxiaoyu-lianghua-2.1- This indicator is a modular, signal-building framework designed to generate long and short signals by combining a chosen leading indicator with selectable confirmation filters. It runs on Pine Script version 5, overlays directly on price, and is built to be highly configurable so traders can tailor the signal logic to their market, timeframe, and trading style. It includes a dashboard to visualize which conditions are active and whether they validate a signal, and it outputs clear buy/sell labels and alert conditions so you can automate or monitor trades with confidence.
Core Design
- Leading Indicator: You choose one primary signal generator from a broad list (for example, Range Filter, Supertrend, MACD, RSI, Ichimoku, and many others). This serves as the anchor of the system and determines when a preliminary long or short setup exists.
- Confirmation Filters: You can enable additional filters that validate the leading signal before it becomes actionable. Each “respect…” input toggles a filter on or off. These filters include popular tools like EMA, 2/3 EMA crosses, RQK (Nadaraya Watson), ADX/DMI, Bollinger-based oscillators, MACD variations, QQE, Hull, VWAP, Choppiness Index, Damiani Volatility, and more.
- Signal Expiry: To avoid waiting indefinitely for confirmations, the indicator counts how many consecutive bars the leading condition holds. If confirmations do not align within a defined number of bars, the setup expires. This controls latency and helps reduce late or stale entries.
- Alternating Signals: An optional mode enforces alternation (long must follow short and vice versa), helping avoid repeated entries in the same direction without a meaningful reset.
- Aggregation Logic: The final long/short conditions are formed by combining the leading condition with all selected confirmation filters through logical conjunction. Only if all enabled filters validate the signal (within expiry constraints) does the indicator consider it a confirmed long or short.
- Visualization and Alerts: The script plots buy/sell labels at signal points, provides alert conditions for automation, and displays a compact dashboard summarizing the leading indicator’s status and each confirmation’s pass/fail result using checkmarks.
Leading Indicator Options
- The indicator includes a very large menu of leading tools, each with its own logic to determine uptrend or downtrend impulses. Highlights include:
- Range Filter: Uses a dynamic centerline and bands computed via conditional EMA/SMA and range sizing to define directional movement. It can operate in a default mode or an alternative “DW” mode.
- Rational Quadratic Kernel (RQK): Applies a kernel smoothing model (Nadaraya Watson) to detect uptrends and downtrends with a focus on noise reduction.
- Supertrend, Half Trend, SSL Channel: Classic trend-following tools that derive direction from ATR-based bands or moving average channels.
- Ichimoku Cloud and SuperIchi: Multi-component systems validating trend via cloud position, conversion/base line relationships, projected cloud, and lagging span.
- TSI (True Strength Index), DPO (Detrended Price Oscillator), AO (Awesome Oscillator), MACD, STC (Schaff Trend Cycle), QQE Mod: Momentum and cycle tools that parse direction from crossovers, zero-line behavior, and momentum shifts.
- Donchian Trend Ribbon, Chandelier Exit: Trend and exit tools that can validate breakouts or sustained trend strength.
- ADX/DMI: Measures trend strength and directional movement via +DI/-DI relationships and minimum ADX thresholds.
- RSI and Stochastic: Use crossovers, level exits, or threshold filters to gate entries based on overbought/oversold dynamics or relative strength trends.
- Vortex, Chaikin Money Flow, VWAP, Bull Bear Power, ROC, Wolfpack Id, Hull Suite: A diverse set of directional, momentum, and volume-based indicators to suit different markets and styles.
- Trendline Breakout and Range Detector: Price-behavior filters that confirm signals during breakouts or within defined ranges.
Confirmation Filters
- Each filter is optional. When enabled, it must validate the leading condition for a signal to pass. Examples:
- EMA Filter: Requires price to be above a specified EMA for longs and below for shorts, filtering signals that contradict broader trend or baseline levels.
- 2 EMA Cross and 3 EMA Cross: Enforce moving average cross conditions (fast above slow for long, the reverse for short) or a three-line stacking logic for more stringent trend alignment.
- RQK, Supertrend, Half Trend, Donchian, QQE, Hull, MACD (crossover vs. zero-line), AO (zero line or AC momentum variants), SSL: Each adds its characteristic validation pattern.
- RSI family (MA cross, exits OB/OS zones, threshold levels) plus RSI MA direction and RSI/RSI MA limits: Multiple ways to constrain signals via relative strength behavior and trajectories.
- Choppiness Index and Damiani Volatility: Prevent entries during ranging conditions or insufficient volatility; choppiness thresholds and volatility states gate the trade.
- VWAP, Volume modes (above MA, simple up/down, delta), Chaikin Money Flow: Volume and flow conditions that ensure signals happen in supportive liquidity or accumulation/distribution contexts.
- ADX/DMI thresholds: Demand a minimum trend strength and directional DI alignment to reduce whipsaw trades.
- Trendline Breakout and Range Detector: Confirm that the price is breaking structure or remains within active range consistent with the leading setup.
- By combining several filters you can create strict, conservative entries or looser setups depending on your goals.
Range Filter Engine
- A core building block, the Range Filter uses conditional EMA and SMA functions to compute adaptive bands around a dynamic centerline. It supports two types:
- Type 1: The centerline updates when price exceeds the band thresholds; bands define acceptable drift ranges.
- Type 2: Uses quantized steps (via floor operations) relative to the previous centerline to handle larger moves in discrete increments.
- The engine offers smoothing for range values using a secondary EMA and can switch between raw and averaged outputs. Its hi/lo bands and centerline compose a corridor that defines directional movement and potential breakout confirmation.
Signal Construction
- The script computes:
- leadinglongcond and leadingshortcond : The primary directional signals from the chosen leading indicator.
- longCond and shortCond : Final signals formed by combining the leading conditions with all enabled confirmations. Each confirmation contributes a boolean gate. If a filter is disabled, it contributes a neutral pass-through, keeping the logic intact without enforcing that condition.
- Expiry Logic: The code counts consecutive bars where the leading condition remains true. If confirmations do not line up within the user-defined “Signal Expiry Candle Count,” the setup is abandoned and the signal does not trigger.
- Alternation: An optional state ensures that long and short signals alternate. This can reduce repeated entries in the same direction without a clear reset.
- Finally, longCondition and shortCondition represent the actionable signals after expiry and alternation logic. These drive the label plotting and alert conditions.
Visualization
- Buy and Sell Labels: When longCondition or shortCondition confirm, the script plots annotated labels directly on the chart, making entries easy to see at a glance. The labels use color coding and clear text tags (“long” vs. “short”).
- Dashboard: A table summarizes the status of the leading indicator and all confirmations. Each row shows the indicator label and whether it passed (✔️) or failed (❌) on the current bar. This intensely practical UI helps you diagnose why a signal did or did not trigger, empowering faster strategy iteration and parameter tuning.
- Failed Confirmation Markers: If a setup expires (count exceeds the limit) and confirmations failed to align, the script can mark the chart with a small label and provide a tooltip listing which confirmations did not pass. It’s a helpful audit trail to understand missed trades or prevent “chasing” invalid signals.
- Data Window Values: The script outputs signal states to the data window, which can be useful for debugging or building composite conditions in multi-indicator templates.
Inputs and Parameters
- You control the indicator from a comprehensive input panel:
- Setup: Signal expiry count, whether to enforce alternating signals, and whether to display labels and the dashboard (including position and size).
- Leading Indicator: Choose the primary signal generator from the large list.
- Per-Filter Toggles: For each confirmation, a respect... toggle enables or disables it. Many include sub-options (like MACD type, Stochastic mode, RSI mode, ADX variants, thresholds for choppiness/volatility, etc.) to fine-tune behavior.
- Range Filter Settings: Choose type and behavior; select default vs. DW mode and smoothing. The underlying functions adjust band sizes using ATR, average change, standard deviation, or user-defined scales.
- Because everything is customizable, you can adapt the indicator to different assets, volatility regimes, and timeframes.
Alerts and Automation
- The script defines alert conditions tied to longCondition and shortCondition . You can set these alerts in your chart to trigger notifications or webhook calls for automated execution in external bots. The alert text is simple, and you can configure your own message template when creating alerts in the chart, including JSON payloads for algorithmic integration.
Typical Workflow
- Select a Leading Indicator aligned with your style. For trend following, Supertrend or SSL may be appropriate; for momentum, MACD or TSI; for range/trend-change detection, Range Filter, RQK, or Donchian.
- Add a few key Confirmation Filters that complement the leading signal. For example:
- Pair Supertrend with EMA Filter and RSI MA Direction to ensure trend alignment and positive momentum.
- Combine MACD Crossover with ADX/DMI and Volume Above MA to avoid signals in low-trend or low-liquidity conditions.
- Use RQK with Choppiness Index and Damiani Volatility to only act when the market is trending and volatile enough.
- Set a sensible Signal Expiry Candle Count. Shorter expiry keeps entries timely and reduces lag; longer expiry captures setups that mature slowly.
- Observe the Dashboard during live markets to see which filters pass or fail, then iterate. Tighten or loosen thresholds and filter combinations as needed.
- For automation, turn on alerts for the final conditions and use webhook payloads to notify your trading robot.
Strengths and Practical Notes
- Flexibility: The indicator is a toolkit rather than a single rigid model. It lets you test different combinations rapidly and visualize outcomes immediately.
- Clarity: Labels, dashboard, and failed-confirmation markers make it easy to audit behavior and refine settings without digging into code.
- Robustness: The expiry and alternation options add discipline, avoiding the temptation to enter late or repeatedly in one direction without a reset.
- Modular Design: The logical gates (“respect…”) make the behavior transparent: if a filter is on, it must pass; if it’s off, the signal ignores it. This keeps reasoning clean.
- Avoiding Overfitting: Because you can stack many filters, it’s tempting to over-constrain signals. Start simple (one leading indicator and one or two confirmations). Add complexity only if it demonstrably improves your edge across varied market regimes.
Limitations and Recommendations
- No single configuration is universally optimal. Markets change; tune filters for the instrument and timeframe you trade and revisit settings periodically.
- Trend filters can underperform in choppy markets; likewise, momentum filters can false-trigger in quiet periods. Consider using Choppiness Index or Damiani to gate signals by regime.
- Use expiry wisely. Too short may miss good setups that need a few bars to confirm; too long may cause late entries. Balance responsiveness and accuracy.
- Always consider risk management externally (position sizing, stops, profit targets). The indicator focuses on signal quality; combining it with robust trade management methods will improve results.
Example Configurations
- Trend-Following Setup:
- Leading: Supertrend uptrend for longs and downtrend for shorts.
- Confirmations: EMA Filter (price above 200 EMA for long, below for short), ADX/DMI (trend strength above threshold with +DI/-DI alignment), Volume Above MA.
- Expiry: 3–4 bars to keep entries timely.
- Result: Strong bias toward sustained moves while avoiding weak trends and thin liquidity.
- Mean-Reversion to Momentum Crossover:
- Leading: RSI exits from OB/OS zones (e.g., RSI leaves oversold for long and leaves overbought for short).
- Confirmations: 2 EMA Cross (fast crossing slow in the same direction), MACD zero-line behavior for added momentum validation.
- Expiry: 2–3 bars for responsive re-entry.
- Result: Captures momentum transitions after short-term extremes, with extra confirmation to reduce head-fakes.
- Range Breakout Focus:
- Leading: Range Filter Type 2 or Donchian Trend Ribbon to detect breakouts.
- Confirmations: Damiani Volatility (avoid low-volatility false breaks), Choppiness Index (prefer trend-ready states), ROC positive/negative threshold.
- Expiry: 1–3 bars to act on breakout windows.
- Result: Better alignment to breakout dynamics, gating trades by volatility and regime.
Conclusion
- This indicator is a comprehensive, configurable framework that merges a chosen leading signal with an array of corroborating filters, disciplined expiry handling, and intuitive visualization. It’s designed to help you build high-quality entry signals tailored to your approach, whether that’s trend-following, breakout trading, momentum capturing, or a hybrid. By surfacing pass/fail states in a dashboard and allowing alert-based automation, it bridges the gap between discretionary analysis and systematic execution. With sensible parameter tuning and thoughtful filter selection, it can serve as a robust backbone for signal generation across diverse instruments and timeframes.

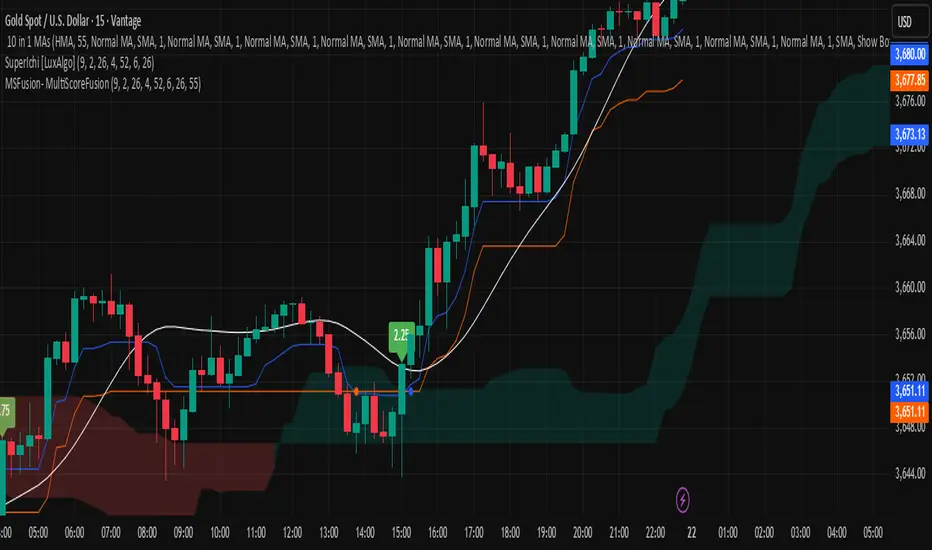
MSFusion- MultiScoreFusionThis Pine Script strategy, MSFusion - MultiScoreFusion, combines Ichimoku components and Hull Moving Average (HMA) signals to generate a composite score for each bar.
It evaluates several conditions—such as price crossing above HMA55, Tenkan and Kijun lines, and price position relative to the Ichimoku cloud—and assigns scores to each.
The script displays a label with the total score and a tooltip listing the contributing conditions when a strong bullish signal is detected. This approach helps traders quickly assess market momentum and trend strength using multiple technical criteria.
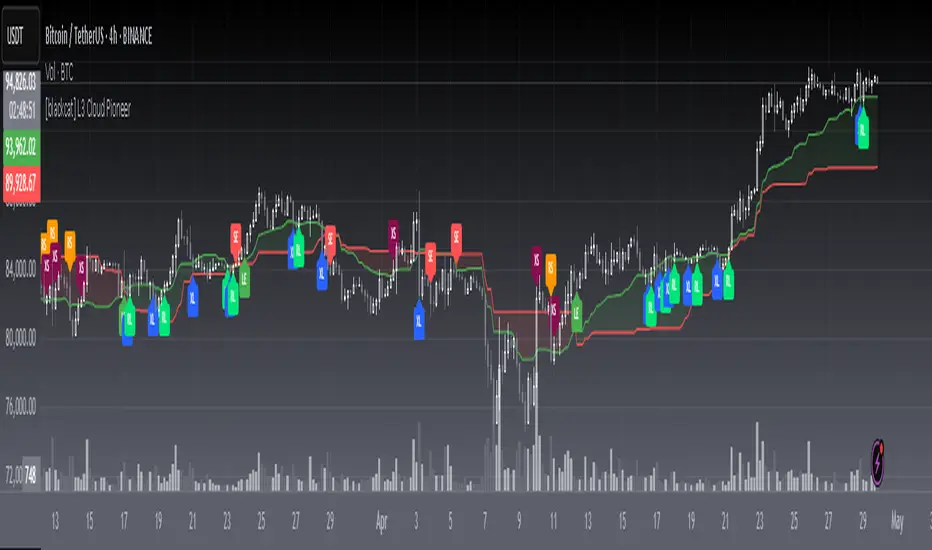
[blackcat] L3 Cloud PioneerOVERVIEW
The L3 Cloud Pioneer indicator combines elements of the Ichimoku Kinko Hyo system with Donchian Channels to provide a robust trend-following tool. This enhanced version includes detailed trade signal labels and alerts, helping traders identify potential entry and exit points more clearly. By plotting dynamic cloud areas and providing visual cues, this indicator aids in making informed trading decisions 📊📉↗️.
FEATURES
Calculates key Ichimoku components using custom Donchian Channel logic:
Conversion Line (based on highest/highest values over specified periods).
Base Line.
Leading Spans.
Lagging Span 2.
Plots a dynamic cloud area between Leading Span 1 and Leading Span 2, colored based on trend direction 🎨.
Identifies trend changes and provides clear entry/exit signals:
LE: Long Entry (when trend turns bullish).
SE: Short Entry (when trend turns bearish).
XL: Exit Long (price crosses below Leading Span 1 during an uptrend).
RL: Re-enter Long (price crosses above Leading Span 1 during an uptrend).
XS: Exit Short (price crosses above Leading Span 1 during a downtrend).
RS: Re-enter Short (price crosses below Leading Span 1 during a downtrend).
Displays corresponding labels on the chart for easy visualization, complete with tooltips for additional information 🏷️.
Generates alerts for each signal event to keep users informed about potential trades 🔔.
Supports customizable input parameters for conversion line, base line, and lagging span periods ⚙️.
HOW TO USE
Add the indicator to your TradingView chart by selecting it from the indicators list.
Adjust the input parameters (Conversion Line Periods, Base Line Periods, Lagging Span 2 Periods) to fit your preferences.
Observe the plotted cloud and labels for trend direction and potential trade opportunities.
Set up alerts based on the generated signals to receive notifications when conditions are met 📲.
Combine this indicator with other tools for confirmation before making trading decisions.
DETAILED SIGNAL LOGIC
Trend Determination:
The script determines the trend direction by comparing leading_line1 and leading_line2.
If leading_line1 is above leading_line2, the trend is considered bullish (isBullish). Otherwise, it's bearish (isBearish).
Signal Conditions:
Long Entry (LE): Triggered when the trend turns bullish from bearish.
Short Entry (SE): Triggered when the trend turns bearish from bullish.
Exit Long (XL): Triggered when the price crosses below leading_line1 during an uptrend.
Re-enter Long (RL): Triggered when the price crosses above leading_line1 during an uptrend.
Exit Short (XS): Triggered when the price crosses above leading_line1 during a downtrend.
Re-enter Short (RS): Triggered when the price crosses below leading_line1 during a downtrend.
Label Styling:
Labels are color-coded for quick identification:
Green for long entries and re-entries.
Red for short entries and exits.
Blue for exiting long positions.
Orange for re-entering short positions.
Tooltips provide additional context for each label.
Alert Configuration:
Alerts are generated for each signal condition, ensuring traders are notified promptly.
Users can set up these alerts within TradingView by creating new alerts and selecting the appropriate conditions.
LIMITATIONS
The indicator may lag behind price action due to its use of moving averages and channel calculations 🕒.
False signals can occur in choppy or sideways markets 🌪️.
Users should always confirm signals with other forms of analysis.
NOTES
Ensure that you have sufficient historical data available for accurate calculations.
Test the indicator thoroughly on demo accounts before applying it to live trading 🔍.
Customize the appearance and parameters as needed to fit your trading strategy.
For better risk management, consider integrating stop-loss and take-profit levels into your trading plan.
To optimize performance, manage old labels by deleting them after a certain period to avoid clutter on the chart.
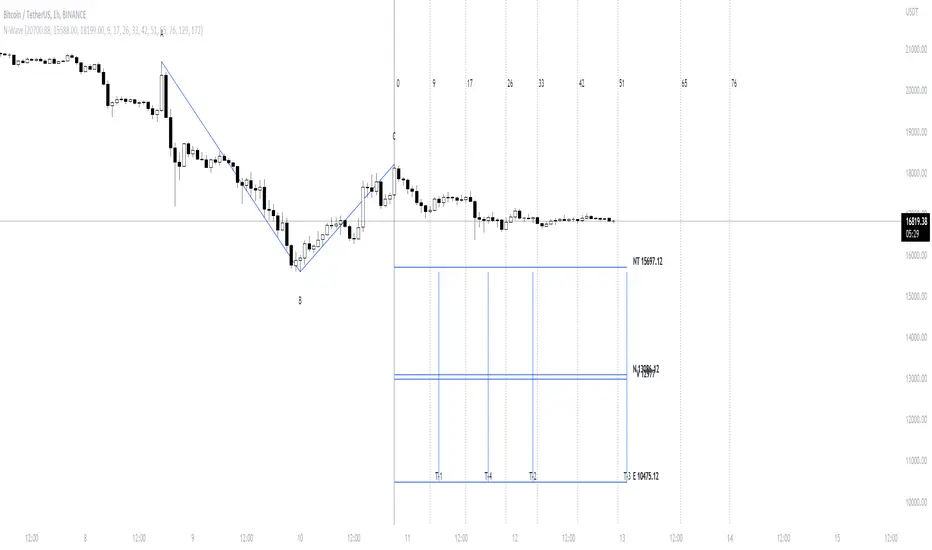
Hosoda Time Cycles (Forward + Backward)Hosoda Time Cycles
Market Timing Projection Tool
The Hosoda Time Cycles indicator is inspired by the legendary Japanese trader Ichimoku Hosoda, who emphasized the power of time in forecasting market behavior. This tool visualizes forward and backward time cycles based on significant price pivots, enabling traders to anticipate potential trend shifts, consolidations, or continuations with high precision.
Key Features:
Forward & Backward Cycles: Projects future and past time intervals based on selected pivots to reveal cyclical patterns.
Manual & Auto Pivot Selection: Choose between automatic detection or manually selected swing highs/lows.
Cycle Ratios: Includes traditional Hosoda counts such as 9, 17, 26, 33, 42, and 65 — key numbers in Ichimoku time theory.
Multi-Timeframe Utility: Effective across intraday, swing, and long-term charts.
Minimalist Overlay: Clean design to avoid clutter while providing powerful cycle insights.
Customizable Visuals: Adjustable line styles, colors, and cycle projection lengths for clarity and personalization.
Ideal For:
Traders focused on time-based confluence, cycle forecasting, and market rhythm detection, especially those who blend price action with Japanese trading techniques.

TrendMasterPro_FekonomiTrend Change and Start Signals with Weighted Conditions
The Trend Change and Start Signals with Weighted Conditions indicator leverages various technical analysis tools to generate reliable buy and sell signals. This indicator helps investors more accurately identify trend changes and start signals in the market.
Features:
Utilizes popular technical analysis tools such as MACD, RSI, EMA, and Ichimoku Cloud.
Enhances signal accuracy with additional indicators like ADX and Volume Increase.
Allows users to adjust the weights of each condition to set their importance.
The Confidence Level parameter lets you adjust the accuracy rate of the signals.
Visual Signals make it easy to track buy and sell points directly on the chart.
How It Works:
Condition Weights: Users assign weights to indicators like MACD, RSI, EMA, and Ichimoku Cloud. If you have no idea, use default settings.
Condition Fulfillment: Checks if the conditions for each indicator are met.
Confidence Level: The total weight of the fulfilled conditions must exceed the user-defined confidence level.
Signal Generation: When these conditions are met, a buy or sell signal is generated and visually displayed on the chart.
Customization:
Personalize Signals: By adjusting the weights of the indicators used, you can personalize the signals to match your trading strategy and preferences.
Use Cases:
Short-Term Investments: Identify quick trend changes for short-term trading decisions.
Long-Term Investments: Detect long-term trend starts and changes for strategic investment decisions.
Technical Analysis: Combine different technical analysis tools for more comprehensive and reliable analyses.
With this indicator, you can better understand market movements and make more informed investment decisions. Try it now and enhance your trading strategy!
by Fekonomi

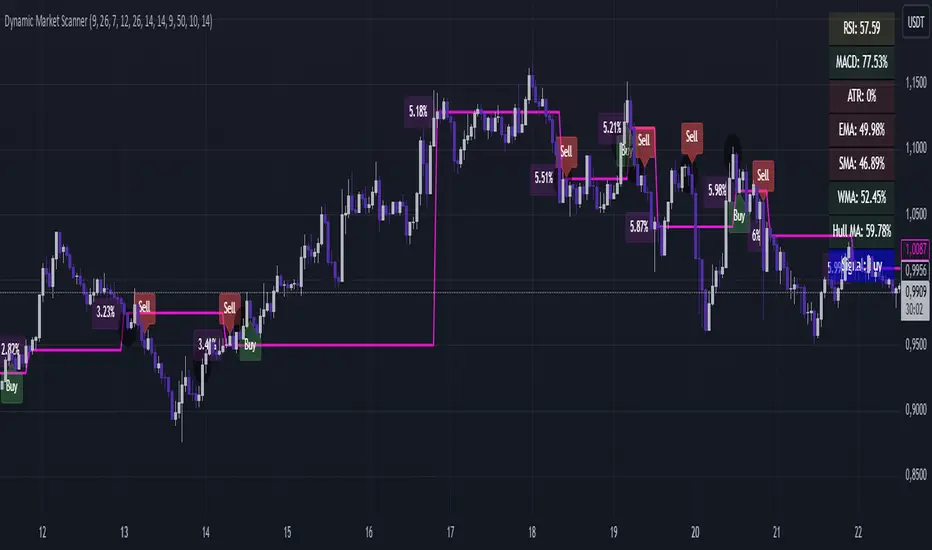
Dynamic Market ScannerDynamic Market Scanner is a powerful tool for analyzing financial markets, combining a variety of indicators to provide clear and understandable signals.
Key Features:
- Signal Generation:
The main signals "Buy", "Sell", and "Hold" are formed based on the analysis of indicators:
- MACD
- RSI
- SMA
- EMA
- WMA
- Hull MA
Additional Analytical Tools:
- ATR is used to assess volatility and helps to understand the risk of the current market situation.
- SMA Ichimoku does not generate signals but is used to assess their accuracy.
- If the price is above the SMA, "Buy" signals are more likely, as this confirms the strength of the upward movement.
- If the price is below the SMA, "Buy" signals require additional confirmations.
Dashboard:
Displays the current price position relative to the indicators, helping the trader understand how strong or weak the current signals are.
Advantages of Using:
1. Signal Filtering:
The price position relative to the SMA Ichimoku helps to assess the likelihood of successful trades.
2. Volatility Analysis:
ATR provides additional information about risks and market fluctuations.
3. Comprehensive Approach:
Signal generation is based on a combination of key indicators, offering a multifaceted view of the market.
Explanation of Percent Calculation in the Table:
- The table shows the values of indicators such as MACD, ATR, EMA, SMA, WMA, and Hull MA in percentages. Percentages are calculated based on the current value of the indicator relative to its maximum and minimum.
- Percentages are displayed for each indicator, allowing traders to assess market conditions based on their current values.
Dynamic Market Scanner will become a reliable assistant in your technical analysis toolkit, providing a comprehensive overview of market conditions and helping to make informed trading decisions.