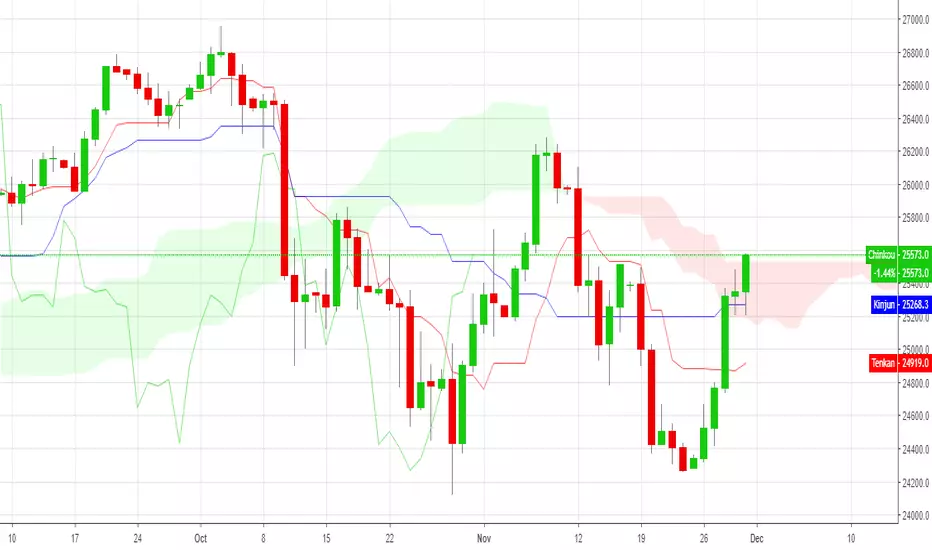
C10 My Enhanced IchimokuThis script shows Crosses up/down Tenkan-Sen (9 Period) and Kinjun-Sen (26 Period)
There is the ability to Color the Cloud based on Trend
I called it the Enhanced Ichimoku
Cari dalam skrip untuk "ichimoku"

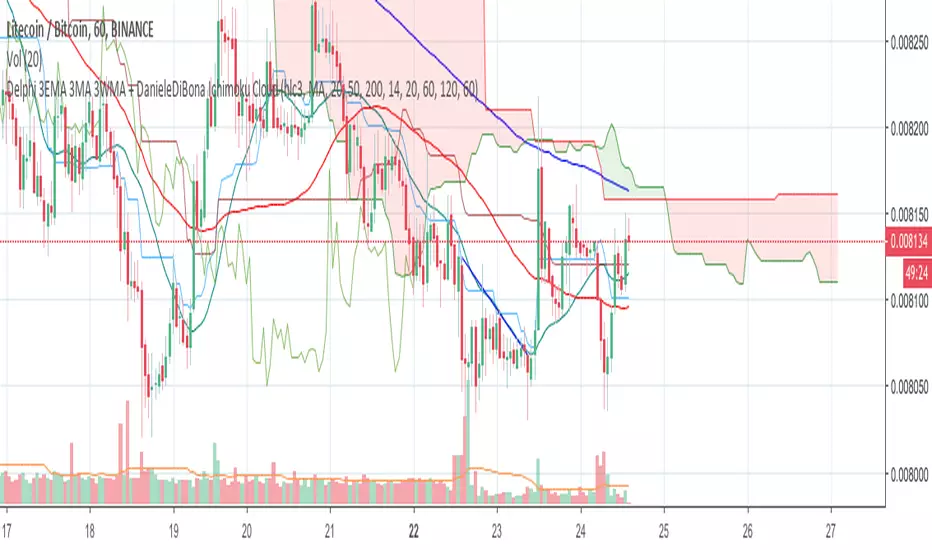
Delphi 3EMA 3MA 3WMA + DanieleDiBona Ichimoku Cloudadded Ichimoku Cloud with amazing settings included ;)))
Trend Overlay Ichimoku [SSTEAM]The crew ask for the ichimoku cloud in the our indicator.
it was added and now we was backtesting for it.
any suggest will be welcome.
thanks.

Moving Average 5line & Ichimoku CloudMoving Average 5line
change MA length
change MA source
SMA / EMA Select Button
display Ichimoku Cloud Button


nq1320 DARVAS,MavilimW,Tillson T3,trailing stop loss,ichimoku-3 MA Green and RED
- Ichimoku
- Davras

TES Ichimoku Cloud Signals v2TES Ichimoku Cloud Signals v2
A signal indicator that can sends buy signals to your exchange via Autoview.
This requires invite to use. Send a PM to grand access. Test it using the Backtester to see the great results it can provide.
- Use the moving average to sort out any bad signals. This trend is individual for each coin and by adjusting it, you can make the signals perfect for each coin you want to trade. Scroll through them all and find the best fit.
- Set stop loss % or leave it to let the signals buy on the downtrend
- Show your DCA %, if used in combination with ProfitTrailer.
Support the development and the future of great signal trading by donating.
BTC: 13qeJRZ1S2wGNYdHCNvKyieugWcVt2fiVg
ETH: 0xe73bfe4d981af78c2695cee4d495ca910ee8f49b
BNB: 0xe73bfe4d981af78c2695cee4d495ca910ee8f49b

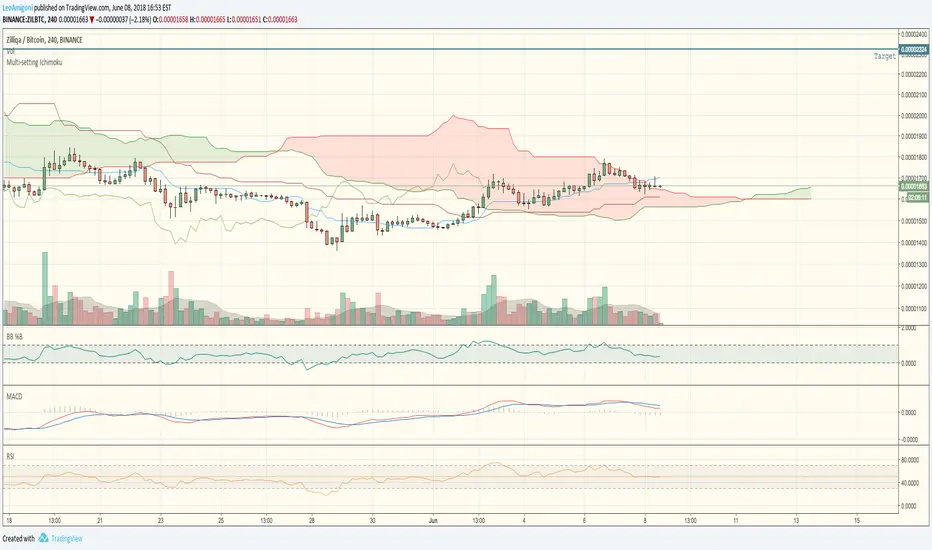
Leo Crypto Multi-setting Ichimoku CloudEasily switch between Traditional, Crypto Single and Crypto Double Ichimoku Settings


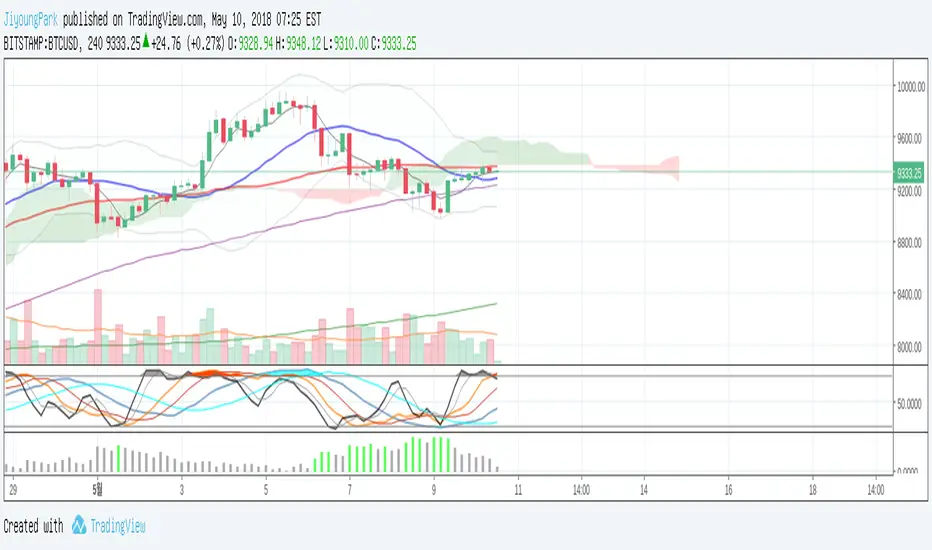
Moving Averagies & Ichimoku & Bollinger Band by Theo ParkThis indicator has
- 5 Moving Averagies (5, 20, 60, 120, 240)
- Ichimoku Cloud
- Bollinger Band
EMA (8,13,21,55,100,200) - BollingerBands - Ichimoku - PivotsVery complete script for trading crypto or forex.
EMA (8, 13, 21, 55, 100, 200)
Bollinger Bands
Ichimoku Clouds
Pivot Points Daily or Weekly or Both


XAUMO MegaBar VSA by Mohamed Mahmoud XAUMO MegaBar VSA — Smart Money Breakout & Reversal Engine for XAUUSD
(Educational Use Only)
1) WHAT THIS INDICATOR DOES
XAUMO MegaBar VSA is an institutional-style smart money engine for XAUUSD designed to show you what professional money is doing, not just where price is moving.
It combines:
- MegaBar detection on 1H and 15m
- VSA (Volume Spread Analysis) events
- VPOC / WVPOC and volume clusters
- Liquidity sweeps, CHoCH, order blocks, FVGs
- Full Fibonacci leg mapping (retracements + extensions)
- Pre-built execution ladders (Entry, SL, TP1–TP4, Reverse Fib trades)
All in one dashboard with:
- Color-coded candles
- Clean, ATR-offset labels
- Optional tables and debug panels
So traders can quickly decide:
“Is this move driven by smart money, or is it just noise?”
2) CORE MODULES & FEATURES
A) SESSION + ACCUMULATION / DISTRIBUTION CONTEXT
- Session filter: London, New York, Overlap, or custom.
- Accumulation / distribution zones shaded on chart with adjustable colors/opacity.
- Quick legend so you always know if the market is in “smart money accumulation” or “distribution”.
HOW TRADERS USE IT:
Focus only on your trading session and instantly see if volume is building (accumulation), unloading (distribution), or flat. This helps you avoid trading in dead liquidity.
--------------------------------------------------
B) MEGABAR ENGINE + FIB MAP
- Automatically detects “MegaBars” (institutional candles) on 15m and 1H.
- Uses body size, range, and volume to pick only meaningful bars.
- Builds a full Fibonacci map from each active MegaBar:
• Retracements: 0, 13, 23.6, 38.2, 50, 61.8, 78.6, 86.2, 100, and -33.
• Extensions: 125% up to 600%+ (configurable ladder).
- Per-level style controls:
• Color, width, line style (solid/dotted/dashed).
• Optional price labels with ATR-based offsets.
- Main Fib legend that explains shallow / normal / deep reload zones.
HOW TRADERS USE IT:
You stop guessing where to buy or sell. You trade around the institutional leg:
- Buy dips into defined reload zones after bullish MegaBars.
- Sell rallies into extension zones after bearish MegaBars.
- Use clean, pre-mapped structure for both scalps and swings.
--------------------------------------------------
C) VSA ENGINE + CANDLE LABELING
- Detects a full set of VSA events such as:
• No Demand / No Supply
• Stopping Volume
• Absorption
• Springs / Upthrusts
• Buying Climax / Selling Climax
• Bullish / Bearish EVR
• Tests and confirmed VSA signals at S/R
- Enhances with:
• Body vs total range analysis
• Wick dominance for exhaustion vs aggression
• Momentum and volume confirmation filters
HOW TRADERS USE IT:
Each label becomes a “comment” from smart money on the chart:
- “No Demand” near resistance + weak RVOL = skip long entries.
- “Stopping Volume” + spring at Fib reload zone + VPOC cluster = potential high-quality long.
- Combine VSA with the MegaBar Fib map and volume profile for structured decisions.
--------------------------------------------------
D) SUPERSONIC BREAKOUT ENGINE
- Calculates a breakout strength score using:
• RVOL and volume expansion
• Spread expansion vs recent bars
• Body quality (body vs range)
• Bar progress (how much of the candle’s time has elapsed)
- Differentiates:
• Potential vs confirmed breakouts
• Strong, volume-backed moves vs weak spikes
- Optional debug label explaining:
• Momentum score
• Volume ratio and RVOL
• Spread behaviour
• Body quality
• Bar elapsed %
HOW TRADERS USE IT:
You avoid chasing every big candle.
You only act when:
- Breakout strength is high,
- Volume confirms the move,
- Structure (Fib / VPOC / CHoCH) is aligned.
--------------------------------------------------
E) VPOC / WVPOC CLUSTERS & DYNAMIC ZONES
- Tracks real-time VPOC and WVPOC.
- Identifies VPOC/WVPOC clusters as powerful S/R zones.
- Confirms bullish or bearish breaks when price clears these levels with volume.
- Provides dynamic SL and TP logic:
• SL near/behind VPOC with ATR buffer.
• TP ladders aligned with volume structure.
HOW TRADERS USE IT:
You anchor your risk to where the most volume traded, not random price points:
- Use VPOC as a rational stop placement.
- Treat VPOC/WVPOC clusters as “coiled springs” – zones where large moves often start.
--------------------------------------------------
F) SMART MONEY ENTRY ENGINE (1H + 15M MEGABARS)
- Uses MTF `request.security` logic to bring 1H MegaBars into lower timeframes.
- Identifies:
• 1H + 15m confluence entries (A-grade setups).
• Single-TF entries (B-grade setups).
- Pre-calculates for each scenario:
• Entry level (Fib-based within the MegaBar range).
• Stop loss (beyond range or leg-based).
• TP1–TP4 along Fib extensions / structure.
- Labels show:
• “Entry = …”
• “SL = …”
• “TP1 = … / TP2 = … / TP3 = … / TP4 = …”
with adjustable font size and ATR-based offsets.
- Optional “show only latest” mode to keep your chart clean.
- Alert-ready so you can receive notifications when conditions are met.
HOW TRADERS USE IT:
You get a fully defined execution ladder:
- The engine tells you where a logical entry is,
- Where a logical SL should be,
- And how to scale out with multiple targets.
You can use:
- Confluence setups for main trades,
- Single-TF setups for more frequent but lower conviction trades.
--------------------------------------------------
G) REVERSE FIB TRADING MODULE
- Triggers after extended moves when key TPs are hit.
- Looks for:
• Rejection candles at or beyond major extensions.
• Exhaustion + VSA confirmation.
- Builds a reverse (counter-trend) Fib plan:
• Counter-trend entry from extension extremes.
• TP ladder based on 0.618, 0.786, 1.236, 1.382, 1.5, 1.618, 2.0, etc.
• SL and TSL based on ATR and Fib distance.
- ATR timeframe adapts to chart timeframe.
HOW TRADERS USE IT:
You can fade overextended moves once structure and P/A agree:
- Trend traders can use it to tighten or exit.
- Counter-trend traders can structure “fade” setups with defined risk.
--------------------------------------------------
H) LIQUIDITY SWEEPS, CHoCH, ORDER BLOCKS, FVGs
- Detects sweeps above highs and below lows (liquidity grabs).
- Marks CHoCH (Change of Character) when structure flips with volume.
- Basic smart money order block detection (bullish / bearish).
- FVGs (Fair Value Gaps) shaded on chart, removed when filled.
HOW TRADERS USE IT:
Combine sweeps + CHoCH + MegaBar + VSA + VPOC:
- Join clean, volume-backed continuations.
- Fade obvious stop hunts when they reject into strong zones.
--------------------------------------------------
I) VSA + BREAKOUT DASHBOARD TABLE (OPTIONAL)
- Compact table with:
• VSA context
• Breakout score
• RVOL / volume status
• Spread and candle quality
• ATR regime
• Close position within the bar
• VPOC and elapsed bar percentage
HOW TRADERS USE IT:
Before pressing the button, glance at the table:
- Is volatility supportive?
- Is volume confirming?
- Is this a clean breakout or a tired move?
This pushes you toward rule-based execution and away from impulse.
--------------------------------------------------
3) TYPICAL TRADING WORKFLOW WITH XAUMO MEGABAR VSA
A) Pick timeframe and session
- Use 15m or 1H on XAUUSD.
- Align the indicator’s session inputs with your actual trading hours.
B) Read context first
- Check accumulation / distribution zones.
- Look at VSA events and the breakout engine.
- Note where VPOC / WVPOC are relative to price.
C) Find the active MegaBar and its Fib structure
- Identify the most recent bull/bear MegaBar.
- See if price is:
• Pulling back into reload zones,
• Breaking out of them,
• Or extending into high-risk zones.
D) Wait for smart money confirmation
- Look for:
• Confluence setups (1H + 15m MegaBars),
• Strong breakout score,
• Valid VSA signals,
• Helpful structure: CHoCH, FVG, sweeps.
E) Execute using the printed ladders
- Use the on-chart Entry / SL / TP labels as your execution framework.
- Adjust lot size and risk % according to your own plan.
F) Manage and exit
- Use ATR / VPOC logic to trail or lock profits.
- Rotate to reverse Fib setups if extensions look exhausted.
4) WHO THIS INDICATOR IS FOR
- Gold traders (XAUUSD CFD or spot) on 15m and 1H.
- Traders who prefer institutional structure (volume, VPOC, SMC, Fib) over simple indicators.
- Traders who want pre-structured entries, SL, and TP ladders without losing flexibility.
- Advanced students of VSA and smart money concepts who want everything in one tool.
5) FULL EDUCATIONAL DISCLAIMER (READ CAREFULLY)
- This indicator and all descriptions are for EDUCATIONAL PURPOSES ONLY.
- NOTHING in this script, its labels, tables, alerts, outputs, or documentation is:
• Investment advice
• Trading advice
• A recommendation to buy or sell any asset
• A signal service or portfolio management tool
- Markets are risky. Trading leveraged instruments such as CFDs, futures, or margin products involves a HIGH RISK of loss, including the possible loss of ALL invested capital.
- Past performance, backtests, or hypothetical examples DO NOT guarantee future results.
- Any probabilities, scores, or “quality levels” shown by the indicator are purely algorithmic and DO NOT represent guarantees or promises of profit.
- You are solely responsible for:
• Your position sizing
• Your leverage
• Your entries, exits, and risk management
• Compliance with local regulations and tax rules
- Before trading live with real money, you should:
• Thoroughly backtest and forward-test the indicator.
• Use a demo account to understand how signals behave in real time.
• Consult a licensed financial professional if you need personalised investment or trading advice.
- By using this indicator:
• You accept that the author and any associated entities or brands (including XAUMO, XAUMO indicators, and any promotional text) bear NO LIABILITY for any financial losses, missed gains, or decisions you make based on this tool.
• You agree that you are acting entirely at your own risk and that all outputs are informational and educational, not prescriptive trading instructions.
In short:
Use XAUMO MegaBar VSA as a powerful educational and analytical companion,
NOT as a substitute for your own independent judgment, testing, and risk control.
=====================================================
XAUMO MegaBar VSA — محرّك البريك آوت و الريفرسال بتاع السمارت ماني للدهب
( استخدام تعليمي بس)
1) المؤشّر ده بيعمل إيه؟
XAUMO MegaBar VSA معمول مخصوص للـ XAUUSD عشان يورّيك "الفلوس الكبيرة" بتتحرك إزاي،
مش بس السِعر رايح فين.
بيجمع في حتّة واحدة:
- رصد MegaBar على الساعة والربع ساعة
- VSA (Volume Spread Analysis) – سلوك الفوليوم جوّه الشمعة
- VPOC / WVPOC و تجمّعات الفوليوم المهمّة
- سويپس لليكويديتي + CHoCH + Order Blocks + FVGs
- خريطة فيبوناتشي كاملة (Retrace + Extensions)
- سلالم تنفيذ جاهزة (Entry, SL, TP1–TP4 + صفقات Reverse Fib)
وكل ده:
- بألوان واضحة على الشموع
- لِيبلات متظبّطة بـ ATR Offset
- Tables و Panels اختيارية
عشان المتداول يسأل نفسه:
"الحركة دي بتاعة سمارت ماني؟ ولا مجرد دوشة ملوش لازمة؟"
2) أهم الموديولات اللي جوّه المؤشّر
A) الكونتكست بتاع السيشن + تجميع/توزيع
- فلتر جلسات: لندن – نيو يورك – overlap – أو وقت تحطّه انت.
- مناطق Accumulation / Distribution متظلّلة بألوان أنت بتختارها.
- لچند بسيط يوضّح لك السوق دلوقتي: تجميع؟ توزيع؟ ولا نايم.
المتداول يستخدمه إزاي؟
تركّز بس في الجلسة اللي انت شغّال فيها، وتشوف فورًا:
فيه بناء مراكز؟ فيه تصريف؟ ولا مفيش فوليوم أصلاً؟
ده يقلّل دخولك في أوقات السوق فيها “ميت”.
--------------------------------------------
B) محرّك الـ MegaBar + خريطة الفيبوناتشي
- المؤشّر يلقط لوحده الـ MegaBars (شموع مؤسّسات) على 15m و 1h.
- بيعتمد على: حجم الجسم، مدى الشمعة، الفوليوم.
- يرسم خريطة فيبوناتشي كاملة من الرجل الأساسية:
• Retrace: 0, 13, 23.6, 38.2, 50, 61.8, 78.6, 86.2, 100, -33
• Extensions: من 125% لحد 600%+ (سلم قابل للتعديل)
- لكل مستوى:
• لون / سماكة / ستايل (سوليد – دوتيد – داشد)
• ليبل سِعر مع Offset بـ ATR
- لچند يشرح لك Reload Zones: ضحلة / عادية / عميقة.
المتداول يستخدمه إزاي؟
بدل ما “تخمّن” فين تشتري وتبيع:
- تشتري الدِپ جوّه مناطق Reload بعد MegaBar صاعد.
- تبيع الريبوند جوّه Extensions بعد MegaBar هابط.
- عندك هيكل واضح للسوينج والسكالب من غير فوضى.
--------------------------------------------
C) VSA + لِيبلات على الشموع
- يكتشف أحداث VSA زي:
• No Demand / No Supply
• Stopping Volume
• Absorption
• Spring / Upthrust
• Buying / Selling Climax
• EVR (شموع مجنونة فوليومًا)
• Tests و Confirmed Signals عند الدعوم/المقاومات
- مع تحسينات:
• تحليل Body vs Range
• مين اللي غالب؟ جسم الشمعة ولا الذيول؟
• فلتر Momentum + Volume
المتداول يستخدمه إزاي؟
كل ليبل على الشمعة = كومنت من السمارت ماني:
- No Demand عند مقاومة + RVOL ضعيف → بلاش تشتري.
- Stopping Volume + Spring جوّه Reload Zone + VPOC → فرصة قوية للشراء.
- توصل بين VSA + Fib + VPOC فتفهم “مين بيكسب المعركة”.
--------------------------------------------
D) محرّك البريك آوت Supersonic
- بيحسب Score للقوة بتاعة البريك آوت من:
• RVOL + Volume Expansion
• توسّع السبريد مقارنة بالشموع السابقة
• جودة جسم الشمعة (جسم ولا ذيل)
• نسبة الوقت اللي عدّى من الشمعة الحالية
- يفرّق بين:
• بريك آوت محتمل vs مؤكد
• حركة قوية مدعومة بفوليوم vs “شمعة شو”
- يقدر يطلع ليبل Debug يشرح:
• Momentum Score
• Volume Ratio / RVOL
• Spread Behaviour
• Body Quality
• % الوقت اللي فات من عمر الشمعة
المتداول يستخدمه إزاي؟
ماتجريش ورا كل شمعة كبيرة:
- استنَى لما يكون الـ Score عالي،
- والفوليوم مصدّق الحركة،
- والهيكل (Fib / VPOC / CHoCH) موافق.
ساعتها بس البريك آوت يستاهل المخاطرة.
--------------------------------------------
E) VPOC / WVPOC + مناطق الفوليوم
- يرقب VPOC و WVPOC في الوقت الحقيقي.
- يحدّد Clusters مهمة تتحوّل لـ Support / Resistance محترم.
- يراقب كسر المناطق دي بفوليوم واضح (بداية موجة جديدة).
- SL و TP ديناميك:
• SL حوالين VPOC مع Buffer من ATR.
• TP متوزع على مستويات فيبوناتشي و زونات فوليوم.
المتداول يستخدمه إزاي؟
بتربط مخاطرتك بأين اشتغل الفوليوم التقيل:
- VPOC = منطق منطقي للستوب.
- Clusters = زون ضغط ينفع يبدأ منها ترند قوي.
--------------------------------------------
F) محرّك الدخول بتاع السمارت ماني (1h + 15m MegaBars)
- يجيب MegaBars بتاعة الساعة جوّه فريمات أقل بالـ `request.security`.
- يميّز:
• Confluence بين MegaBar الساعة + MegaBar الربع ساعة (صفقة A-Grade).
• MegaBar على فريم واحد بس (B-Grade).
- يجهّز تلقائيًا:
• Entry
• SL
• TP1–TP4 على Extensions و مستويات هيكلية.
- اللّيبلات تكتب:
• Entry = …
• SL = …
• TP1 = … / TP2 = … / TP3 = … / TP4 = …
مع تحكّم في حجم الخط و ATR Offset.
- فيه اختيار “أظهر آخر سيناريو بس” عشان الشارت يفضل نضيف.
- جاهز للـ Alerts لما الشروط تكمّل.
المتداول يستخدمه إزاي؟
يبقى عندك Execution Ladder كامل:
- فين تدخل،
- فين تحط الستوب،
- إزاي تقسم الخروج على أكتر من هدف.
--------------------------------------------
G) موديل الـ Reverse Fib (صفقات عكس الاتجاه)
- بيشتغل بعد ما السعر يبالغ في الحركة و يوصل Extensions معيّنة.
- يدور على:
• شموع رفض عند/بعد Extensions.
• Exhaustion + إشارة VSA.
- يرسم خطة عكسية:
• Entry عكسي من Extension Extreme.
• TP سلم مبني على 0.618, 0.786, 1.236, 1.382, 1.5, 1.618, 2.0, … إلخ
• SL و TSL مبنيين على ATR و مسافة الفيبوناتشي.
المتداول يستخدمه إزاي؟
لو انت ترند تريدر:
- تستخدمه عشان تقفل/تخفف عند تمدّد مبالغ فيه.
لو انت Counter-Trend:
- يديك سيناريو “فِيد” منطقي بمخاطرة محسوبة.
--------------------------------------------
H) سويپس لليكويديتي + CHoCH + Order Blocks + FVGs
- يوسم مناطق ضرب الستوبات فوق الهاي وتحت اللو (Liquidity Grabs).
- يحدد CHoCH لما الاتجاه يغيّر شخصيته مع فوليوم.
- يرصد Order Blocks أساسية (Bullish / Bearish).
- يظلّل الـ FVGs و يشيلها لما تتعبّى.
المتداول يستخدمه إزاي؟
تجمع بين:
MegaBar + VSA + Fib + VPOC + Liquidity:
- يا إمّا تلحق موجة نظيفة،
- يا إمّا تفِيد Stop Hunt غبي اتكشف على الشارت.
--------------------------------------------
I) داشبورد VSA + Breakout (Table اختياري)
- Table صغيرة فيها:
• حالة VSA
• قوة البريك آوت
• RVOL / Volume
• Spread & Candle Quality
• حالة ATR
• مكان الإغلاق جوّه الشمعة
• وضع VPOC
• نسبة الوقت اللي عدّى من الشمعة
المتداول يستخدمه إزاي؟
قبل ما تدوس Buy / Sell:
- تبص على التابل ثانيتين:
الدنيا شغّالة ولا لأ؟
فيه فوليوم؟ فيه ترند؟ ولا حركة ميتة؟
ده يقلل قرارات “من غير plan”.
3) سيناريو شغل متداول على XAUMO MegaBar VSA
1) اختار الفريم + الجلسة
- 15m أو 1h على XAUUSD.
- ظبّط سيشن لندن/نيويورك زي وقت شغلك الحقيقي.
2) اقرأ الكونتكست
- السوق بيبنِي مراكز؟ بيصفّي؟ ولا نايم؟
- إيه إشارات الـ VSA و Score البريك آوت؟
- فين VPOC / WVPOC من السعر؟
3) دور على MegaBar النشط و خريطة الفيبوناتشي بتاعته
- السعر:
• بيرجّع جوّه Reload Zone؟
• بيكسر البرنچ؟
• ولا داخل على Overextension؟
4) استنَى تأكيد السمارت ماني
- Confluence بين MegaBar الساعة والربع ساعة.
- Breakout Score محترم.
- VSA منطقي (No Demand, Stopping Volume, Spring, …).
- Structure: CHoCH / FVG / Liquidity Sweep في اتجاه الصفقة.
5) نفّذ باستخدام السلم المطبوع على الشارت
- استخدم Entry / SL / TP1–TP4 كـ هيكل أساسي.
- عدّل اللوت / الريسك حسب خطتك انت.
6) الإدارة والخروج
- استعمل ATR + VPOC في Trailing/Lock.
- لما Extensions تبان مبالغ فيها → ركّز على Reverse Fib.
4) المؤشّر ده مناسب لمين؟
- اللي بيتاجر دهب XAUUSD (CFD أو Spot) على 15m و 1h.
- اللي بيحب شغل مؤسّسات: Volume, VPOC, SMC, Fib مش مؤشرات بسيطة.
- اللي عايز Execution Plan جاهز (Entry/SL/TP) بس لسه عنده حريّة تعديل.
- اللي عايز يتعلّم VSA و Smart Money Concepts بشكل تطبيقي على شارت واحد.
5) إخلاء مسؤولية كامل (مهم تقراه)
- المؤشّر ده وكل الكلام اللي حواليه للتعليم بس.
- مش:
• نصيحة استثمارية،
• ولا توصية شراء/بيع،
• ولا خدمة إدارة محافظ،
• ولا سيجنال سيرڤس.
- التداول في الأسواق (خصوصًا المشتقات، الـ CFD، الفيوتشر) فيه مخاطرة عالية جدًا،
وممكن تخسر جزء كبير أو كل رأس مالك.
- أي أداء سابق، باك تست، أو مثال افتراضي → مش ضمان لنتيجة مستقبلية.
- أي نسبة احتمالات، Scores، أو “Quality” بيطلعها المؤشّر:
• دي حسابات كود، مش ضمان ربح،
• مش وعد ولا تعهّد بأي نتيجة.
- انت المسؤول 100% عن:
• حجم العقود اللي بتدخلها،
• الرافعة اللي بتستخدمها،
• أماكن الدخول والخروج،
• وإدارة المخاطرة بتاعتك،
• والتزامك بالقوانين والضرائب في بلدك.
- قبل ما تستخدم المؤشّر على حساب حقيقي:
• جرّب كويس على باك تست و فورورد تست،
• اشتغل فترة على Demo،
• لو محتاج نصيحة مالية شخصية → ارجع لمستشار مالي مرخَّص.
باختصار:
XAUMO MegaBar VSA ده أداة تعليمية وتحليلية قوية تساعدك تفهم حركة الذهب،
مش زرار “اطبع فلوس”.
انت صاحب القرار، وانت صاحب المسؤولية، وانت اللي بتتحمّل أي ربح أو خسارة.

XAUMO Gap RetraceXAUMO Gap Retrace
Educational description for TradingView (English)
📘 EDUCATIONAL ONLY — NOT FINANCIAL ADVICE
This script is for study, training and back-testing ideas. It does NOT give guaranteed
buy/sell signals and must NOT be used to promote any “risk-free” or “fixed return” schemes.
────────────────────────────────
1) What does XAUMO Gap Retrace do?
────────────────────────────────
This indicator tracks a very specific price behaviour:
» After a bar closes (and is NOT a tweezer with the previous bar),
it “arms” a target at the previous bar’s High or Low.
» It then watches to see if the market retraces to that level
on the next bar (or later, depending on your setting).
» When price touches that previous High/Low, it marks the fill,
updates a live label with distance and progress, and can fire an alert.
In simple terms:
“Every candle that closes away from the previous candle
gets a ‘magnet’ at the previous High or Low.
XAUMO Gap Retrace tells you if the very next candle comes back
to fill that gap to the previous bar.”
────────────────────────────────
2) Core logic step-by-step
────────────────────────────────
(1) Tweezer detection
• It calculates:
– prevH = previous bar’s High
– prevL = previous bar’s Low
– tol = toleranceTicks × syminfo.mintick
• If the current bar’s High or Low is within “tol” of the previous High or Low,
it is treated as a tweezer:
isTweezer = highs or lows almost equal to previous bar.
• Tweezer bars are ignored (no new target armed) to avoid noise.
(2) Target selection (Midline vs Nearest)
When a bar closes (barstate.isconfirmed) and it’s not a tweezer:
• Mode = "Midline"
– prevMid = (prevH + prevL) / 2
– If close >= prevMid → target = prevH (previous High)
– Else → target = prevL (previous Low)
• Mode = "Nearest"
– target = whichever is nearer to the close:
• prevH or prevL
The chosen level is stored in:
• lastTarget = the price level we are waiting to be filled
• lastSigIndex = bar_index of the signal candle
• needUp = true if close < target (price must go up to fill)
false if close > target (price must go down)
• baseDist = |close - target| at the signal bar
(used later to compute “progress”).
(3) Active state and fill detection
• isArmed = lastTarget is not na (we have a live target).
• isNextBar = bar_index == lastSigIndex + 1.
• isActive =
– if nextBarOnly = true → only the immediate next bar is allowed
– if nextBarOnly = false → any bar after the signal is active.
Price-touch rule:
• If needUp = true → fill when high >= lastTarget.
• If needUp = false → fill when low <= lastTarget.
This gives:
• fillNow = true on the bar where the previous High/Low is touched.
(4) Target line and fill marker
• plot() draws a line at lastTarget (with linebreak style) while armed.
• plotshape() draws a tiny circle at the touch price when fillNow is true,
labelled “fill”.
(5) Live distance / progress label
A single live label (liveLbl) shows live stats on the last bar:
• dist = |close - lastTarget|
• distTicks = dist / tick
• progress = how far the market has moved towards the target since the signal:
– 0% = no progress
– 100% = fully filled
(internally clamped between 0 and 1 with a custom clamp function).
If showLabel is ON, on the last bar:
• Old label is deleted,
• New label is created at (bar_index + liveLabelShift, close),
so it appears shifted to the right by N bars.
• Text includes:
– Target price
– Distance in price and ticks
– Progress %
– Direction text “↑ need up” or “↓ need down”.
(6) Alerts
• alertcondition(fillNow, ...) triggers when the previous High/Low
is touched according to the rules above.
• You can connect this to TradingView alerts to be notified when
the gap retrace happens.
(7) Auto-reset (when nextBarOnly = true)
• After the “next bar” closes, if the target is still armed,
the script clears:
– lastTarget
– baseDist
so that a new signal can be armed on future bars.
────────────────────────────────
3) Inputs summary
────────────────────────────────
• Tweezer tolerance (ticks)
– How close highs or lows can be to be considered a tweezer (skip signal).
• Target selection
– "Midline": choose High or Low based on whether close is above/below midpoint.
– "Nearest": choose whichever of prev High/Low is closer to the close.
• Only allow fill on the following bar
– If true: only the very next bar can fill the target.
– If false: any later bar can fill it.
• Show target line
– Draw/Hide the H/L target line.
• Show signal/fill markers
– Draw/Hide the small circle marker on fill.
• Show live distance label
– Turn the floating label ON/OFF.
• Live label → shift right (bars)
– Horizontal shift in bars for the live label (default 3 bars to the right).
────────────────────────────────
4) How to use it (educational view)
────────────────────────────────
XAUMO Gap Retrace is a study tool for:
• Testing how often a candle “comes back” to revisit the previous bar’s High/Low.
• Studying behaviour of retracements after a non-tweezer move.
• Combining gap-retrace logic with your own system:
– support/resistance
– VWAP / FVRP
– volume / delta
It is NOT meant to be traded blindly. It’s a microscope for one specific
price pattern: “does the next bar retrace to the previous bar’s H/L?”
────────────────────────────────
5) Risk & scam awareness
────────────────────────────────
• No script can guarantee profit or remove risk.
• Past retrace behaviour does not guarantee future behaviour.
• Never send money or account credentials to anyone claiming they can
use this indicator to give “fixed income” or “guaranteed returns”.
• Always test ideas, manage your own risk, and trade only money you
can afford to lose.
================================================
XAUMO Gap Retrace
وصف تعليمي بالعربي لمكتبة TradingView
📘 الاسكريبت تعليمي فقط — مش توصية شراء أو بيع
الهدف إنك تذاكر سلوك السعر وتعمل باك-تست، مش إنك تاخد منه أرباح مضمونة.
ممنوع استخدامه في أي دعاية نصب أو وعود كاذبة.
────────────────────────────────
١) الاسكريبت ده بيعمل إيه؟
────────────────────────────────
XAUMO Gap Retrace بيراقب سلوك معيّن:
• بعد ما الشمعة تقفل (وبتكون مش تويزر مع الشمعة اللي قبلها)
الاسكريبت “يسلّح” Target عند هاي أو لو الشمعة السابقة.
• بعد كده يبص: هل الشمعة اللي بعدها (أو اللي بعدهم لو حابب)
رجعت لمست الهاي/اللو بتوع الشمعة اللي فاتت ولا لأ؟
• لو اتلمس الهاي/اللو:
– بيحط علامة “fill”
– يحدّث ليبل حيّ بمسافة السعر والتقدّم
– ممكن يضرب Alert لو أنت فعّلتها.
يعني بالعربي:
“كل شمعة تقفل بعيد شوية عن اللي قبلها، بنحطلها مغناطيس
عند هاي أو لو الشمعة اللي قبلها، وبنشوف هل الشمعة الجاية
هترجع تلمسه ولا لأ.”
────────────────────────────────
٢) المنطق الداخلي خطوة بخطوة
────────────────────────────────
(أ) كشف الـ Tweezer
• بيحسب:
– prevH = هاي الشمعة اللي قبل
– prevL = لو الشمعة اللي قبل
– tol = toleranceTicks × حجم التكة
• لو الهاي أو اللو الحالي قريب من الهاي/اللو اللي قبل
بمقدار tol → تعتبر Tweezer:
isTweezer = true
• في الحالة دي بنعدّي ومابنسلّحش Target عشان نتفادى النويز.
(ب) اختيار الهدف (Midline أو Nearest)
لو الشمعة اتأكدت (barstate.isconfirmed) ومش تويزر:
• لو Mode = "Midline":
– prevMid = (prevH + prevL) / 2
– لو close ≥ prevMid → الهدف = prevH (هاي السابق)
– غير كده → الهدف = prevL (لو السابق)
• لو Mode = "Nearest":
– الهدف = الأقرب للـ close بين prevH و prevL.
وبعدين يخزن:
• lastTarget = مستوى السعر اللي مستنّين اللمسة عنده.
• lastSigIndex = bar_index للشمعة اللي سلّحت الإشارة.
• needUp = true لو التارجت فوق الكلوز (السعر محتاج يطلع).
false لو التارجت تحت الكلوز (السعر محتاج ينزل).
• baseDist = المسافة الأصلية |close - target| عند شمعة الإشارة.
(ج) حالة التسلّح والFill
• isArmed = في Target شغّال؟
• isNextBar = إحنا في الشمعة اللي بعد الإشارة مباشرة؟
• isActive =
– لو nextBarOnly = true → بس الشمعة اللي بعد الإشارة مسموح تملأ.
– لو false → أي شمعة بعد الإشارة مسموح.
شرط اللمس:
• لو needUp = true → fill لما high ≥ lastTarget.
• لو needUp = false → fill لما low ≤ lastTarget.
ده بيطلع:
• fillNow = true على الشمعة اللي لمست فيها الهاي/اللو بتاع الشمعة السابقة.
(د) خط الهدف وعلامة الـ Fill
• plot() يرسم خط عند lastTarget طول ما الإشارة متسلّحة.
• plotshape() يرسم دايرة صغيرة مكتوب عليها “fill” وقت ما الشرط يتحقق.
(هـ) ليبل المسافة والتقدّم (لايف)
ليبل واحد حيّ liveLbl يوضح إيه اللي بيحصل حاليًا:
• dist = |close - lastTarget|
• distTicks = dist ÷ حجم التكة
• progress = التقدم من ٠٪ لحد ١٠٠٪ من المسافة الأصلية:
– ٠٪ = لسه ما اتحركناش ناحية الهدف
– ١٠٠٪ = تم ملء الهدف
(محسوبة بـ clamp عشان نفضل بين ٠ و١).
لو showLabel شغّال وعلى آخر شمعة:
• يمسح الليبل القديم (لو موجود)
• يرسم ليبل جديد عند:
bar_index + liveLabelShift, close
يعني مزحزح الليبل كذا شمعة قدام على الشارت.
• النص بيعرض:
– Target
– Dist + Dist in ticks
– Progress٪
– سهم واتجاه: "↑ need up" أو "↓ need down".
(و) التنبيهات (Alerts)
• alertcondition(fillNow, ...) بتضرب لما الهدف (هاي/لو الشمعة السابقة)
يتلمس حسب القاعدة.
• تقدر توصلها بألارم على TradingView عشان يجيلك نوتيفيكيشن أول ما
يحصل Retrace.
(ز) إعادة ضبط أوتوماتيكي (لما nextBarOnly = true)
• بعد قفل الشمعة اللي بعد الإشارة، لو لسه فيه Target متسلّح:
– lastTarget = na
– baseDist = na
عشان يبقى جاهز يسلّح إشارة جديدة بعد كده.
────────────────────────────────
٣) أهم الإعدادات (Inputs)
────────────────────────────────
• Tweezer tolerance (ticks)
– مساحة التسامح في الهاي/اللو عشان نعتبرها تويزر ونسيبها.
• Target selection
– "Midline": يختار الهاي أو اللو حسب مكان الكلوز من منتصف الشمعة.
– "Nearest": يختار الأقرب للكلوز.
• Only allow fill on the following bar
– لو true: بس الشمعة اللي بعدها اللي تقول “اتملّى ولا لأ”.
– لو false: أي شمعة بعد كده ممكن تملّي الهدف.
• Show target line
– إظهار/إخفاء خط الهدف.
• Show signal/fill markers
– إظهار/إخفاء دائرة الـ fill.
• Show live distance label
– تشغيل/إيقاف الليبل اللايف.
• Live label → shift right (bars)
– تزحزح الليبل كام شمعة قدام (افتراضي ٣).
────────────────────────────────
٤) الاستخدام التعليمي
────────────────────────────────
مفيد لو عايز:
• تدرس: كام مرة الشمعة اللي بعد كده بترجع تلمس هاي/لو الشمعة اللي قبلها؟
• تشوف سلوك Retrace بعد حركة مش تويزر.
• تضيف المنطق ده لاستراتيجيتك:
– زونز، VWAP، FVRP، فوليوم، دلتا… إلخ.
مش معمول إنك تشتري/تبيع لوحده بمجرد ظهور إشارة.
────────────────────────────────
٥) مخاطر واحتيال
────────────────────────────────
• مفيش سكريبت بيشيل عنك المخاطرة.
• اللي حصل في الماضي مش ضمان للي جاي.
• إوعى حد يقول لك “ب XAUMO Gap Retrace هديك ربح ثابت”.
• ادير ريسكك بنفسك، جرّب الأول على ديمو، واتاجر بس بفلوس
تقدر تتحمل خسارتها.
================================================================
XAUMO Gap Retrace — Business Case (English)
Scenario: Post-selloff balance inside Implosion Box
📘 EDUCATIONAL ONLY — NOT FINANCIAL ADVICE
For TradingView idea / script description. Not a signal, not a promise of profit.
────────────────────────────────
1) What do we see on the chart?
────────────────────────────────
• Symbol: XAUUSD (gold CFD)
• TF: intraday (15m in the screenshot)
• XAUMO Implosion Box is active:
– Box High ≈ 4084.6
– Box Low ≈ 4065.5
Price is moving sideways inside this purple “implosion” range
after a strong Mega Bear waterfall.
• XAUMO Gap Retrace has armed a target at:
– Prev H/L Target ≈ 4077.12
– Live label says:
Target: 4077.12
Dist: 0.84 (64 ticks)
Progress: 71%
↓ need down
This means:
• The last “signal bar” closed ABOVE the chosen previous High/Low.
• The script selected 4077.12 as the magnet (previous H or L).
• Current price is still ABOVE that level, so we “need down”
for a full retrace.
• 71% of the original distance has already been eaten — most of
the gap has been retraced, a small part remains.
────────────────────────────────
2) What is the business case here?
────────────────────────────────
Context:
• We had aggressive selling (multiple Mega Bear tags) pushing price
from the upper green zone into the Implosion box.
• After the dump, price is no longer trending: it is compressing
between Box High and Box Low (implosion phase).
• Inside this box, XAUMO Gap Retrace is tracking small dislocations
between a bar’s close and the previous bar’s High/Low.
Current business case:
• The system is telling us:
“The last impulse away from the previous bar left a void at 4077.12.
The market has already retraced ~71% of that distance, but a
small downward move is still needed to fully ‘close the loop’.”
Educational interpretation:
• As long as price stays inside the Implosion Box, these small
retraces behave like micro mean-reversion trades: the market likes
to test old highs/lows inside the range before deciding whether to
break out (Explosion) or fully revert to the opposite side.
So the business case is:
> We are in a post-liquidation balance (Implosion box).
> XAUMO Gap Retrace shows an unfinished downside retrace to 4077.12.
> This supports a short-term mean-reversion idea INSIDE the box,
> not a blind breakout chase.
You still need:
• Your own trigger (price action / volume / order flow).
• Your own risk plan (SL, size, invalidation if Box High/Low breaks).
────────────────────────────────
3) Risk & scam awareness
────────────────────────────────
• XAUMO Gap Retrace does NOT guarantee that 4077.12 will be filled.
• Implosion boxes sometimes break violently without completing every
tiny retrace.
• Never sell this idea as “guaranteed fill” or “risk-free setup”.
• Always test, size properly, and trade only what you can afford to lose.
SHOW ME THE MONEY ya XAUMO…
but with discipline, risk limits, and zero tolerance for scams.
=========================================================
XAUMO Gap Retrace — الحالة دي بتقول إيه؟ (عربي)
📘 تنبيه مهم:
الشرح ده تعليمي بس، مش توصية شراء أو بيع، ومش وعد بأي ربح.
ممنوع استخدامه في دعاية نصب أو “أرباح مضمونة”.
────────────────────────────────
١) إيه اللي باين على الشارت؟
────────────────────────────────
• الأداة: XAUUSD
• الفريم: إنترادي (١٥ دقايق في الصورة)
• صندوق XAUMO Implosion شغّال:
– Box High حوالي 4084.6
– Box Low حوالي 4065.5
السعر بيتحرّك رايح جاي جوّه البوكس البنفسجي بعد نازلة
جامدة (Mega Bear) من المنطقة الخضرا فوق.
• XAUMO Gap Retrace مسلّح هدف عند:
– Prev H/L Target ≈ 4077.12
– الليبل كاتب:
Target: 4077.12
Dist: 0.84 (64 ticks)
Progress: 71%
↓ need down
يعني:
• شمعة الإشارة قفلت فوق الهاي/اللو اللي الاسكريبت اختاره.
• التارجت 4077.12 هو هاي أو لو الشمعة اللي قبلها.
• السعر دلوقتي لسه فوق التارجت، فـ “محتاج ينزل” عشان يكمّل الـ Retrace.
• ٧١٪ من المسافة الأصلية اتحركت بالفعل، فاضل جزء صغير من الجاب.
────────────────────────────────
٢) الـ Business Case هنا إيه؟
────────────────────────────────
الخلفية:
• كان فيه بيع عنيف من فوق (Mega Bear) نزّل السعر لحد جوّه
صندوق الـ Implosion.
• بعد النزلة، السوق دخل في حالة توازن/كومبريشن بين Box High و Box Low.
• جوّه البوكس، XAUMO Gap Retrace بيتابع كل مرة الشمعة تقفل
بعيد عن هاي/لو الشمعة اللي قبلها وبيشوف: هل الشمعة الجاية
هترجع تلمس المستوى ده ولا لأ.
في اللحظة دي:
• السيستم بيقول لك:
“فيه حركة طالعة فوق سببت فجوة صغيرة لحد 4077.12.
أغلب المسافة اتردّت (حوالي ٧١٪)، لسه ناقص نزلة بسيطة
عشان نقفل الدورة على الآخر.”
القراءة التعليمية:
• طول ما السعر جوّه صندوق الـ Implosion، الحركات دي غالبًا
Mean-Reversion جوّه الرينج: السوق يحب يختبر الهاي/اللوهات
القديمة جوّه البوكس قبل ما يقرر:
– يكسر لفوق (Explosion Up)
– أو يكمل نزلة لتحت.
فالـ Business Case:
> إحنا في توازن بعد نزلة قوية (Implosion Box).
> XAUMO Gap Retrace بيقول لسه فيه Retrace ناقص لتحت لحد 4077.12.
> الفكرة أقرب لتريدات رينج/Mean-Reversion جوّه البوكس،
> مش مطاردة بريك أوت عشوائي.
بس لسه محتاج:
• تأكيد دخول من طريقتك (برايس أكشن / فوليوم / فلو).
• خطة ريسك واضحة (ستوب، حجم عقد، إلغاء الفكرة لو Box High/Low اتكسر).
────────────────────────────────
٣) مخاطر واحتيال
────────────────────────────────
• مفيش ضمان إن السعر لازم يلمس 4077.12.
• ساعات صندوق الـ Implosion بيتكسّر بعنف من غير ما كل Retrace
صغير يكتمل.
• إوعى حد يقول لك “كل هدف Gap Retrace بيتملّي ١٠٠٪” — ده نصب.
• دايمًا جرّب، اتحكّم في حجمك، واتاجر بس بفلوس تقدر تستحمل خسارتها.
SHOW ME THE MONEY يا XAUMO…
بس بالعقل، وبريسـك مانجمنت، ومن غير ولا وعد كدب.

XAUMO MEGABAR Detector]XAUMO MegaBar Detector – Breakout Candle Identification Tool
Purpose:
The XAUMO MegaBar Detector is built to highlight rare, high-impact candles where strong price movement and high trading volume occur together. These moments often reflect aggressive market activity and can be used to confirm potential breakouts or reversals.
How It Works (High-Level Overview)
The tool continuously monitors two primary conditions:
Price Expansion – Identifies large-bodied candles compared to recent averages.
Volume Expansion – Confirms that the move is supported by above-average trading activity.
When both conditions are present, the candle is marked:
🟢 Mega Bull – Strong bullish pressure.
🔴 Mega Bear – Strong bearish pressure.
Key Features
Automatic Timeframe Adjustment – Detection sensitivity changes based on chart timeframe, so results stay relevant from 1-minute scalps to multi-day swing setups.
Clear Visual Output – Significant candles are highlighted directly on the chart for easy recognition.
Optional Labels – Toggle on/off text labels (“Mega Bull” / “Mega Bear”) for a cleaner chart view.
Alert Integration – Set TradingView alerts to be notified immediately when a qualifying candle appears.
Universal Compatibility – Works on Forex, Commodities, Indices, Crypto, Stocks, ETFs, and Futures.
Practical Uses for Traders
As a confirmation tool when price approaches support/resistance or Fibonacci levels.
To filter low-quality setups by focusing only on moments where both price and volume confirm the move.
As part of a trend-following or breakout strategy when combined with other analysis methods.
Using the Indicator
Add the indicator to any chart and select your preferred timeframe.
Watch for highlighted candles – they indicate significant combined momentum and liquidity.
Use as a signal filter or confirmation alongside your existing trading system.
Optional: Set alerts to receive push/email/webhook notifications.
===================================
📌 MEGA BAR TRADING CHEAT SHEET
Spot Big Money. Ride the Move.
===================================
🧠 WHAT’S A MEGA BAR?
A Mega Bar is a candle so big it makes the rest look tiny — and it often means institutions are making a move.
Check the 4 Rules:
✅ Body size ≥ 2x average
✅ High relative volume (vs. last 20 bars)
✅ Closes near high (bull) or low (bear)
✅ Comes after sideways chop or price squeeze
📈 WHY IT MATTERS
Mega Bars = intent, not random spikes.
🟢 Mega Bull near support/Fib pullback → Likely accumulation
🔴 Mega Bear near resistance/Fib extension → Likely distribution or trap
🔧 HOW TO TRADE IT
1. WAIT FOR IT
No Mega Bar → No trade.
Mega Bull (big green) → BUY bias.
Mega Bear (big red) → SELL bias.
2. FIND THE SPOT
Fib levels: 61.8% / 78.6% / 138.2%
Major Support/Resistance
3. CONFIRM ON BIGGER TIMEFRAME
Example: 15M Mega Bar → Check 1H trend direction.
4. SET YOUR LEVELS
Stop-Loss:
Long → Below Mega Bull low (+0.2×ATR)
Short → Above Mega Bear high (+0.2×ATR)
Take-Profit:
Fib extensions: 127.2% / 161.8% / 261.8%
Prior highs/lows
5. RISK SMART
Risk 1–2% max per trade
Aim for 2:1+ R:R
🌍 WORKS ON:
Forex • Commodities • Stocks • Crypto • Indices
THE RETAILER’S FORMULA:
🟢 Big Green → Buy
🔴 Big Red → Sell
🎯 Fibs = Payday
One setup. One signal. Discipline = profit.

XAUMOvisionXAUMOvision: T he XAU/USD Composite Correlation Indicator with Weighted Spillover & Dynamic Lines
XAUMOvision is a custom-built trading indicator designed to track the intricate relationship between XAU/USD (Gold) and key economic factors: DXY (US Dollar Index), US Treasury Yields, S&P 500, and Crude Oil. By blending correlation metrics with weighted spillover effects, XAUMOvision offers actionable insights to refine your Gold trading strategy.
Core Features of XAUMOvision
1. Correlation (CC)
Definition: Measures how closely two assets move together over a given period.
Calculation: Pearson Correlation is used to assess Gold's relationship with:
DXY: Negative correlation—when DXY rises, Gold typically falls.
US Treasury Yields: Negative correlation—higher yields reduce Gold’s appeal.
S&P 500: Opposite movement, as Gold acts as a safe-haven.
Crude Oil: Positive correlation—both often rise during inflationary pressures.
2. Weighted Spillover
What It Does: Quantifies how movements in each asset (DXY, Yields, etc.) influence Gold.
Weighting: User-defined values (e.g., DXY weight = 0.4) scale each factor’s impact.
Result: A total spillover score reveals bullish or bearish sentiment for XAU/USD.
3. Composite Bias Line
Purpose: Consolidates spillover impacts into a single sentiment indicator.
Readings:
Strong Bullish: Composite Bias > 0.5.
Neutral: Close to 0.
Strong Bearish: Composite Bias < -0.5.
Output: A directional bias to guide your trading decisions.
4. Traffic Signal Line
Visual Cues:
Green: Strong Bullish Signal.
Red: Strong Bearish Signal.
Gray: Neutral—avoid trading.
Utility: A quick, color-coded overview of market conditions.
Using XAUMOvision Effectively
When to Use
During high volatility or major news events (e.g., CPI, interest rate decisions).
To understand macroeconomic forces driving Gold’s price action.
Recommended Timeframes
4-Hour: Ideal for swing traders seeking medium-term setups.
Daily: Perfect for macro trend analysis.
Weekly: Suitable for long-term investors aligning with broader trends.
---------------------------------------------------------------------------------
Practical Example
Monday, January 13, 2025 (Neutral Market)
Market Behavior: Gold stagnated (-0.96%), with low volume (681.13K).
Indicator Insights:
Composite Spillover: -0.92 (mild bearish pressure).
Traffic Signal Line: Gray—stay out of the market.
Bias Line: Weak Bearish (-1), signaling no strong trend.
Result: XAUMOvision kept traders from entering a choppy, low-volume market.
Wednesday, January 15, 2025 (CPI-Driven Rally)
CPI Release: Core CPI softer than expected (0.2% vs. 0.3%), weakening the DXY and Yields. Gold surged.
Indicator Insights:
Composite Spillover: +0.57 (strong bullish sentiment).
Traffic Signal Line: Green—clear buy signal.
Bias Line: Strong Bullish (+2), confirming the trend.
Result: Traders aligned with institutional flows and profited from the CPI-driven rally.
--------------------------------------------------------------------------------
Why XAUMOvision Stands Out
Avoids Bad Trades: Neutral signals and low-volume days keep you sidelined during indecisive markets.
Pinpoints Big Moves: Green signals during high-impact events help you capitalize on major trends.
Volume Validation: Confirms institutional activity to distinguish real trends from fakeouts.
Conclusion: Trade Like a Pro
XAUMOvision blends macroeconomic analysis with real-time technical indicators, ensuring you stay ahead of market moves. Whether navigating neutral markets or CPI-driven surges, this tool provides clarity and confidence in your trading decisions. For swing traders and macro enthusiasts, XAUMOvision is the ultimate weapon in Gold trading.

MACD-all in one_Pro[vn]👉 Hello traders.
Introducing the "MACD-All-in-One" indicator including functions:
• Automatically scan MACD-Histogram divergence
• Automatically scan MACD-Histogram divergence-missing right shoulder
• Automatically scan the Engulfing candlestick pattern when the MACD line crosses the Signal line
• Automatically create warnings when there are signals of Regular divergence, missing right shoulder divergence, Engulfing candlestick pattern
Explain:
💥1. Regular divergence
1.1 Bullish divergence
+ The price creates the next bottom lower than the previous bottom
+ The histogram of the next bottom is higher than the previous bottom and is located below the 0 axis (between the two histogram bottoms there must be a histogram located on the 0 axis for clear distinction)(Hình 1)👇👇
1.2 Bearish divergence
+ The price creates a higher peak than the previous peak
+ The histogram of the next bottom is lower than the previous bottom and is above the 0 axis (between the two histogram peaks there must be a histogram below the 0 axis for clear distinction)(Hình 2)👇👇
💥2. Divergence lacking right shoulder
2.1 Bullish divergence missing the right shoulder
+ The price creates the next bottom lower than the previous bottom
+ The histogram of the posterior bottom does not form and the histogram is still above the zero line (only the histogram of the previous bottom is below the zero line)
+ The meaning is that when the price creates a lower bottom but the buying force is already very strong, the histogram of the next bottom does not form and the price will increase(hình 3&4)👇👇
2.2 Bearish divergence missing the right shoulder
+ The price creates a higher peak than the previous peak
+ The histogram of the next peak does not form and the histogram is still below the zero line (only the histogram of the previous peak is on the zero line)
+ The meaning is that when the price creates a higher peak but the buying force has weakened, the histogram of the next bottom does not form and the price will go down.(hình 5 & 6)👇👇
💥3. Engulfing candlestick pattern
When the MACD and Signal lines intersect and there appears a pair of engulfing (completely) candlesticks, that candlestick will be marked as 'E⌃' in green (bullish engulfing) or 'E⌄' in red (Bearish engulfing)(hình 7 & 8)👇👇
💥4. Automatic alerts include 5 levels: Bull, Bear, Bullish Engulfing, Bearish Engulfing, bullish divergence missing the shoulder, bearish divergence missing the shoulder
//-------------------------Extra feature: Impulse System
This indicator also includes the “Impulse System”. The Impulse System is based on two indicators, a 13-day exponential moving average and the MACD-Histogram, and identifies inflection points where a trend speeds up or slows down. The moving average identifies the trend, while the MACD-Histogram measures momentum. This unique indicator combination is color coded into the price bars or macd histogram bars for easy reference.
Calculation:
Green Price Bar: (13-period EMA > previous 13-period EMA) and
(MACD-Histogram > previous period's MACD-Histogram)
Red Price Bar: (13-period EMA < previous 13-period EMA) and
(MACD-Histogram < previous period's MACD-Histogram)
Histogram bars are colored blue when conditions for a Red Histogram Bar or Green Histogram Bar are not met. The MACD-Histogram is based on MACD(12,26,9).
The Impulse System works more like a censorship system. Green histogram bars show that the bulls are in control of both trend and momentum as both the 13-day EMA and MACD-Histogram are rising (you don't have permission to sell). A red histogram bar indicates that the bears have taken control because the 13-day EMA and MACD Histogram are falling (you don't have permission to buy). A blue histogram bar indicates mixed technical signals, with neither buying nor selling pressure predominating (either both buying or selling are permitted).
-------------------------------//
💥5. Additional:
+Shows a pair of EMA12 vs EMA24.
+Shows Keltner Channels (using ATR) are volatility-based envelopes set above and below an exponential moving average.
//-------------------------------------------------------------------------------------------------------------//
✍️Conclude:
From this indicator there are 3 ways to trade:
• Method 1: Enter an order following the automatic Bull or Bear signal when the indicator appears
• Method 2: Enter an order following the automatic signal of the green vertical line (Long) or the red vertical line (Short) when the indicator appears
• Method 3: Enter orders according to the pair of engulfing candles 'E⌃' or 'E⌄' (because this is a combination of the method of engulfing candles and 2 MA lines intersecting each other)
• From this indicator, I created a "bot" that scans for "right shoulder missing divergence" signals for 40 trading pairs at the same time in real time. (hình 9)👇👇👇
//---------------------------------------------------------------------------------------------------------------
👉 Xin chào trader Việt Nam.
Giới thiệu chỉ báo "MACD-Tất cả trong một " bao gồm các chức năng:
• Tự động quét phân kì MACD-Histogram
• Tự động quét phân kì MACD-Histogram-thiếu vai phải
• Tự động quét mô hình nến nhấn chìm(Engulfing) khi đường MACD cắt đường Signal
• Tự động tạo cảnh báo khi có tín hiệu phân kì thường(Regular) , phân kì thiếu vai phải, mô hình nến Engulfing
Diễn giải:
💥1. Phân kì thường
1.1 Phân kì tăng
+ Giá tạo đáy sau thấp hơn đáy trước
+ Histogram của đáy sau cao hơn đáy trước và nằm bên dưới trục số 0(giữa hai đáy histogram phải có histogram nằm trên trục số 0 để phân biệt rõ ràng)(Hình 1 bên trên)☝️☝️
1.2 Phân kì giảm
+ Giá tạo đỉnh sau cao hơn đỉnh trước
+ Histogram của đáy sau thấp hơn đáy trước và nằm trên trên trục số 0(giữa hai đỉnh histogram phải có histogram nằm dưới trục số 0 để phân biệt rõ ràng)(Hình 2 bên trên)☝️☝️
💥2. Phân kì thiếu vai phải
2.1 Phân kì tăng thiếu vai phải
+ Giá tạo đáy sau thấp hơn đáy trước
+ Histogram của đáy sau không hình thành và histogram vẫn nằm bên trên trục số 0(chỉ có histogram của đáy trước dưới trục số 0)
+ Ý nghĩa rằng khi giá tạo đáy sau thấp hơn nhưng lực mua đã rất mạnh làm cho histogram đáy sau không hình thành và giá sẽ tăng lên(Hình 3 vs 4 bên trên)☝️☝️
2.2 Phân kì giảm thiếu vai phải
+ Giá tạo đỉnh sau cao hơn đỉnh trước
+ Histogram của đỉnh sau không hình thành và histogram vẫn nằm bên dưới trục số 0(chỉ có histogram của đỉnh trước trên trục số 0)
+ Ý nghĩa rằng khi giá tạo đỉnh sau cao hơn nhưng lực mua đã yếu dần làm cho histogram đáy sau không hình thành và giá sẽ đi xuống(Hình 5 vs 6 bên trên)☝️☝️
💥3.mô hình nến nhấn chìm
Khi hai đường MACD và Signal cắt nhau mà tại đó xuất hiện cặp nến nhấn chìm (hoàn toàn) thì trên thanh nến đó sẽ đánh dấu là 'E⌃' màu xanh (nhấn chìm tăng) hay 'E⌄' màu đỏ(nhấn chìm giảm)(Hình 7 vs 8 bên trên)☝️☝️
💥4. Cảnh báo tự động bao gồm có 5 mức : Bull, Bear, Bullish Engulfing, Bearish Engulfing, phân kì tăng thiếu vai, phân kì giảm thiếu vai
//--------------------Tính năng bổ sung: Hệ thống Impulse(xung)
Chỉ báo này cũng bao gồm “Hệ thống xung”. Hệ thống Impulse dựa trên hai chỉ báo, đường trung bình động hàm mũ EMA13 và Biểu đồ MACD, đồng thời xác định các điểm uốn trong đó xu hướng tăng tốc hoặc chậm lại. Đường trung bình động xác định xu hướng, trong khi biểu đồ MACD đo động lượng. Sự kết hợp chỉ báo độc đáo này được sơn thanh biểu đồ macd-histogram để dễ tham khảo.
Phép tính:
Thanh giá xanh lá : (EMA13 kỳ > EMA 13 kỳ trước đó) và (histogram sau > histogram trước)
Thanh giá màu đỏ: (EMA13 kỳ < EMA 13 kỳ trước đó) và (histogram sau < histogram trước)
Thanh biểu đồ có màu xanh lam khi các điều kiện cho histogram màu đỏ hoặc histogram màu xanh lá không được đáp ứng. Biểu đồ MACD dựa trên MACD(12,26,9).
Lưu ý: Hệ thống Impulse hoạt động giống một hệ thống kiểm duyệt hơn. Các thanh biểu đồ màu xanh lá cho thấy phe bò đang kiểm soát cả xu hướng và động lượng vì cả EMA13 và MACD-Histogram đều tăng (bạn không được phép bán). Thanh biểu đồ màu đỏ cho biết phe gấu đã nắm quyền kiểm soát vì biểu đồ EMA13 và MACD histogram đang giảm (bạn không được phép mua). Thanh biểu đồ màu xanh lam biểu thị các tín hiệu kỹ thuật hỗn hợp, không có áp lực mua và bán chiếm ưu thế (cho phép cả mua hoặc bán).
-------------------------//
💥5. Bổ sung:
+ Hiển thị một cặp EMA12 vs EMA24.
+ Hiển thị Kênh Keltner (sử dụng ATR) là các đường bao dựa trên mức độ biến động được đặt ở trên và dưới đường trung bình động hàm mũ.
//----------------------------------------------------------------------------------------------------------------//
✍️Kết luận:
Từ chỉ báo này có 3 cách giao dịch:
• Cách 1: Vào lệnh theo tín hiệu tự động Bull hoặc Bear khi chỉ báo hiện ra
• Cách 2: Vào lệnh theo tín hiệu tự động đường dọc xanh(Long) hoặc đường dọc đỏ(Short) khi chỉ báo hiện ra
• Cách 3: Vào lệnh theo cặp nến nhấn chìm 'E⌃' hay 'E⌄'(vì đây là tổng hợp từ phương pháp của nến nhấn chìm và 2 đường MA cắt nhau)
• Từ chỉ báo này tôi có lập nên "con bot" quét tín hiệu "phân kì thiếu vai phải " cùng lúc 40 cặp giao dịch theo thời gian thực. (Hình 9 bên trên)☝️☝️☝️

MACD-Histogram Divergence missing right shoulder_Pro[vn]👉Hello Traders!
Many traders have asked me about MACD's Histogram divergence, how to use it effectively, because the signal occurs a lot, I suddenly remembered the famous book by Dr. Alexander Elder's "Two Roads Diveged" has an introduction and definition of "MACD Histogram divergence lacking the right shoulder". It is an extremely strong signal of reversal divergence and it is difficult to determine, mainly experienced traders discover it.
- From that book, I wrote the code for the indicator "MACD Histogram divergence lacking the right shoulder" so that it automatically scans over 40 trading codes and when a signal appears I can identify it.
- For the MACD-Histogram signal to have bullish divergence (Regular) occur when:
+ The price creates the next bottom lower than the previous bottom
+ The histogram of the next bottom is higher than the previous bottom and is below the 0 axis (between the two histogram bottoms there must be a histogram on the 0 axis for clear distinction)👇👇👇(Hình 1)
- For MACD-Histogram signal to have bearish divergence (Regular) occur when:
+ The price creates a higher peak than the previous peak
+ The histogram of the next bottom is lower than the previous bottom and is on the 0 axis (between the two histogram peaks there must be a histogram below the 0 axis for clear distinction)👇👇👇(Hình 2)
💥 So to go from MACD-Histogram to regularization to right shoulder missing increase divergence is when:
+ The price of creating the following bottom is lower than the previous bottom
+ The histogram of the back bottom does not form and the histogram remains on the zero axis (only the histogram of the previous bottom is below the zero axis)
+ It means that when the price creates a lower bottom but the buying force is very strong, the posterior bottom histogram does not form and the price will increase 👇👇👇(Hình 3)
💥 So to go from MACD-Histogram to regularized divergence to right shoulder deficiency divergence is when:
+ The price creates the following peak higher than the previous peak
+ The histogram of the posterior vertex does not form and the histogram remains below the zero axis (only the histogram of the anterior vertex is above the zero axis)
+ It means that when the price creates a higher peak but the buying force has weakened, the posterior bottom histogram does not form and the price will go down 👇👇👇(Hình 4)
//-------------------------Extra feature: Impulse System
This indicator also includes the “Impulse System”. The Impulse System is based on two indicators, a 13-day exponential moving average and the MACD-Histogram, and identifies inflection points where a trend speeds up or slows down. The moving average identifies the trend, while the MACD-Histogram measures momentum. This unique indicator combination is color coded into the price bars or macd histogram bars for easy reference.
Calculation:
Green Price Bar: (13-period EMA > previous 13-period EMA) and
(MACD-Histogram > previous period's MACD-Histogram)
Red Price Bar: (13-period EMA < previous 13-period EMA) and
(MACD-Histogram < previous period's MACD-Histogram)
Histogram bars are colored blue when conditions for a Red Histogram Bar or Green Histogram Bar are not met. The MACD-Histogram is based on MACD(12,26,9).
The Impulse System works more like a censorship system. Green histogram bars show that the bulls are in control of both trend and momentum as both the 13-day EMA and MACD-Histogram are rising (you don't have permission to sell). A red histogram bar indicates that the bears have taken control because the 13-day EMA and MACD Histogram are falling (you don't have permission to buy). A blue histogram bar indicates mixed technical signals, with neither buying nor selling pressure predominating (either both buying or selling are permitted).
-------------------------------//
- When on the MACD indicator, the Histogram bars of the current price are the color, then the corresponding cell |0| shows that color, because I define |0| as the current candle.
|1| is the candle preceding the current candle |0|
|2| is the candle immediately preceding candle |1|
|3| is the candle immediately preceding candle |2|
from cells |3| |2| |1| |0| so that traders know that the cell colors green, blue, and red correspond to the colors of the histogram bar and when there is a signal to enter a Long order. '🅻', Short '🆂' will display on those cells.
- When the Bot identifies a divergence lacking the right shoulder, the "Result" cell will be displayed corresponding to "Long" - bullish divergence or "Short" - bearish divergence.👇👇👇(Hình 5)
- When the trader hovers over the "Long" or "Short" cell, a tooltip will be displayed indicating the order entry time, order entry price, stoploss point(Stl), stoploss percentage(%Stl), current price (C.price), previous peak and low Histogram counts (Hist +, Hist -) and the number of Histogram bars when entering the order. From there, traders can filter out the best signals to enter orders.👇👇👇(Hình 6)
- When the entry point is in the same trend as the price with a given profit percentage, it will display a profit, and when the above two MACD and Signal lines intersect, it will notify the Trader to take profit '✅', otherwise when entering Orders that go against the price trend will be reported to exit the order early '❌' 👇👇👇(Hình 7)
- When the MACD and Signal lines intersect and there appears a pair of engulfing candles (completely), the box will be marked as 'E⌃' (bullish engulfing) or 'E⌄' (bearish engulfing) plus add % of the engulfing candle body 👇👇👇 (Hình 8)
- There are 6 smart warning functions to find the right target including: 'Long', 'Short', 'Long-Short', 'Take Profit', 'Stoploss', 'All' . Where 'All' includes all 5 preceding warnings
--------------------------------------------------------------------------------------------------------------
✍️ Conclude:
From this indicator there are 2 ways to trade:
+ Method 1: Enter an order following the automatic Long or Short signal when the indicator appears
+ Method 2: Enter orders according to the pair of engulfing candles 'E⌃' or 'E⌄' (because this is a combination of the method of engulfing candles and 2 MA lines intersecting each other)
--------------------------------------------------------------------------------------------------------
Vietnamese
👉 Xin chào các Trader Việt Nam
Rất nhiều nhà giao dịch có hỏi tôi về phân kì Histogram của MACD làm sao để sử dụng hiệu quả, vì tín hiệu xảy ra rất nhiều, tôi chợt nhớ đến cuốn sách nổi tiếng của tiến sĩ Dr. Alexander Elder là " Two Roads Diveged " có giới thiệu và cách xác định về "phân kì MACD Histogram thiếu vai phải". Nó là tín hiệu cực mạnh về phân kì đảo chiều và rất khó để xác định, chủ yếu trader có kinh nghiệm mới phát hiện ra nó.
- Từ sách đó tôi có viết codes về chỉ báo "phân kì MACD Histogram thiếu vai phải" để nó tự động quét trên 40 mã giao dịch và khi có tín hiệu xuất hiện tôi có thể xác định được nó.
- Để tín hiệu MACD-Histogram phân kì tăng (Regular) xảy ra khi:
+ Giá tạo đáy sau thấp hơn đáy trước
+ Histogram của đáy sau cao hơn đáy trước và nằm dưới trục số 0(giữa hai đáy histogram phải có histogram nằm trên trục số 0 để phân biệt rõ ràng) (Hình 1 bên trên)☝️☝️☝️
- Để tín hiệu MACD-Histogram phân kì giảm (Regular) xảy ra khi:
+ Giá tạo đỉnh sau cao hơn đỉnh trước
+ Histogram của đáy sau thấp hơn đáy trước và nằm trên trục số 0(giữa hai đỉnh histogram phải có histogram nằm dưới trục số 0 để phân biệt rõ ràng) (Hình 2 bên trên)☝️☝️☝️
💥 Vậy để từ MACD-Histogram phân kì tăng (pk thường) trở thành phân kì tăng thiếu vai phải là khi :
+ Giá tạo đáy sau thấp hơn đáy trước
+ Histogram của đáy sau không hình thành và histogram vẫn nằm trên trục số 0(chỉ có histogram của đáy trước dưới trục số 0)
+ Ý nghĩa rằng khi giá tạo đáy sau thấp hơn nhưng lực mua đã rất mạnh làm cho histogram đáy sau không hình thành và giá sẽ tăng lên (Hình 3 bên trên) ☝️☝️☝️
💥 Vậy để từ MACD-Histogram phân kì giảm (regular) trở thành phân kì giảm thiếu vai phải là khi :
+ Giá tạo đỉnh sau cao hơn đỉnh trước
+ Histogram của đỉnh sau không hình thành và histogram vẫn nằm dưới trục số 0(chỉ có histogram của đỉnh trước trên trục số 0)
+ Ý nghĩa rằng khi giá tạo đỉnh sau cao hơn nhưng lực mua đã yếu dần làm cho histogram đáy sau không hình thành và giá sẽ đi xuống (Hình 4 bên trên) ☝️☝️☝️
//--------------------Tính năng bổ sung: Hệ thống Impulse(xung)
Chỉ báo này cũng bao gồm “Hệ thống xung”. Hệ thống Impulse dựa trên hai chỉ báo, đường trung bình động hàm mũ EMA13 và Biểu đồ MACD, đồng thời xác định các điểm uốn trong đó xu hướng tăng tốc hoặc chậm lại. Đường trung bình động xác định xu hướng, trong khi biểu đồ MACD đo động lượng. Sự kết hợp chỉ báo độc đáo này được sơn thanh biểu đồ macd-histogram để dễ tham khảo.
Phép tính:
Thanh giá xanh lá : (EMA13 kỳ > EMA 13 kỳ trước đó) và (histogram sau > histogram trước)
Thanh giá màu đỏ: (EMA13 kỳ < EMA 13 kỳ trước đó) và (histogram sau < histogram trước)
Thanh biểu đồ có màu xanh lam khi các điều kiện cho histogram màu đỏ hoặc histogram màu xanh lá không được đáp ứng. Biểu đồ MACD dựa trên MACD(12,26,9).
Lưu ý: Hệ thống Impulse hoạt động giống một hệ thống kiểm duyệt hơn. Các thanh biểu đồ màu xanh lá cho thấy phe bò đang kiểm soát cả xu hướng và động lượng vì cả EMA13 và MACD-Histogram đều tăng (bạn không được phép bán). Thanh biểu đồ màu đỏ cho biết phe gấu đã nắm quyền kiểm soát vì biểu đồ EMA13 và MACD histogram đang giảm (bạn không được phép mua). Thanh biểu đồ màu xanh lam biểu thị các tín hiệu kỹ thuật hỗn hợp, không có áp lực mua và bán chiếm ưu thế (cho phép cả mua hoặc bán).
-------------------------//
- Khi trên chỉ báo MACD những thanh Histogram của giá hiện tại là màu gì thì tại ô(cell) |0| tương ứng thể hiện màu đó, bởi vì tôi định nghĩa |0| là cây nến hiên tại.
|1| là nến đứng trước liền kề nến hiện tại |0|
|2| là nến đứng trước liền kề nến |1|
|3| là nến đứng trước liền kề nến |2|
từ những ô |3| |2| |1| |0| để trader biết rằng màu ô(cell) xanh lá , xanh lam, đỏ tương ứng với những màu của thanh histogram và khi có tín hiệu vào lệnh Long '🅻', Short '🆂' sẽ hiển thị trên những ô đó.
- Khi Bot xác định được phân kì thiếu vai phải thì tại ô(cell) "Result" sẽ hiển thị tương ứng với "Long"- phân kì tăng giá hoặc "Short"- phân kì giảm giá (Hình 5 bên trên) ☝️☝️☝️
- Khi trader di chuột vào tại ô(cell) "Long", hoặc "Short" thì tại đó hiển thị tooltip cho biết thời gian vào lệnh, giá vào lệnh , điểm stoploss(Stl), phần trăm stoploss(%Stl),giá hiện tại(C.price), số đếm Histogram đỉnh đáy trước(Hist +, Hist -) và số thanh Histogram khi vào lệnh.Từ đó trader có thể lọc ra được những tín hiệu đẹp nhất để vào lệnh (Hình 6 bên trên) ☝️☝️☝️
- Khi điểm vào lệnh cùng xu hướng với giá mà đã cho % lời thì nó sẽ hiển thị được lợi nhuận, và đến khi hai đường MACD và Signal trên cắt nhau thì sẽ báo Trader nên chốt lời '✅', ngược lại khi vào lệnh ngược với xu hướng giá thì sẽ báo thoát lệnh sớm '❌' (Hình 7 bên trên) ☝️☝️☝️
- Khi hai đường MACD và Signal cắt nhau mà tại đó xuất hiện cặp nến nhấn chìm (hoàn toàn) thì trên ô đó sẽ đánh dấu là 'E⌃' (nhấn chìm tăng) hay 'E⌄'(nhấn chìm giảm) cộng thêm % của thân nến nhấn chìm (Hình 8 bên trên) ☝️☝️☝️
- Có 6 chức năng cảnh báo thông minh tìm đúng đối tượng bao gồm:'Long', 'Short', 'Long-Short', 'Take Profit', 'Stoploss', 'All'
trong đó 'All' là bao gồm toàn bộ 5 cảnh báo đứng trước đó
---------------------------------------------------------------------------------------------------------------------
✍️ Kết luận:
Từ chỉ báo này có 2 cách giao dịch:
+ cách 1: Vào lệnh theo tín hiệu tự động Long hoặc Short khi chỉ báo đưa ra
+ cách 2: Vào lệnh theo cặp nến nhấn chìm 'E⌃' hay 'E⌄'(vì đây là tổng hợp từ phương pháp của nến nhấn chìm và 2 đường MA cắt nhau)
