MKAST V2 (monthly)PLEASE READ THE ENTIRE POST BEFORE PURCHASING & USING THE MKAST Algorithm. Saves you and me some time in emails and messages. :)
This is the NEW MONTHLY ACCESS Version of the MKAST
The MKAST Buy Sell Algorithm is a very specific strategy, cut down to its roots and made perfect for the volatile crypto market.
Many Algorithms focus only on one aspect, one side, one specific rule.
As you know, this is not how life, the market or anything else works.
MKAST combines many different aspects at the same time, scans multiple other Algorithms and comes to a conclusion based on over 1350 lines of code.
It is based on Divergences, Elliott Waves , Ichimoku , MACD , MACD Histogram, RSI , Stoch , CCI , Momentum, OBV, DIOSC, VWMACD, CMF and multiple EMAs.
Every single aspect is weighted into the decision before giving out an indication.
Most buy/sell Algorithms FAIL because they try to apply the same strategy to every single chart, which
are as individual as humans.
To conquer this problem, MKAST has a wide range of settings and variables which can be easily
modified.
To make it a true strategy, MKAST has as well settings for Take Profit Points, Multiple Entries and Stop
Losses. Everything with an Alert Feature of course.
I know from experience that many people take one Algorithm and are simply too LAZY to add multiple Algorithms to make a rational choice.
The result of that is that they lose money, by following blatantly only one Algorithm.
MKAST has additional 9 Indicators, perfect for the crypto market, which can be turned on and off.
Manual
MKAST Signals Settings
“Show Signals?” - On/Off to show the Buy/Sell Signals.
“Aggressiveness” - Increase to make the signals less aggressive and decrease to make them more aggressive.
“Show Custom Signals?” - On/Off to show custom MKAST Signals as chosen in the settings below.
“Custom Buy/Sell Aggressiveness” - Choose a custom Aggressiveness for each buy and sell signal individually.
“TJ-Index Requirement For Buy/Sell” - If the TJ-Index is below the given number, it will show the signal in grey, this also applies for normal signals. Buy 0 and Sell 15 shows all signals in their original colour again.
“Don’t show signals that don’t meet index requirement?” - Checked, it will completely not show signals which would be “grey” as in the explanation above.
“Change Backgroundcolour if index is at 15 or 0?” - Checked, changes the colour of the chart if the index is at 15 or 0 points
MKAST Panel Settings
“Show Info Panel?” - Shows Info Panel on the chart.
“Move Info Panel UP by %” - Moves Info Panel up/down.
“Move Info Panel Left/Right ” - Moves Info Panel Left/Right.
“Show BitMEX Panel?” - Shows BitMEX Panel on the chart.
“Move BitMEX Panel by % ” - Moves BitMEX Panel up/down.
“Move BitMEX Panel Left/Right” - Moves BitMEX Panel Left/Right. “Signal Source” - Choose source of candle open/close for Equity calculation.
“Leverage Used?” - Select the used Leverage for your strategy and Equity calculation.
“Fees Per Trade in % ” - Deducts these fees after each trade from Equity calculation.
“Round Current Profit Price?” - Rounds the number on the Panel. “Trading Periods ” - Choose a trading Period which will be used to calculate Period Equity.
“Show separations of each Trading Period?” - Show separations on the chart of each Trading Period.
The very new feature on Tradingview and obviously now as well on MKAST are Information Panels.
I have chosen to add an Info Panel and a BitMEX Price Panel into MKAST, to make live and even
backtesting easier.
With only one blink of an eye the user is able to see ALL relevant information, without having to go
through various ways of checking and using other tools.
The Info Panel:
The first row shows the current profit. This is calculated since the signal initiation and the current candle close. Followed by a single number, which represents the current TJ-Index, removing the need of having to add the actual TJ-Index Oscillator on the chart.
The second row shows the current position and its status. This was added on request of many users wanting to know if their position is “about to change” or not. The status shows the users if the position is “endangered” or “okay”.
Followed by the “backtesting tool” already included inside the Panel. No need for complex oscillators with a hard reading for backtesting. With this one and simple panel, you see the Period Equity for the period chosen previously in the settings. This calculates all profits made inside that period and re-sets when the period ends. Right next to it, the Total Equity calculating ALL profits since the beginning of the chart.
Right below, you see the information about the last long and short position which have been open. This helps with the evaluation and documentation of the last trade.
The BitMEX Panel:
A convenient panel which shows all BitMEX contracts and their LIVE prices. The need for opening each chart goes away, the quality and experience of trading increases.
MKAST custom Signals are one of the notorious possibilities for ADVANCED strategies with MKAST.
Users who requested these features and use them frequently are the ones, having already a very unique trading strategy and they use these very custom signals as confluence or for multiple entry trades.
These custom signals and their settings can be mostly ignored by the majority of traders who are using this Algorithm.
The idea behind the grey signals has its roots in the idea of the TJ-Index. The TJ-Index being 15 Algorithms and conditions possible showing a bullish or bearish interpretation. The index counts the Algorithms which are showing a bullish interpretation.
Like that we can make sure that signals are shown in the original colour, are only those who have an additional confluence with the TJ-Index, not letting the user buy, if at least the majority is not bullish , and not letting the user sell, if at least the majority is bearish .
The custom buy and sell aggressiveness lets the user customise the MKAST algorithm even more.
Either the users wants to see how signals are changing on a different (slightly lower or higher) aggressiveness, being able to expect a change on their own settings. OR seeing that some signals of the same sort are a little out of place and is able to move these to a different aggressiveness, increasing the profitability even more.
Needless to say, custom signals are NOT a part of the Info Panel.
MKAST Label & Trendline Settings
“Show Labels?” - On/Off to show Labels above each signal, with the percentage gain or loss, calculated from the last signal to the new signal.
“Show Trendlines?” - On/Off to show automatic Trendlines following Gainzy Lines.
“Lookback Length” - Choose a length that the automatic trendiness use for calculation. Comparable to Aggressiveness.
“Wicks//Bodies” - Change between trendiness connecting from wick to wick or from body to body.
“Black lines// Coloured lines” - Change between simply black lines or changing colour lines.
“Filter Trendlines?” - On/Off to show all trendiness or just resistance decreasing and support increasing ones.
“Limit Extensions Of The Lines?” - This value increases by how much the trendiness are being extended. 0 = endless extension, otherwise 100 = maximum custom extension.MKAST Strategy “Take Profit 1” - On/Off to show TP1 points.
“Take Profit After %” - Set the percentage after which TP1 is active.
“Take Profit 2 ” - On/Off to show TP2 points.
“Take Profit 2 After %” - Set the percentage after which TP1 is
active.
“Take Profit 3” - On/Off to show TP3 points.
“Take Profit 3 After %” - Set the percentage after which TP1 is active.
“Second Entry” - On/Off to show Second Entry points.
“Second Entry After %” - Set the percentage after which Second Entry is active.
“Third Entry” - On/Off to show Third Entry points.
“Third Entry After %” - Set the percentage after which Third Entry is active.
“Stop Loss” - On/Off to show Stop Loss points.
“Stop Loss After %” - Set the percentage after which Stop Loss is active.
MKAST Strategy
To make the life of the MKAST user even easier, I have added all adjustable Take Profit Points, Multiple entry points and Stop Loss points.
I have never seen a sustainable and reliable trading strategy without TPs, Multiple entry and especially without a stop loss. Everything in the usual and fully customisable MKAST style.
Simply choose how many Take Profit points you would like to have and choose the percentage after which you would like to see the Take Profit point appear on the chart and notify you to take profits.
Are you a Trader who likes Multiple Entries? Also no problem with MKAST. Select how many additional entries you would like to have and after how many percent you would like them to appear on the chart and remind you of adding to the position.
What would a Strategy be without a Stop Loss? Same settings apply here as on the TPs and MEs .
All of the settings are able to take fractions of a number as well. This enables users to even use all of the strategy settings for scalping or FX pairs, where high leverage and the smallest of moves are used for trading.
Needless to say, all of these settings work on RENKO and Heikin Ashi as well. These might need adjustment, since the calculation is different, yet there is nothing standing in the way of it anymore.
Crypto Modified Indicators
“Show Divergences?” - On/Off to show Divergences on the Chart based on the data of 10 different Algorithms.
“Show Oversold/bought?” - On/Off to change the colour of the chart in Oversold/bought conditions.
“Oversold/bought value?” - Choose a value for which the chart is Oversold/bought.
“Show Fibonacci Levels?” - On/Off to show automatic Fibonacci Levels.
“Fibonacci Lookback Lenght” - This value states how many candles from right now are taken into account to paint the Fibonacci Levels.
“Fibonacci Custom Period” - Choose a custom Timeframe that should be used to paint the Fibonacci Levels.
“2nd-7th Fibonacci Level” - Enter a value for the Fibonacci Levels you would like to use and see on the chart.
“Plot 1.618 Level?” - On/Off for the Fibonacci extension level.
Crypto Modified Indicators
“Show Bands?” - On/Off to show the TJ-Bands on the chart.
“Bands Length” - Choose a value for the TJ-Bands Lenght
“Show Show EMA 1-3?” - On/Off to show the EMAs 1-3 on the chart.
“EMA Lenght 1-3” - Choose a value for the first to third EMA Lenght
“Show Ichimoku? ” - On/Off to show Ichimoku on the chart.
“Show Tenkin?” - On/Off to show Tenkin on the chart. “Tenkin” - Set the lenght of the Tenkin.
“Show Kijun?” - On/Off to show Kijun on the chart.
“Kijun” - Set the lenght of the Kijun.
“Show Senkou?” - On/Off to show the Senkou on the chart. “Senkou” - Set the lenght of the Senkou.
“Displacement” - Set the value of the Displacement.
“Show Chikou Span?” - On/Off to show the Chikou Span on the chart.
Crypto Custom Indicators
In the picture above, you see the first pair of Crypto Custom Indicators. The oversold and overbought conditions are highlighted.
Bullish and Bearish divergences are also plotted on the chart.
This is personally my favourite combination of Indicators and MKAST settings. It shows nicely
everything one needs to know and makes it easier to decide wether to follow a signal or not.
We here as well a perfect example of the Automatic Fibonacci Lines (Lookback 50, Timeframe 1D).
It shows all significant levels, which we can see being respected.
Orange = 23.6%, Green = 38.2%, Red = 50%, Yellow = 61.8%, Blue = 78.6%, White = 0%;100%
In this picture above, we observe the perfect ensemble of MKAST and an EMA strategy, especially modified for crypto markets.
Here, as by default, we have the EMAs at 21, 90 and 200. These have shown to be very significant moving support and resistance points in the crypto market.
In this picture above, I lowered the timeframe to show the highly significant levels of the Ichimoku . It has not the “usual values”. These here have been modified for the volatile crypto market and set as default.
An incredibly powerful tool for anyone who is ready to step up their trading game. It is a huge part of the MKAST back end and the strategy behind it.
MKAST Custom Alerts
1
MKAST without any doubt has Custom Alerts for all Signals that it is painting on the chart.
One can even choose to receive custom notifications for Take Profit points, Multiple Entry points and
the Stop Loss points.
The signals appear on the chart DURING the candle, not at the end of the candle. Therefore, the
alerts do this as well. These appear during the candle.
Here we can see all of the possible Alerts that can be chosen to be displayed. In total it is 14 different custom alerts, based on what the trader is looking for and how he is trading.
Personally, I have 10-15 coins that I trade the most and for these I have custom notifications, mostly though only the MKAST Buy/Sell and Stop Loss Signals.
To activate Alerts for MKAST,
1) Go to the “ALERT” icon on the top tool bar of your Tradingview.
2) Select “CONDITION” as “—MKAST—“
3) Then choose ONE condition from the list of conditions.
4) On “OPTIONS” you can set how many times it appears, I have “Once per Bar”.
4.1) If you want to make sure that the signal is truly there and not just a condition for a second during the candle, choose “ONCE PER BAR CLOSE”.
5) “Expiration Time” sets the time until the alert expires. PRO users have no expiration for alerts.
6) “Alert Actions” give you a row of choices what happens and how you want to be notified.
7) “Message” is the message that you receive inside the notification.
Thank you, Kong
Cari dalam skrip untuk "ichimoku"

MDMADisplay two baselines of different time bars for ichimoku.
The two lines can display different time bars independently.

Currency Strength Gold MethodolgyThis script was written by, and used with the express permission of, Eduardo Andrade. The purpose of the script is easily determine respective currencies strength and weakness as utilized in The Gold Methodology - Ichimoku.
Tradingview members can use this script to see how each currency pair performed the day before as the reading is based is based upon the 11:00 p.m. GMT 60 minute candle (just before the Tokyo open).
Each currency is ranked in order of descending Strength and are designated by the following colors:
Orange = AUD
Green = CAD
Aqua = CHF
Purple = EUR
Red = GBP
Yellow = JPY
Black = NZD
Blue = USD
I hope you find he script beneficial and if you have any questions, please comment or send me a message.
have a great weekend!!
Allen

Popat Trend AlanyzerThis tool will help you analyze the trend where you determine when you have to enter and when exits with your Technical analysis, with this indicator you can easily spot if market is trending or ranging and can trade according to it. You can use it with any time frame, you can use it bigger time frames for accurate result coz there are lot of noise in smaller time frame, this is not a 100% working system but you can make money in trending market buy with proper risk management and discipline.
I have include multiple indicator in the one , The main benefit of this all in one indicator is that you can use all of the indicator one by one by turning of all other in one click so your chart looks clean and you can see the candles. And if you have FREE plan in Trading view where you can use only 3 indicators but with this you can use more than 3 in single chart, included indicator are Moving averages and ichimoku kinko hyo.
USE OF INDICATORS
1)7/30 Moving averages
This is default indicator with 7/30 MA and background ploting (you can remove background color) when you add POPAT TREND ANALYZER
2) 50/200 cross trend arrows at top n bottom
If you enable this check you will see black and red circles on the top and bottom of your chart, where BLACK CIRCLE at bottom indicate bullish crossover between 50/200 in pertucaler time frames and RED CIRCLE at the top indicate bearish 50/200 crossover, and you can on off it by one click, with this you can easily see the current trend or crossover of 50/200 MA without add both MAs.
3) Ichimoku T & K On/Off
Enable this if you want to add only Tenkan and kijun, many TA experts only use T&K crossover to determine their next trade. For more information about ichimoku you can search on the internet.
4) Ichimoku Cloud On/Off
If you enable this you can add only kumo cloud which is combination of senkou A & senkou B and ploting it in the future. Many people want to use kumo cloud without Tenkan and kijun and want to use the favorites Moving averages with it, they will defiantly love it.
4) SMA 50/100/200 On/Off
Here I have added 3 big Moving averages which is 50,100 and 200, in the FREE plan of trading view you can only 3 indicators and you have to remove one for add another one but now you can easily add it by single check to see the big trend quickly and hide it easily.
If you have any question or suggestions you can comment below.
Happy Trading.
Tensor Toolbox Overlay BetaThis purpose of this script is to test new features we might want to implement in Tensor Cloud (See: . Also, to work towards a full, all-in-one indicator solution (Tensor Toolbox). In this first version of Tensor Toolbox Overlay, we propose two new features for Tensor Cloud:
The Veil.
Ichimoku Weight/Smoothing.
The Veil is an RSI filter. The Ichimoku smoothing takes Ichimoku and averages it with Tensor Cloud. The Ichimoku feature will probably not make it into Tensor Cloud but Veil might. Tensor Cloud should remain as pure as possible. It's all up to your feedback. Initial features of Tensor Toolbox Overlay:
Tensor Cloud.
Support & Resistance.
MACD background.
Long & Short potentials.
Tensor Toolbox Overlay needs a lot more features yet to remain elegant. A second edition called Tensor Toolbox Oscillator is coming as well (Can only fit so much on the chart). The goal with both is to have a suite that takes the best of all indicators and provides easy decision making, for those who like to keep control. For Overlay, I also intend to duplicate the functionality of MTPredictor at a fraction of the cost. Feedback appreciated.
Enjoy :)

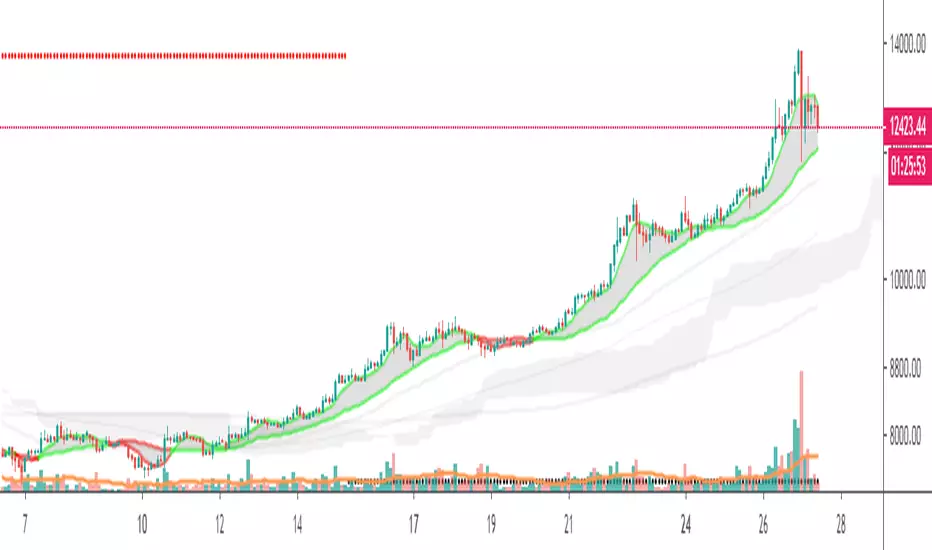
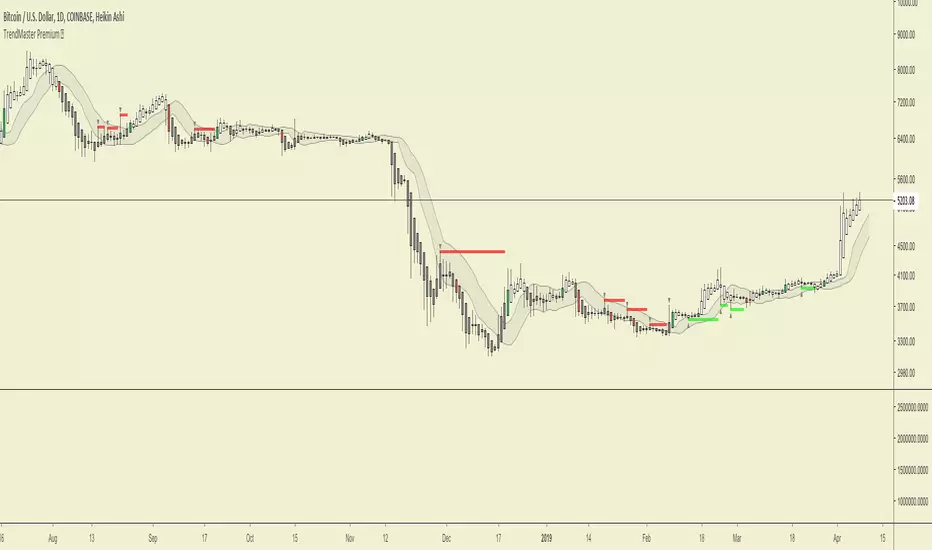
TrendMaster Premium ©Trendmaster Premium©
We are proud to release the final version of Trendmaster Premium©. This indicator is the result of months of development between @TrendmasterTM and @Crypto_C00kie.
Trendmaster Premium© is a Trend following system that provide entries, exits and stop loss placement. It is extremely simple to follow and we have experienced outstanding results.
When purchasing Trendmaster Premium© you will receive access to the indicator suite and access to our private members discord group.
Discord: The discord channel is a place where traders can discuss ideas and share content.
It includes
Bots – The discord channel currently has two bots that constantly scan Binance for signals. They will alert you by notification of any BTC pair that has printed a signal candle. Currently the bots report D1 and H4 signals as these are the time frames the indicator is designed for. These are designed to alert you to possible trades and should NOT be blindly traded from.
Chat – Several chat servers offering educational resources, guidance on how to use the indicator and chart/idea sharing.
The mandatory Legal bit:
@IchimokuScholar and @Crypto_C00kie wish you the best of luck in achieving your trading goals. Please apply appropriate risk management.
Any form of trading has large potential rewards but also large potential risks. The Purchaser must be aware of those risks and be willing to accept them. Don't trade with money that you, the Purchaser cannot afford to lose. No representation is being made that you are guaranteed positive results. The past performance of any trading methodology is not necessarily indicative of future results. Trading involves high risks. Neither @TrendmasterTM or @Crypto_C00kie are responsible for any trades that you, the Purchaser take. All trades taken are entirely at the Purchasers own risk. Refunds are neither offered nor implied.
NeoIchi
The idea of this oscillator / indicator came from Ichimoku , how it draws and how it calculates different averages in different scales.
The formula used for this indicator is totally different from Ichimoku , as you can compare the left and right charts, with same setting between my indicator and ichimoku , different results show up.
The inputs that you can use for this indicator/oscillator :
1- HLC3 (better to through it on the chart just like ichimoku
2- acceleration - deceleration (set the first parameter to 5 and the second to 34 for standard calculations)
3- pure volume
4- OBV ( On Balance Volume )
5- Bill Williams MFI ( Market Facilitation Index )
6- Momentum : This one can have different options : set with Barry Burn's formula and bar scale for when the charts are 1 to 3 ratio (B 3) or when they are not 1 to 3 (B), Bill William standard (W), Hybrid with barry's input (Would be bar close but I replaced it with HLC3, better results) but Bill William time scale for calculations (H), and finally, use Bill Williams MFI as input but use Barry Burn's time scales in formula (H M)
If you have any specific input in mind that you think would be nice to have in this system, through a comment bellow and I will add it to the system.
This oscillator / indicator is for sale, you can buy a life long licence that would include all updates with 0.01 BTC. Send the BTC + transaction fee to the wallet address bellow :
12EDAYA52DzcXdh9aLC9Pqqfhm1jNMjxNo
after sending the BTC , contact me in pm and send the transaction ID with your trading view's ID and I will give you access to this oscillator / indicator


Ghost Protocol [Bit2Billions]Ghost Protocol — Institutional RSI Intelligence Engine
*A unified RSI-based momentum-mapping system built on original logic, designed for professional-grade trend, reversal, and volatility analysis.*
Ghost Protocol is a momentum framework engineered to give traders a single, coherent view of trend strength, equilibrium shifts, reversals, volatility states, and momentum pressure across all time horizons.
It is not a mashup of public RSI indicators. Every module is built on proprietary RSI engines, ensuring consistency, originality, and practical trading value.
The script is designed to solve a frequent trader problem: RSI tools producing conflicting or isolated signals.
Ghost Protocol consolidates candles, divergences, adaptive zones, trend indexing, cloud states, and multi-timeframe momentum context into one synchronized ecosystem.
Ghost Protocol is driven by three custom systems:
1. Proprietary RSI Divergence Engine (Ghost Divergence Core)
This engine identifies momentum turning points using:
* Displacement-weighted RSI swing logic
* Real-time regular & hidden divergence validation
* Multi-layer swing scoring
* Pre-confirmation “Ghost Candidate” modeling
These outputs form the foundation for reversal detection, momentum shifts, and early trend-exhaustion signals.
This is not based on standard pivot matching or public divergence scripts.
2. Adaptive RSI Architecture (Volatility-Responsive Layer)
This system evaluates RSI behavior in a dynamic, market-adaptive sequence:
* Volatility-adjusted RSI zones
* Dynamic OB/OS thresholds
* Percentile-indexed trend strength
* Auto-drawn RSI support/resistance trendlines
This ensures RSI interpretation is not static or fixed, but evolves through continuously adaptive logic.
3. Momentum Cloud & Trend Pressure Engine
All RSI clouds, trend states, and regime changes respond to the Adaptive Layer, producing contextual momentum reading rather than isolated signals.
This includes:
* RSI Ichimoku-style cloud (equilibrium + displacement modeling)
* Real-time momentum shift structure
* Multi-timeframe relative trend index
* Pressure gradients & continuation/exhaustion bias
The result is a full RSI ecosystem—not a blend of unrelated tools.
Why This Script Has Genuine Value
TradingView requires originality, consistency, and practical use.
Ghost Protocol delivers this through:
✔ A unified RSI ecosystem
All modules connect to the same internal RSI engines, so the chart tells one consistent momentum story.
✔ Proprietary decision-making logic
Divergence detection, RSI zones, clouds, and trendlines use original formulas rather than built-ins or public logic.
✔ A visual-first trading workflow
All visuals are structured for institutional-style clarity:
* Trend continuation vs. exhaustion
* Divergence confirmation hierarchy
* Momentum pressure vs. equilibrium shift
* Cloud-based regime transitions
✔ Designed for traders who rely on narrative momentum reading
Ghost Protocol replaces:
* Manual divergence drawing
* RSI zone calibration
* Trendline plotting on RSI
* OB/OS state interpretation
* Multi-timeframe RSI comparison
* Momentum shift detection
* Volatility-adjusted trend reading
All in one coherent tool.
Key Components & Intent
RSI Candles (Standard & Heiken-Ashi)
Purpose: show momentum transitions with visual clarity and divergence readability.
Divergence Engine
Detects:
* Regular divergences
* Hidden divergences
* Pre-divergence Ghost Candidates
Purpose: identify trend exhaustion before price shows it.
Adaptive RSI Zones
Zones react to:
* Volatility
* Recent displacement
* Trend direction
Purpose: avoid static “fixed OB/OS” readings and provide more realistic thresholds.
RSI Ichimoku Cloud
Outputs include:
* Bull/bear cloud bias
* Momentum compression/expansion
* Equilibrium shifts
Purpose: reveal regime transitions inside RSI behavior.
RSI Trendlines
Auto-draws momentum support/resistance on RSI swings.
Purpose: structural RSI mapping.
Relative Trend Index
Evaluates trend consistency across multiple timeframes.
Dashboard Metrics
Shows:
* Volatility overview
* Volume analysis
* VWAP vs price
* EMA-9 sentiment
* EMA-9/21 cross (5m–Weekly)
* EMA-50 trend (5m–Weekly)
* RSI OB/OS percentages
* Price OB/OS percentages
* Relative Trend
* ATR state & ATR trailing stop
Purpose: provide a consolidated, multi-layer reading at a glance.
Visual Design (Clutter-Free Standard)
* Only real-time labels appear; historical labels stay hidden for clarity.
* Consistent, structured line styles:
* RSI trendlines: solid green/red
* Regular divergence: dashed green/red
* Hidden divergence: dotted green/red
* Momentum signals: solid green/red
This color structure helps traders read momentum quickly.
Recommended Use
* Best on: 15m, 1H, 4H, Daily, Weekly
* Works across: crypto, forex, indices, liquid equities
* Pivot-style modules may show noise in illiquid markets
Performance Notes
* Heavy modules may draw many objects → disable unused tools
* Refresh chart if buffer limits are approached
* Internal handling of TradingView object rules
License
* Proprietary script © 2025
* Independently developed
* Redistribution, sharing, resale, or decompilation prohibited
* Similarities to public tools result only from shared market concepts
Respect & Transparency
Built using widely-recognized RSI concepts, but extended with proprietary logic.
Developed with respect for the TradingView community.
Any overlaps can be addressed openly and constructively.
Disclaimer
For educational and research use only.
Not financial advice.
Always test responsibly and manage risk.
FAQs
* Source code is intentionally private
* Modules can be toggled
* Alerts can be configured manually
* Works on all major markets and timeframes
About Ghost Trading Suite
Author: BIT2BILLIONS
Project: Ghost Trading Suite © 2025
Indicators: Ghost Matrix, Ghost Protocol, Ghost Cipher, Ghost Shadow
Strategies: Ghost Robo, Ghost Robo Plus
Pine Version: V6
The Ghost Trading Suite is designed to simplify and automate many aspects of chart analysis. It helps traders identify market structure, divergences, support and resistance levels, and momentum efficiently, reducing manual charting time.
The suite includes several integrated tools — such as Ghost Matrix, Ghost Protocol, Ghost Cipher, Ghost Shadow, Ghost Robo, and Ghost Robo Plus — each combining analytical modules for enhanced clarity in trend direction, volatility, pivot detection, and momentum tracking.
Together, these tools form a cohesive framework that assists in visualizing market behavior, measuring momentum, detecting pivots, and analyzing price structure effectively.
This project focuses on providing adaptable and professional-grade tools that turn complex market data into clear, actionable insights for technical analysis.
Crafted with 💖 by BIT2BILLIONS for Traders. That's All Folks!
Changelog
v1.0 – Initial Release
* Added RSI Candles (Standard & Heiken-Ashi) for enhanced trend and divergence clarity.
* Implemented Divergence Engine to highlight both regular and hidden divergences automatically.
* Introduced Live Ghost Candidates to visualize forming divergence setups.
* Added Adaptive RSI Zones for dynamic overbought and oversold thresholds.
* Integrated Trend Index using percentile volatility sampling for directional bias.
* Added RSI Ichimoku Cloud for equilibrium and momentum zone visualization.
* Implemented RSI Trend Lines for auto support/resistance on RSI.
* Added Momentum Shift Visualization and real-time momentum tracking.
* Introduced Relative Trend Index for multi-timeframe trend strength analysis.
* Developed Dashboard Module displaying volatility, volume, EMA trends, RSI/price overbought-oversold percentages, relative trend, and ATR-based metrics.

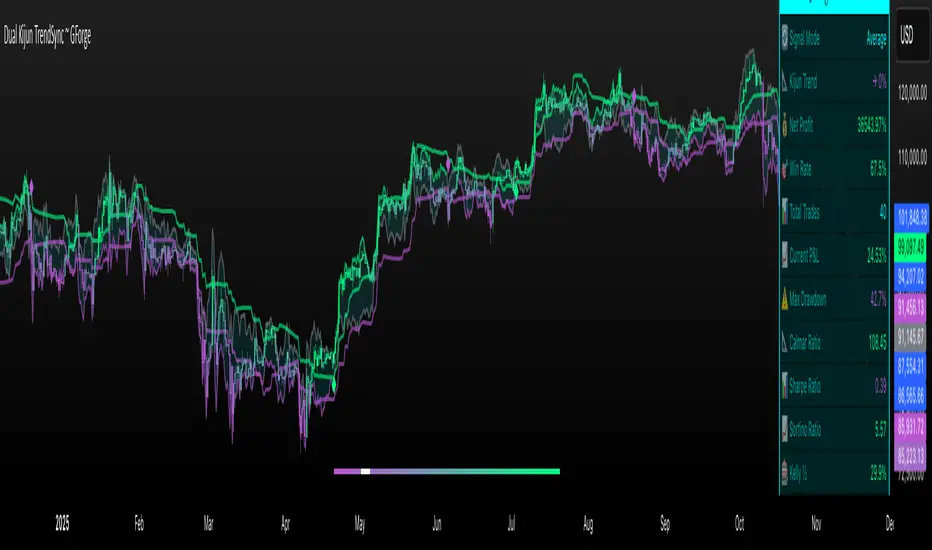
Dual Kijun TrendSyncDual Kijun TrendSync ~ GForge
What It Is:
The Dual Kijun TrendSync is an advanced trend-following indicator that combines Ichimoku's Kijun-sen (baseline) concept with modern oscillator mechanics and momentum deviation bands. It uses two parallel Kijun systems running at different speeds to capture both short-term momentum and longer-term trend direction.
The Kijun Calculation:
Unlike moving averages that use closing prices, Kijun-sen uses a unique approach:
Kijun = (Highest High + Lowest Low) / 2
Over a specified period (e.g., 26 bars), it finds:
The highest price reached
The lowest price reached
Then plots the midpoint between them
This creates a "equilibrium line" that represents the center of price action over that period. When price breaks above/below this equilibrium, it signals a potential trend shift. The indicator then adds volatility bands around this Kijun line and measures where price sits within those bands as a 0-100 oscillator.
Core Components:
1. Dual Kijun Systems:
Kijun 1 (Fast): Shorter period for responsive signals
Kijun 2 (Slow): Longer period for trend confirmation
Each uses the (High+Low)/2 midpoint calculation
2. Oscillator Conversion:
Transforms price position relative to volatility bands into a 0-100 oscillator
Formula: 100 * (Price - LowerBand) / (UpperBand - LowerBand)
Similar to Stochastic but using Kijun as the baseline
3. Momentum Deviation Bands (MD):
Applies Bollinger Band concept to the oscillator itself
Creates dynamic overbought/oversold zones that adapt to volatility
Refines entry/exit signals when in "Average" mode
How It Works:
Signal Generation:
Long signals: Oscillator crosses above the long threshold (default 82)
Short/Cash signals: Oscillator crosses below the short threshold (default 32)
In "Average" mode, uses MD band crossovers for more refined entries
Three Operating Modes:
Kijun1 Only: Fast signals, more trades, quicker reactions
Kijun2 Only: Slower signals, fewer trades, stronger trends
Average: Combines both systems with MD refinement for balanced approach
Visual Feedback:
Gradient bar coloring shows current oscillator state
Threshold lines mark entry/exit zones on price chart
MD bands show momentum extremes
Comprehensive metrics table tracks performance
Key Advantages:
Ichimoku Foundation: Leverages time-tested equilibrium concepts
Dual Timeframe Analysis: Captures both momentum and trend
Adaptive Volatility: MD bands adjust to market conditions
Clear Visual Signals: Easy to interpret with color-coded zones
Built-in Risk Metrics: Real-time performance tracking
Best Use Cases:
Trending markets where Kijun equilibrium shifts are meaningful
Instruments with clear directional moves
Timeframes from 1H to Daily (higher timeframes typically better)
Can be used standalone or combined with other Ichimoku elements
The indicator essentially answers: "Where is price relative to its equilibrium, and is momentum strong enough to warrant a position change?"
⚠️ DISCLAIMER
This indicator is a technical analysis tool designed to assist in trading decisions. Past performance does not guarantee future results. Always conduct your own research and use proper risk management. This tool should be used as part of a comprehensive trading strategy, not as a standalone solution.
Developed by GForge Trading Systems
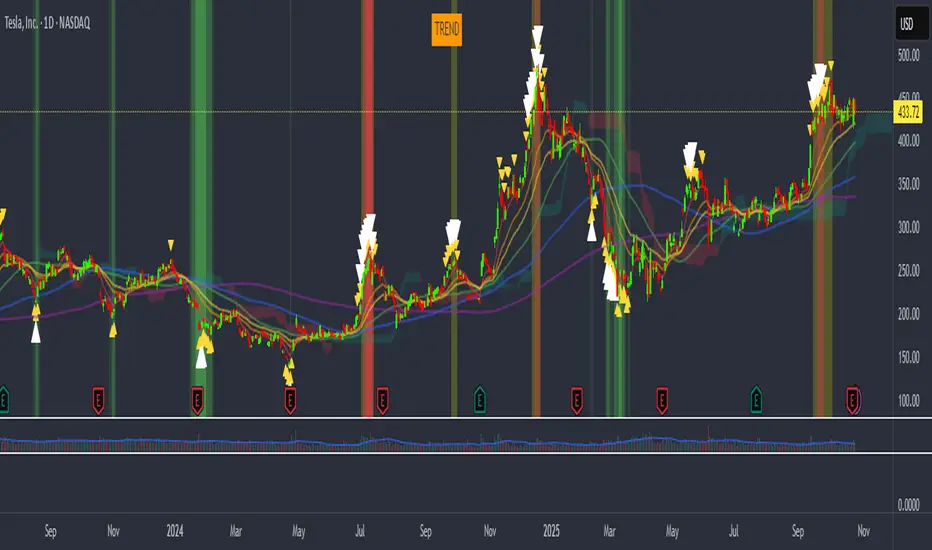
vagab0nd AlgoCombination of simple and exponential moving averages, SuperIchi cloud by LuxAlgo (love that group!), and a conglomeration of various indicators I've compiled over the years to try to spot tops and bottoms.
My custom indicator will highlight the background either green or orange/red and will show small yellow, or larger white arrows to indicate potential tops and bottoms. It is oscillator based so it can often show a strong signal for a top or bottom where price can rebound from, but will often retest or even stop loss run the previous signal area while not showing another signal. This indicates an underlying divergence that can potentially be taken advantage of.
st 47Усредненный Ишимоку (Custom: 9/48/96) [V6]st47 — Volume in Clouds
This indicator is a custom Ichimoku Cloud modification that dynamically reacts to market volume.
The color intensity of the Kumo (cloud) changes depending on the current trading volume — brighter clouds indicate stronger activity, while dimmer ones reflect low participation.
Key Features:
• Based on the Ichimoku Cloud system (8/48/96 settings)
• Volume-sensitive cloud visualization
• Works on any timeframe and pair
• Supports multi-ticker averaging (BTCUSDT, BTCUSDT.P, etc.)
• Displays additional volume histogram below the chart
Purpose:
Helps visualize both trend structure and the strength behind it by combining Ichimoku logic with real-time volume dynamics.

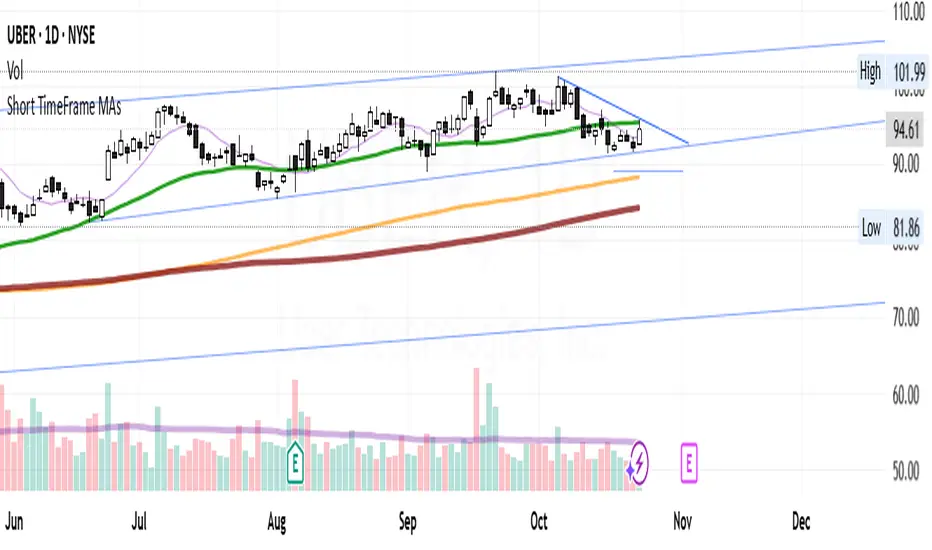
Short TimeFrame MAs with momentum cloudsThis indicator displays multiple moving averages to help identify short- and mid-term trends.
It includes four SMAs (9, 50, 150, 200) and two EMAs (21, 55) with color changes showing bullish or bearish momentum.
The area between the EMAs is filled to highlight trend direction.
An optional smoothing layer lets you apply different MA types or Bollinger Bands for additional clarity.
It’s designed to give a clear visual of overall trend strength, direction, and volatility on any timeframe.
OBV Cloud v1.0 [PriceBlance]🌐 English
OBV Cloud v1.0 – Free & Open-Source
OBV Cloud v1.0 integrates On-Balance Volume (OBV) with a Cloud model and enhanced trend filters.
It helps traders quickly identify:
Money Flow Trend: OBV Cloud acts as a dynamic support/resistance zone.
Trend Filters: EMA9 (short-term) and WMA45 (medium-term) directly applied on OBV.
OBV–Price Divergence: Detects both regular and hidden bullish/bearish divergences.
Trend Strength: Measured with ADX calculated on OBV.
OBV Cloud is suitable for both swing and day trading, allowing traders to spot breakouts, reversals, or sustained trends through volume-based analysis.

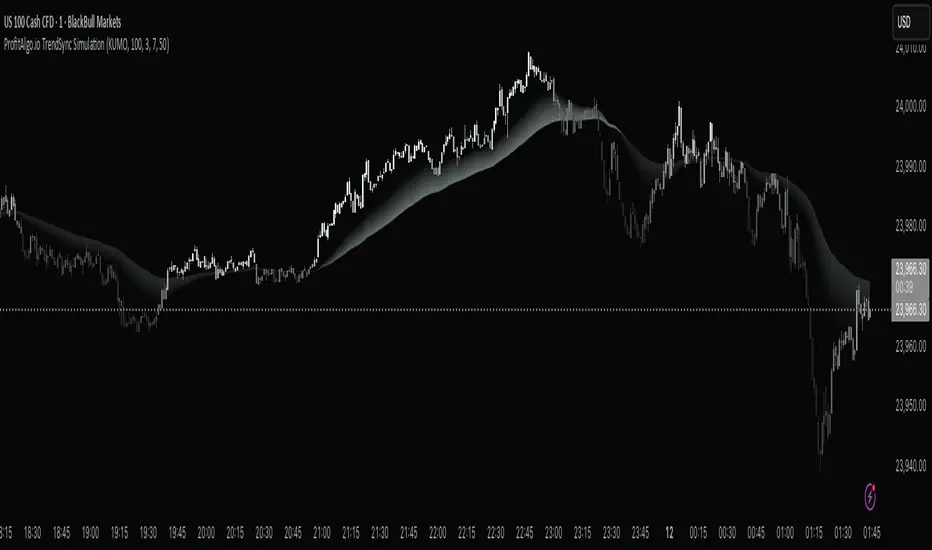
ProfitAlgo.io TrendSync SimulationThe TrendSync Simulation is a gradient-based trend-following framework that helps traders quickly identify bullish vs bearish market structure while filtering out short-term noise.
Instead of relying on a single moving average or indicator, TrendSync builds a layered “trend cloud” in 3 different MODES, KUMO, PFA, HMA anchored against a reference band. These layers create a visual gradient that shifts with market direction.
When combined with its color-adaptive candles, you can turn off your candle setting colors within the chart settings of TradingView for the TrendSync color mapping which transforms raw price action into an easy-to-read flow map of institutional momentum.
📊 How It Works
Each layer creates a smooth gradient that shifts with trend direction:
Bullish trends form a rising, green-shaded cloud.
Bearish trends form a descending, red-shaded cloud.
Transitions appear as fading or compressing gradients, signaling potential reversals or consolidations.
Candles are also dynamically colored based on normalized momentum, allowing traders to see directional strength at a glance.
🔑 Key Features
✅ Gradient Cloud – A layered trend structure that visually shifts from bearish → bullish.
✅ Multiple Modes – Choose between KUMO, PFA, or HMA logic for responsiveness vs. smoothness.
✅ Dynamic Trend Candles – Bars adapt color based on momentum strength.
✅ Customizable Visualization – Adjust transparency, colors, and gradient strength to fit your chart style.
✅ Clarity of Direction – Highlights dominant flow while reducing noise from minor fluctuations.
⚙️ Settings Explained
Trend Method (KUMO / PFA / HMA): Controls the type of moving average used for the cloud.
Gradient Colors: Define the shading of bullish vs. bearish zones.
Transparency Controls: Adjust how strong or subtle the gradient cloud appears.
Lookback Length : Longer = smoother trend; shorter = more reactive.
💡 Use Cases
Identify trend bias quickly without switching between multiple indicators.
Confirm entries with liquidity or breakout strategies by aligning with the cloud.
Detect weakening or strengthening momentum via gradient compression.
Avoid trading against dominant higher time-frame flow with trend-colored candles .
⚡ Why It Matters
Markets often look chaotic on raw candlestick charts. TrendSync cuts through that noise by layering moving averages into a visual gradient, revealing institutional momentum in real time. Whether scalping, day trading, or swing trading, TrendSync provides a synchronized view of trend direction that adapts to different trading styles.
⚡ Paired with the Back End Order Matrix, TrendSync provides the clarity of direction after liquidity zones are exposed, creating a complete institutional-style framework inside TradingView.
EXAMPLE 1A
EXAMPLE 1B
EXAMPLE 1C
EXAMPLE 2A
Kumo no Nami Trend Strength Identifier T2[T69]🧠 Overview
Kumo no Nami is a custom trend strength indicator that combines Ichimoku cloud dynamics (Kumo) with wave momentum (Nami) to identify trend direction, reversals, squeezes, and breakouts using Z-Score analysis. It adapts to different modes (Ichimoku, MA, EMA) for a flexible interpretation of price structure tension vs. movement strength.
🔍 Core Logic
Kumo Width (Cloud Pressure): Measures the normalized spread (Z-Score) between two dynamic price levels (e.g., Senkou A-B or Base-Tenkan).
Nami Strength (Wave Energy): Measures how far current price dislocates from a recent range using Z-Score of the difference between close and Donchian/MA.
Z-Score Normalization: Ensures both metrics are statistically comparable, regardless of volatility regime.
Squeeze Detection: Identifies compression before potential volatility expansion.
Breakout/False Break: Detects whether movement is legitimate or noise.
Final Top/Bottom: Highlights a strong burst post-squeeze, often signaling exhaustion or trend climax.
⚙️ Features
🌀 Multiple Kumo Modes:
Kijun-Tenkan
Senkou A - B
SMA Fast - Slow
EMA Fast - Slow
🟨 Z-Score Based Squeeze Monitoring
🟥 Final Burst Alerts
🟩 Trend Continuation or Fake-out Detection
🎨 Dynamic Background Coloring for visual signal clarity
🔧 Configuration
📊 Inputs
Kumo Mode (kt, sab, sfs, efs) – Choose method to compute Kumo (Cloud) width.
Kumo Lookback – Lookback period for cloud Z-Score analysis.
Nami Lookback – Lookback period for wave dislocation measurement.
Squeeze Threshold – How low Z-Kumo must fall to signal potential squeeze.
Burst Thresholds:
Burst Kumo → Z-Kumo must rise above this to be considered bursting.
Burst Nami → Nami Strength threshold for final trend climax.
Ichimoku Config – Tenkan, Kijun, Senkou B, and displacement.
MA Config – For Fast/Slow variants, SMA/EMA lengths.
🧪 How It Works
Compute the Kumo Width depending on selected mode.
E.g., |Tenkan - Kijun| or |Senkou A - Senkou B|
Normalize this width with its Z-Score to get Z-Kumo Width.
Compute Nami Strength:
Z-Score of how far close deviates from a Donchian channel or moving average.
Evaluate signal logic based on the two:
📈 Behavior & Signals
Trend Range (Sideways Consolidation)
=>Z-Kumo < 0 and |Nami Strength| > 2
False Break (No meaningful price movement)
=>Z-Kumo < 1 and |Nami Strength| < 1
Squeeze Watch (Potential breakout loading)
=>Z-Kumo < Squeeze Threshold
Final Burst / Climax
=>Z-Kumo > 2.5 and |Nami Strength| > 3
Bullish Breakout
=>Z-Kumo > 1 and Nami Strength > 2 and not false break
Bearish Breakout
=>Z-Kumo > 1 and Nami Strength < -2 and not false break
Reversal Detection
Crossovers of Nami Strength across 0 (bull/bear) while not in squeeze
🧠 Advanced Concepts Used
Z-Score:
=>(value - mean) / standard deviation for detecting statistically significant moves.
Squeeze Principle:
=>Low volatility → potential buildup → expansion.
Price Dislocation (Wave Strength):
=>Measures how far current price is from its mean range.
=>Cloud Tension (Kumo Z-Score):
=>Reflects pressure or neutrality in the price structure.
Trend Confirmation:
=>Only if both metrics agree and no false break conditions are met.

kiwi 지표 통합 v6 MAX많이 사용하는 지표들을 하나의 지표로 만들었습니다.
주로 이동평균선을 기준으로 매매에 유용한 지표를 모았고
볼랜저밴드, 일목군형표를 하나의 지표로 만들었습니다.
특히, 캔들색이 한국 스타일을 원하는 사람에게 적합니다.
(빨간색 = 상승, 파란색 = 하락)
We made the most used indicators one indicator.
We collected indicators that are useful for trading mainly based on the moving average
The bolanger band and the Ilmok group table were made one indicator.
In particular, the candle color is written for those who want the Korean style.
(Red = Up, Blue = Down)

kiwi 지표 통합 v6 MAX많이 사용하는 지료들을 하나의 지표로 만들었습니다.
주로 이동평균선을 기준으로 매매에 유용한 지표를 모았고
볼랜저밴드, 일목군형표를 하나의 지표로 만들었습니다.
특히, 캔들색이 한국 스타일을 원하는 사람에게 적합니다.
(빨간색 = 상승, 파란색 = 하락)
I made a lot of used materials as an indicator.
We collected indicators that are useful for trading mainly based on the moving average
The bolanger band and the Ilmok group table were made one indicator.
In particular, the candle color is written for those who want the Korean style.
(Red = Up, Blue = Down)

Kijun Shifting Band Oscillator | QuantMAC🎯 Kijun Shifting Band Oscillator | QuantMAC
📊 **Revolutionary Technical Analysis Tool Combining Ancient Ichimoku Wisdom with Cutting-Edge Statistical Methods**
🌟 Overview
The Kijun Shifting Band Oscillator represents a sophisticated fusion of traditional Japanese technical analysis and modern statistical theory. Built upon the foundational concepts of the Ichimoku Kinko Hyo system, this indicator transforms the classic Kijun-sen (base line) into a dynamic, multi-dimensional analysis tool that provides traders with unprecedented market insights.
This advanced oscillator doesn't just show you where price has been – it reveals the underlying momentum dynamics and volatility patterns that drive market movements, giving you a statistical edge in your trading decisions.
🔥 Key Features & Innovations
Dual Trading Modes for Maximum Flexibility: 🚀
Long/Short Mode: Full bidirectional trading capability for aggressive traders seeking to capitalize on both bullish and bearish market conditions
Long/Cash Mode: Conservative approach perfect for risk-averse traders, taking long positions during uptrends and moving to cash during downtrends (avoiding short exposure)
Advanced Visual Intelligence: 🎨
9 Professional Color Schemes: From classic blue/navy to vibrant orange/purple combinations, each optimized for different chart backgrounds and personal preferences
Dynamic Gradient Histogram: Color intensity reflects oscillator strength, providing instant visual feedback on momentum magnitude
Intelligent Overlay Bands: Semi-transparent fills create clear visual boundaries without cluttering your chart
Smart Candle Coloring: Real-time color changes reflect current market state and trend direction
Customizable Threshold Lines: Clearly marked entry and exit levels with contrasting colors
Professional-Grade Analytics: 📊
Real-Time Performance Metrics: Live calculation of 9 key performance indicators
Risk-Adjusted Returns: Sharpe, Sortino, and Omega ratios for comprehensive performance evaluation
Position Sizing Guidance: Half-Kelly percentage for optimal risk management
Drawdown Analysis: Maximum drawdown tracking for risk assessment
📈 Deep Technical Foundation
Kijun-Based Mathematical Framework: 🧮
The indicator begins with the traditional Kijun-sen calculation but extends it significantly:
Statistical Enhancements: 📉
Adaptive Volatility: Bands expand and contract based on market volatility
Momentum Filtering: EMA smoothing of oscillator for trend confirmation
State Management: Intelligent signal filtering prevents whipsaws and false signals
Multi-Timeframe Compatibility: Optimized algorithms work across all timeframes
⚙️ Comprehensive Parameter Control
Kijun Core Settings: 🎛️
Kijun Length (Default: 30): Controls the lookback period for the base calculation. Shorter periods = more responsive, longer periods = smoother signals
Source Selection: Choose from Close, Open, High, Low, or HL2. Close price recommended for most applications
Calculation Method: Uses traditional Ichimoku methodology ensuring compatibility with classic analysis
Advanced Oscillator Configuration: 📊
Standard Deviation Length (Default: 36): Determines volatility measurement period. Affects band width and sensitivity
SD Multiplier (Default: 2.1): Fine-tune band distance from basis line. Higher values = wider bands, lower values = tighter bands
Oscillator Multiplier (Default: 100): Scales the final oscillator output. Useful for matching other indicators or personal preference
Smoothing Algorithm: Built-in EMA smoothing prevents noise while maintaining responsiveness
Signal Threshold Optimization: 🎯
Long Threshold (Default: 83): Oscillator level that triggers long entries. Higher values = fewer but stronger signals
Short Threshold (Default: 42): Oscillator level that triggers short entries. Lower values = fewer but stronger signals
Threshold Logic: Crossover-based system with state management prevents signal overlap
Customization Range: Fully adjustable to match your trading style and risk tolerance
Precision Date Control: 📅
Start Date/Month/Year: Precise backtesting control down to the day
Historical Analysis: Test strategies on specific market periods or events
Strategy Validation: Isolate performance during different market conditions
📊 Professional Metrics Dashboard
Risk Assessment Metrics: 💼
Maximum Drawdown %: Largest peak-to-trough decline in portfolio value. Critical for understanding worst-case scenarios and position sizing
Sortino Ratio: Risk-adjusted return measure focusing only on downside volatility. Superior to Sharpe ratio for asymmetric return distributions
Sharpe Ratio: Classic risk-adjusted performance metric. Values above 1.0 considered good, above 2.0 excellent
Omega Ratio: Probability-weighted ratio capturing all moments of return distribution. More comprehensive than Sharpe or Sortino
Performance Analytics: 📈
Profit Factor: Gross Profit ÷ Gross Loss. Values above 1.0 indicate profitability, above 2.0 considered excellent
Win Rate %: Percentage of profitable trades. Consider alongside average win/loss size for complete picture
Net Profit %: Total return on initial capital. Accounts for compounding effects
Total Trades: Sample size for statistical significance assessment
Advanced Position Sizing: 🎯
Half Kelly %: Optimal position size based on Kelly Criterion, reduced by 50% for safety margin
Risk Management: Helps determine appropriate position size relative to account equity
Mathematical Foundation: Based on win probability and profit factor calculations
Practical Application: Directly usable percentage for position sizing decisions
🎨 Advanced Display Options
Flexible Interface Design: 🖥️
6 Positioning Options: Top/Bottom/Middle × Left/Right combinations for optimal chart organization
Toggle Functionality: Show/hide metrics table for clean chart presentation during analysis
Color Coordination: Metrics table colors match selected oscillator color scheme
Professional Styling: Clean, readable format with proper spacing and alignment
Visual Hierarchy: 🎭
Oscillator Histogram: Primary focus with gradient intensity showing momentum strength
Threshold Lines: Clear horizontal references for entry/exit levels
Zero Line: Neutral reference point for trend bias determination
Background Bands: Subtle overlay context without chart clutter
🚀 Advanced Signal Generation System
Multi-Layer Signal Logic: ⚡
Primary Signal Generation: Oscillator crossover above Long Threshold (default 83) triggers long entries
Exit Signal Processing: Oscillator crossunder below Short Threshold (default 42) triggers position exits
State Management System: Prevents duplicate signals and ensures clean position transitions
Mode-Specific Logic: Different behavior for Long/Short vs Long/Cash modes
Date Range Filtering: Signals only generated within specified backtesting period
Confirmation Requirements: Bar confirmation prevents false signals from intrabar price spikes
Intelligent Position Management: 🧠
Entry Tracking: Precise entry price recording for accurate P&L calculations
Position State Monitoring: Continuous tracking of long/short/cash positions
Automatic Exit Logic: Seamless position closure and new position initiation
Performance Calculation: Real-time P&L tracking with compounding effects
📉📈 Comprehensive Band Interpretation Guide
Dynamic Band Analysis: 🔍
Upper Band Function: Represents dynamic resistance based on recent volatility. Price approaching upper band suggests potential reversal or breakout
Lower Band Function: Represents dynamic support with volatility adjustment. Price near lower band indicates oversold conditions or support testing
Middle Line (Basis): Trend direction indicator. Price above = bullish bias, price below = bearish bias
Band Width Interpretation: Wide bands = high volatility, narrow bands = low volatility/potential breakout setup
Band Slope Analysis: Rising bands = strengthening trend, falling bands = weakening trend
Oscillator Interpretation: 📊
Values Above 50: Price in upper half of recent range, bullish momentum
Values Below 50: Price in lower half of recent range, bearish momentum
Extreme Values (>80 or <20): Overbought/oversold conditions, potential reversal zones
Momentum Divergence: Oscillator direction vs price direction for early reversal signals
Trend Confirmation: Oscillator direction confirming or contradicting price trends
💡 Strategic Trading Applications
Primary Trading Strategies: 🎯
Trend Following: Use threshold crossovers to capture major directional moves. Best in trending markets with clear directional bias
Mean Reversion: Identify extreme oscillator readings for counter-trend opportunities. Effective in range-bound markets
Breakout Trading: Monitor band compressions followed by expansions for breakout signals
Swing Trading: Combine oscillator signals with band interactions for swing position entries/exits
Risk Management: Use metrics dashboard for position sizing and risk assessment
Market Condition Optimization: 🌊
Trending Markets: Increase threshold separation for fewer, stronger signals
Choppy Markets: Decrease threshold separation for more responsive signals
High Volatility: Increase SD multiplier for wider bands
Low Volatility: Decrease SD multiplier for tighter bands and earlier signals
⚙️ Advanced Configuration Tips
Parameter Optimization Guidelines: 🔧
Kijun Length Adjustment: Shorter periods (10-20) for faster signals, longer periods (50-100) for smoother trends
SD Length Tuning: Match to your trading timeframe - shorter for responsive, longer for stability
Threshold Calibration: Backtest different levels to find optimal entry/exit points for your market
Color Scheme Selection: Choose schemes that provide best contrast with your chart background and other indicators
Integration with Other Indicators: 🔗
Volume Indicators: Confirm oscillator signals with volume spikes
Support/Resistance: Use key levels to filter oscillator signals
Momentum Indicators: RSI, MACD confirmation for signal strength
Trend Indicators: Moving averages for overall trend bias confirmation
⚠️ Important Usage Notes & Limitations
Indicator Characteristics: ⚡
Lagging Nature: Based on historical price data - signals occur after moves have begun
Best Practice: Combine with leading indicators and price action analysis
Market Dependency: Performance varies across different market conditions and instruments
Backtesting Essential: Always validate parameters on historical data before live implementation
Optimization Recommendations: 🎯
Parameter Testing: Systematically test different combinations on your preferred instruments
Walk-Forward Analysis: Regularly re-optimize parameters to maintain effectiveness
Market Regime Awareness: Adjust parameters for different market conditions (trending vs ranging)
Risk Controls: Implement maximum drawdown limits and position size controls
🔧 Technical Specifications
Performance Optimization: ⚡
Efficient Algorithms: Optimized calculations for smooth real-time operation
Memory Management: Smart array handling for metrics calculations
Visual Optimization: Balanced detail vs performance for responsive charts
Multi-Symbol Ready: Consistent performance across different assets
---
The Kijun Shifting Band Oscillator represents the evolution of technical analysis, bridging the gap between traditional methods and modern quantitative approaches. This indicator provides traders with a comprehensive toolkit for market analysis, combining the intuitive wisdom of Japanese candlestick analysis with the precision of statistical mathematics.
🎯 Designed for serious traders who demand professional-grade analysis tools with institutional-quality metrics and risk management capabilities. Whether you're a discretionary trader seeking visual confirmation or a systematic trader building quantitative strategies, this indicator provides the foundation for informed trading decisions.
⚠️ IMPORTANT DISCLAIMER
Past Performance Warning: 📉⚠️
PAST PERFORMANCE IS NOT INDICATIVE OF FUTURE RESULTS. Historical backtesting results, while useful for strategy development and parameter optimization, do not guarantee similar performance in live trading conditions. Market conditions change continuously, and what worked in the past may not work in the future.
Remember: Successful trading requires discipline, continuous learning, and adaptation to changing market conditions. No indicator or strategy guarantees profits, and all trading involves substantial risk of loss.

Wyckoff Schematic - Accumulation [TrendX_]Wyckoff Schematic 1 - Accumulation is an advanced Wyckoff method tool on TradingView, designed to automate the identification of critical phases and price structures within the Wyckoff Accumulation Schematic. By detecting key events such as SC (Selling Climax), AR (Automatic Rally), Spring, and SOS (Sign of Strength), this tool helps traders visualize institutional accumulation patterns, anticipate trend reversals, and identify potential entry points aligned with the Wyckoff model—all without requiring hours of manual monitoring. The indicator dynamically labels key points, draws accumulation zones, and triggers alerts upon phase confirmations, reducing manual analysis and emotional bias.
💎 FEATURES
▶ Phase A: Bottom Identification
Auto-detects Selling Climax (SC), Automatic Rally (AR), and Secondary Test (ST).
Customizable initial trend detection: FTD (Follow-Through Day), Market Structure Shift, Triple MA Crossover, or Ichimoku Cloud.
▶ Phase B: Accumulation Range Formation
Identifies SOS(b) and ST(b) in Phase B
Customizable sweep levels for ST detection: previous SC / ST(a) / Fibonacci retracement levels of AR & SC.
▶ Phase C: Accumulation Confirmation
Flags Spring (false breakdown) and Test (confirmation of false breakdown).
▶ Phase D: Breakout Preparation
Detects SOS and BU/LPS for breakout confirmation.
▶ Visual Tools
Auto-draws accumulation range SC, AR, SOS(b) with real-time extensions.
Labels all critical events (SC, AR, ST, SOS, Spring, LPS) with text and markers.
Draws colored boxes for confirmed phases A, B and C, and triggers alerts for start of Markup with SOS and BU/LPS.
🔎 BREAKOUT
Phase A: Halting the Downtrend
▶ Key Events: SC, AR, ST(a).
▶ Functions:
SC: Marks panic selling, often with high volume.
AR: Sharp rebound after SC, reflecting short-term demand.
ST(a): Retest of SC lows to confirm weakening supply.
▶ Importance:
Phase A signals the end of a downtrend. The SC shows exhaustion, while the AR and ST confirm that sellers are losing control. Customizable trend detection (e.g., Ichimoku Cloud or FTD) ensures alignment with broader market context or your preference.
Phase B: Building the Accumulation Range
▶ Key events: SOS (Pha B), ST (Pha B).
▶ Functions:
SOS(b): A rally breaking above the AR, indicating strong demand.
ST(b): Retests of SC / ST(a) / Fib level to sweep liquidity (trap late sellers).
▶ Importance:
Phase B confirms the sideways range. SOS reflects institutional buying, while ST(b) traps sellers. Sweeping SC / ST(a) / Fib level would help identify false breakdowns.
Phase C: Spring & Test
▶ Key events: Spring (false breakdown), Test (confirmation).
▶ Functions:
Spring: A deliberate drop below Phase B support to eliminate weak traders.
Test: Retest of the Spring low to confirm sustained demand.
▶ Importance:
Phase C is the final "shakeout" to confirm accumulation. The Spring traps weak hands, while the Test validates support, confirming the institution has bought enough, signaling readiness for Markup.
Phase D: Breakout / Start of Markup
▶ Key events: SOS, BU/LPS.
▶ Functions:
SOS: A strong rally breaking above the accumulation range.
BU/LPS: Pullback after SOS to retest the breakout level.
▶ Importance:
Phase D confirms the start of a Markup. SOS shows demand overpowering supply, while BU/LPS offers low-risk entry points.
Accumulation Range & Visual Tools
▶ Accumulation Range: Drawn between SC (low) and AR (high), reflecting institutional buying activity.
▶ Labels/Boxes: Clear labels (SC, AR, ST, SOS, Spring, …) track each phase.
▶ Alerts: Notifies users when SOS or BU/LPS appears.
🛠️ USAGE
▶ Configuration
Phase A: Select trend detection method based on your preference and trading style (FTD, Market Structure, Triple MA, Mây Ichimoku).
Phase B: Adjust sweep levels (SC, ST(a), Fibonacci 61.8% của AR & SC).
▶ Interpretation
Bullish Trend: Confirmed Phase C (Spring + Test) followed by SOS in Phase D.
▶ Trading Strategy
Enter long positions at BU/LPS (Phase D) with volume or momentum confirmation.
Uses other Break-out strategy after SOS appear for Long Entry.
DISCLAIMER
This indicator is not financial advice, it can only help traders make better decisions. There are many factors and uncertainties that can affect the outcome of any endeavor, and no one can guarantee or predict with certainty what will occur. Therefore, one should always exercise caution and judgment when making decisions based on past performance.

Hossa Indicator PureThe Hossa Indicator Pure is a custom technical analysis tool designed to measure market volatility and momentum using normalized Ichimoku-based calculations. It identifies overbought and oversold conditions, providing traders with insights into potential trend reversals or continuation points.
Key Features:
Ichimoku-Based Volatility Analysis:
Calculates volatility using the difference between Tenkan-sen, Kijun-sen, and Senkou Span B.
Incorporates a normalized "Kumo depth" calculation for enhanced volatility insights.
Normalization with Dynamic Bands:
Smooths raw volatility data using a moving average and adjusts it with a standard deviation multiplier.
The normalized indicator is scaled between custom overbought and oversold levels, making it adaptable to different market conditions.
Overbought and Oversold Alerts:
Generates alerts when the indicator crosses into overbought or oversold zones, allowing traders to act promptly.
Dynamic Color-Coded Trend Visualization:
Displays the indicator line in green for upward momentum and red for downward momentum, providing an at-a-glance view of market conditions.
Customizable Inputs:
Tenkan-sen Period: Controls the short-term trend sensitivity.
Kijun-sen Period: Adjusts the medium-term trend.
Senkou Span B Period: Configures the long-term trend baseline.
Smoothing Period: Refines volatility analysis.
Standard Deviation Multiplier: Tailors the sensitivity of the overbought/oversold zones.
Overbought/Oversold Levels: Defines thresholds for signal generation.
How It Works:
Ichimoku Calculations:
Tenkan-sen and Kijun-sen are calculated as averages of the highest high and lowest low over their respective periods.
Future Span A and Future Span B form the basis for volatility depth (Kumo depth).
Volatility Normalization:
The raw Kumo depth is smoothed using a moving average and normalized using statistical bands (average ± standard deviation).
Signal Generation:
Overbought signals are triggered when the normalized indicator exceeds the overbought level.
Oversold signals are generated when the indicator falls below the oversold level.
Visual Representation:
Plots a normalized indicator line with dynamic colors based on momentum.
Includes horizontal dashed lines marking the overbought and oversold thresholds.
Alerts:
Customizable alerts notify traders when overbought or oversold conditions are met.
How to Use:
Set Input Parameters:
Adjust the periods for Tenkan-sen, Kijun-sen, and Senkou Span B to align with your trading style (e.g., shorter periods for scalping, longer for swing trading).
Configure smoothing and standard deviation multiplier to control signal sensitivity.
Monitor Indicator Line:
Look for overbought and oversold conditions based on the defined thresholds.
Use dynamic line colors to identify potential trend reversals (green for bullish, red for bearish).
Alerts:
Set alerts to notify you of overbought/oversold conditions to stay updated without constant chart monitoring.
The Hossa Indicator Pure provides a versatile tool for volatility analysis and momentum detection, suitable for traders seeking precise and customizable insights into market conditions.

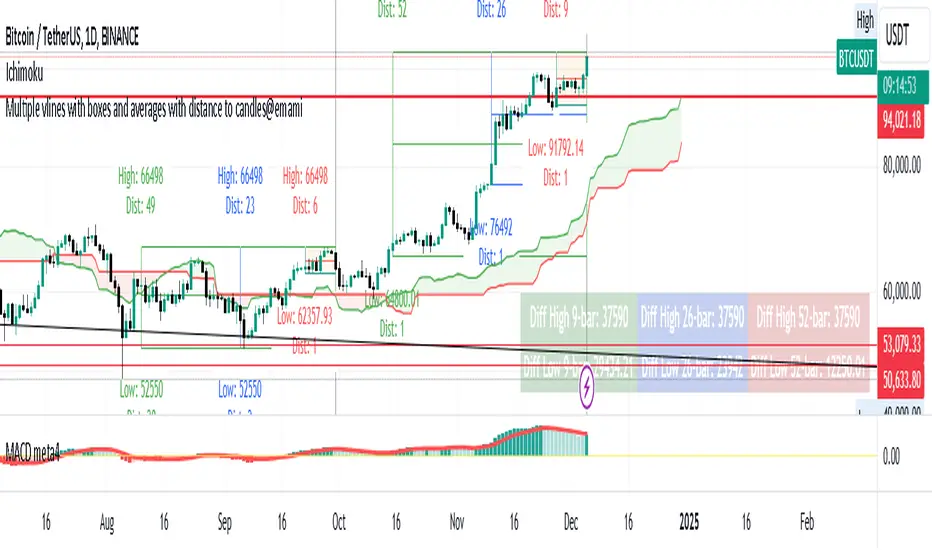
Multiple vlines boxes and averages distance to candles@emami
Indicator: "Multiple Vertical Lines with Boxes and Averages with Distance to Candles"
Description:
This Pine Script is designed to help traders analyze price movements over different time frames by visually drawing vertical lines and boxes based on selected date/time points. The script calculates the highest high, lowest low, and midpoints of the last 9, 26, and 52 bars, drawing a box around each range. Additionally, the script displays the distance from the high and low to the current bar.
Key Features:
Multiple Vertical Lines:
Vertical lines are drawn at user-specified times, allowing traders to highlight critical points on the chart for further analysis.
Dynamic Boxes Based on Bar Count:
9-bar Box: Displays the highest high and lowest low for the last 9 bars (including the current bar) and draws a box around this range. A midpoint line is also plotted.
26-bar Box: Similar to the 9-bar box, but for the last 26 bars.
52-bar Box: Displays the same calculation for the last 52 bars.
Distance Calculations:
The script calculates the distance from the highest high and lowest low of each box to the current bar, providing valuable insight into the range and price movement for each time window.
Visual Display:
Each box is colored differently for easy identification (orange for 9 bars, white for 26 bars, and green for 52 bars).
Midpoint lines are drawn in different colors to distinguish between the 9-bar, 26-bar, and 52-bar ranges.
Labels are placed above the high and below the low of each box, showing the exact high/low values and the distance to the current bar.
How It Works:
The script first waits for the specified date and time inputs. Once the time condition is met, it performs the calculations for the high, low, and midpoint of the last 9, 26, and 52 bars.
The script then plots vertical lines at the specified times and draws boxes based on the highest high and lowest low for each range.
A midpoint is drawn for each box, and labels are placed with the high/low values and the distances from these values to the current bar.
How to Use It:
Set the date and time for the vertical lines you want to analyze.
The script will automatically draw the lines and boxes for the selected time frames.
Review the boxes and midpoints to identify potential price levels for analysis.
Use the distance values to assess the current price's proximity to the high/low of the respective bar range.
Improvements Based on Rules:
Language:
Make sure your title and description are in English. If you use any other language, ensure it’s accompanied by an English translation.
Clean Chart:
Ensure that the chart you’re publishing with the script is clear and simple, without additional, unnecessary indicators or drawings.
Originality & Usefulness:
If your script is closed-source, clarify why it is closed-source. Provide enough details about its unique functionality so traders can understand its purpose and utility.
No Advertisements or Promotions:
Double-check that your description does not contain any links, promotional content, or references to websites, companies, or social media.
Suggested Tags for Script:
#PineScript
#VerticalLines
#PriceAnalysis
#TechnicalAnalysis
#SupportResistance
#BoxingStrategy
#MidpointCalculation
#DistanceToCandles
#ChartIndicators
Trade Rush IndicatorTrade Rush Indicator
The Trade Rush Indicator is a comprehensive tool designed for traders who seek a clear visualization of key moving averages, combined with Bollinger Bands to identify potential trading opportunities. This script provides a unique approach to trend analysis by combining multiple Exponential Moving Averages (EMA) and Simple Moving Averages (SMA) with varying lengths, along with Bollinger Bands set to both 1 and 2 standard deviations.
Key Features:
EMAs & SMAs: The indicator includes several EMAs (5, 9, 21, 50, 100, 120, 200, 400) and SMAs (21, 50, 100, 120, 200, 400), each serving a different timeframe perspective. The EMAs and SMAs are color-coded for quick reference, and some of the longer-period moving averages (50 EMA, 100 EMA, etc.) are hidden by default to reduce chart clutter but can be manually enabled.
Bollinger Bands: Bollinger Bands are set at 1 and 2 standard deviations to assist in visualizing price volatility. The space between the 1σ and 2σ bands is filled with a light cloud, making it easy to spot periods of higher volatility. This band configuration helps traders assess potential breakout or reversal zones.
Ichimoku Cloud Overlay: Although the Ichimoku cloud calculation is included, it is hidden by default and can be activated when additional trend confirmation is needed. The cloud’s opacity is set to be subtle, allowing it to enhance chart readability without overwhelming other indicators.
Usage:
The Trade Rush Indicator is ideal for swing traders and intraday traders who rely on moving average crossovers, Bollinger Band volatility signals, and trend confirmation through Ichimoku cloud analysis. By visualizing multiple moving averages and Bollinger Bands, traders can identify trend direction, support/resistance zones, and potential breakout areas.
Originality and Value:
This script is a tailored solution for traders who seek a blend of moving averages and Bollinger Bands to enhance their trend-following strategies. Unlike standard setups, the Trade Rush Indicator provides extensive customization options, allowing traders to enable/disable specific indicators based on their trading style and preferences. Its structure also provides unique insights into volatility and trend strength by layering various EMAs and SMAs, helping traders make more informed decisions.
