FARAZ.MATI20vA personal indicator.
This indicator has the following features :
Thanks to the managers and administrators of TradingView site for the appropriate space with wide facilities for optimal use. All (indicators) were available on the site and I only defined certain settings for them.
FARAZ.MATI20v
EMA: 5
SMA : 20
SMA : 50
Collision and interruption of Moving 20 by Moving 5 can be the beginning of an upward trend. Provided that the Moving 5 is placed under the candles. (The best signal for the Moving 5 is to collide with the Moving 20 under the candles). Also, the collision of the Moing 5 with the Moing 20 on top of the candles can be a sign of falling. Especially if this collision occurs above the candles.The cut of the Moving 20 and the Moving 50 indicate the intensity of the wave. If Moving 20 is above Moving 50 in this collision, it shows the intensity of the uptrend and if it is below Moving 50, it shows the intensity of the downtrend.
SMA : 100
SMA : 200
Both (resistance and support) are very strong, which is very effective in larger timeframes (such as 1 day).
HMA : 20
To determine the entry point. In such a way that whenever the seeds (HMA) are below the candlesticks. 3 seeds are in ascending position. The body of the candle and the shadow should not touch them. It can be a good signal to enter. Also if the seeds are placed on top of the candlesticks. Show the descending direction of 3 seeds. Provided that the body of the candle and the shadow have not hit them. It is a signal for the short position.
SAR : With the applied settings, it is a kind (trending view) that can evaluate the volume of input to any currency much sooner and determine the probability of rising or falling. If our wave lines (stairs) are at the bottom of the candles, it means an upward trend, and if they are at the top of the candles, it means a downward trend. As the volume of inputs increases, the trend increases, and as the volume of inputs decreases, the trend will also decrease.
Ichimoku Cloud : To determine the lines (support and resistance) the peaks formed by the cloud can represent a resistance area. Price To cross the area marked by the Ichimoku cloud must have a strong candle. This can be very effective in determining the point of entry and purchase.
zig zag : For better diagnosis of the process. Using it to determine areas of support and resistance can be useful. Determining the points of the Fibonacci table is also very effective.
Cari dalam skrip untuk "ichimoku"
Robocan DeluxeThis script is equipped with
🔵 Robo 4
It offers strategic trading entry and exit points, so you can preserve capital before markets tumble, and take full advantage as they start to rebound. At a glance, market timing indicators tell investors whether market conditions are right or whether it’s safer on the sideline.
Truly unique tool for technical analysis for the financial market as it includes calculation of specific metrics like SAR + MACD + Price Movement.
You no longer have to worry about spending hours in front of the computer looking for a trade.You can use the indicator on every assets available on your broker.
🔵 Change Candle Color
You can change the colors depending on buy 4 and sell 4 signals. It helps traders a lot to see the direction clearly.
🔵 BB Signals
This strategy uses the MACD indicator together with the Bollinger Bands to sell when the price is above the upper Bollinger Band (and to buy when this value is below the lower band). This simple strategy only triggers when both the MACD and the Bollinger Band indicators are at the same time in a overbought or oversold condition.
Removed Upper & Lower bands & SMA20 from the charts.
To see bands, You can activate the Bollinger Bands on EngineeringRobo - not the Deluxe version.
If you are buying it with BB BUY, No need to wait for BB Sell to sell it. Vice versa.
They are not the opposite to each other. Get your profit at your target level and move on.
🔵 Ultimate MA crossover signals :
As a general guideline,the idea behind trading crossovers is that a short-term moving average above a long-term moving average is an indicator of upward momentum in a stock & crypto , and the opposite is true about a short-term average trading below a long-term average.
For this guideline to be of use, the moving average should have provided insights into trends and trend changes in the past.
Are the settings of SMA 50 & SMA 200 really the best for Golden Cross and Death Cross?
Have you ever tested ROI for MA cross strategies?
Do you think MA 20 and MA 50 are the best pair for traders?
Do you know that Exponential Moving Average ( EMA ) beats the Simple Moving Average ( SMA ) ?
In order to answer these questions we applied some brute mathematical force and tested 1830 different MA combination to find out the best pair through 50 years of data across stock / forex and 5 years of data across crypto markets . We have done the hard work and you get the benefits .
P.S. The oldest date is 1872 on SPCFD:SPX chart on tradingview . Almost 150 years of backtesting is possible from 1872 to 2020!;
🔵 Cloud Signals :
This is a strategy made from ichimoku cloud , together with MACD . Changed Ichimoku cloud formula. Based on that we have a long or a short entry.
it is an effective strategy when paired with a trailing stop loss. Removed standard line ( Kijun Sen ), turning line ( Tenkan Sen ), lagging line ( Chikou Span ) and senkou lines, added buy & sell signals. Traders can use EngineeringRobo's cloud to see the clouds on the chart.
This method doesn't work in sideways markets, only in volatile trending markets.
🔵 EMA TrendLines & Custom Moving Average
Moving averages help traders isolate the trend in a security or market, or the lack of one, and can also signal when a trend may be reversing. Two of the most common types are simple and exponential. We will look at the differences between these two moving averages, helping traders determine which one to use. Simple moving averages and the more complex exponential moving averages help visualize the trend by smoothing out price movements.
Each trader must decide which MA is better for his or her particular strategy. Many shorter-term traders use EMAs because they want to be alerted as soon as the price is moving the other way. Longer-term traders tend to rely on SMAs since these investors aren't rushing to act and prefer to be less actively engaged in their trades.
🟠50 And 200 Day Moving Average Rules
Trend reversal (downtrend to uptrend) - MA 50 crossover MA 200 from below.
Trend reversal (uptrend to downtrend) - MA 50 crossover MA 200 from above.
Weekly open –close above MA 20 ( bullish trend )
Weekly open –close below MA 50 ( Bearish trend )
Super Bullish : The candle is above MA 20 ( Daily )
Bullish : MA 50 Above MA 100 ( Daily )
Bearish : MA 50 below MA 100 ( Daily )
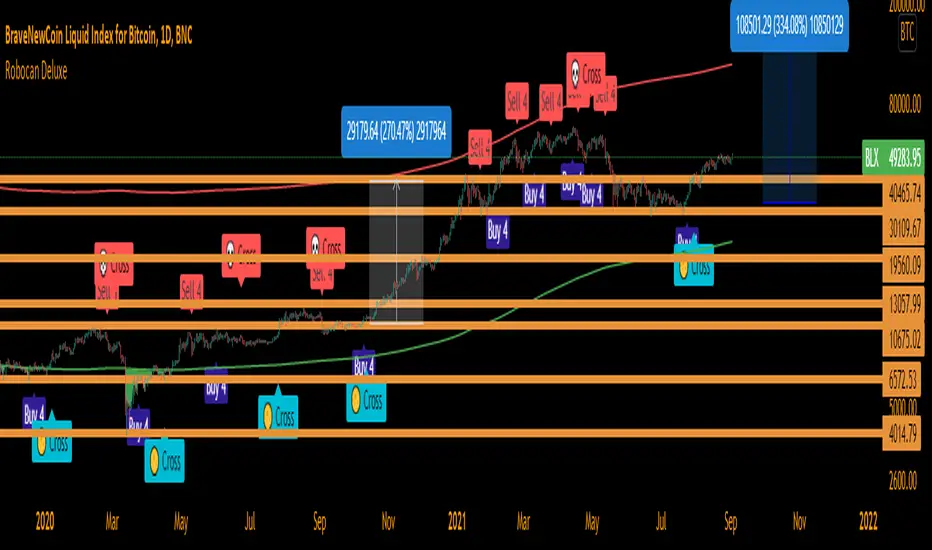
🔵 Fear & Greed Index
This strategy uses two unique EMA indicators in the formula.
1. Use the indicator to identify when investors are greedy.
2. Use the indicator to identify potential bottom levels
For best testing example:
This strategy finds the TOP AREA OF THE BULL MARKET AND THE BOTTOM AREA OF THE BEAR MARKET.
1. Use the indicator to identify when investors are greedy
2. Use the indicator to identify potential bottom levels
For a case study:
Open BLX Chart, pick 1D time frame, open only FEAR & Greed Index
🟢Exiting Green Area: Beginning of Bull Market🟢
🔴Exiting Red Area: Beginning of Bear Market🔴
Price crosses above red line= Entering overbought zone
Price crosses below red line= Exiting overbought zone
Price crosses below green line= Entering oversold zone
Price crosses above green line = Exiting oversold zone
BEST TIME TO SELL: When the candle is inside & exiting the Red Area
BEST TIME TO BUY: When the candle is in the Green Area
🔵 Automated Fibonacci Retracements
Automatic Fibonacci let you replace subjective manual analysis with objective automated analysis so you always get the best Fibonacci levels, this can really improve the quality of your trading decisions.
Fibonacci retracements are often used to identify the end of a correction or a counter-trend bounce. Corrections and counter-trend bounces often retrace a portion of the prior move. While short 23.6% retracements do occur, the 38.2-61.8% zone covers the most possibilities (with 50% in the middle). This zone may seem big, but it is just a reversal alert zone. One of the best ways to use the Fibonacci retracement tool is to spot potential support and resistance levels and see if they line up with Fibonacci retracement levels.
Even though Fibonacci levels are extremely popular among technical traders, one should not rely solely on Fibonacci retracement and extension levels in trading. Fibonacci tools return the best results when combined with other technical tools, such as trendlines , chart patterns, candlestick patterns, channels or technical indicators.
If you are following any Deluxe signals, you should always wait for the candle close before buying or selling.
The signal can come and go anytime during the live candle. ALL indicators do that, that is not considered repainting.
Repainting is when a signal appears, the candle is closed, and when you refresh the chart it disappeared. It is logical that until the candle is closed the signal is not decided yet, hence the alert setup as Once per bar Close.
Deluxe never repaints! Yes, you heard it right: you will never have to worry about signal changing after the candle is closed.
*** Added alarm system alerts for all signals.
________________________________________________________________________ Timeframes _____________________________________________________________________
Our recommendations to get the best results:
Swing Trading Crypto : Use 1D Time Frame Candles
Swing Trading Stocks : Use 1W Time Frame Candles
Swing Trading Commodities : Use 1W Time Frame Candles
Day Trading Crypto : Use 3H Time Frame Candles
Day Trading Stocks : Use 1D Time Frame Candles
Day Trading Commodities : Use 1D Time Frame Candles
Not recommended any other time frames.
What Is Risk-Reward Ratio RRR?
Your risk-reward ratio is how much you risk per trade, relative to how much you expect to make (reward).
When trading with Robo , you should always aim for a bigger reward compared to your risk per trade.
A good rule is only to risk 1% per trade for day traders and 5% per trade for swing trader . Robo follows strong risk management rules on the algorithm .
One of the biggest advantages of algo trading is removing human emotion from the financial markets,humans trading are susceptible to emotions that lead to irrational decisions. Robo doesn't have to think or feel good to make a trade. If conditions are met, it enters. When the trade goes the wrong way or hits a profit target, It exits. It doesn't get angry at the market or feel invincible after making a few good trades.
It gives you all the tools and information you need for day-to-day trading and investing, while also keeping a great buy and sell signals! No excuse to lose in any financial market anymore! Try now!
How can you add the algorithm into your chart?
1. Login to TradingView.com
2. From the homepage, click on ‘Chart’ in the top navigation bar
3. Select “Indicators” on the top-center-middle panel
4. In the indicator library, type "Robocan Deluxe "
5. Use the website link below to obtain access to this indicator
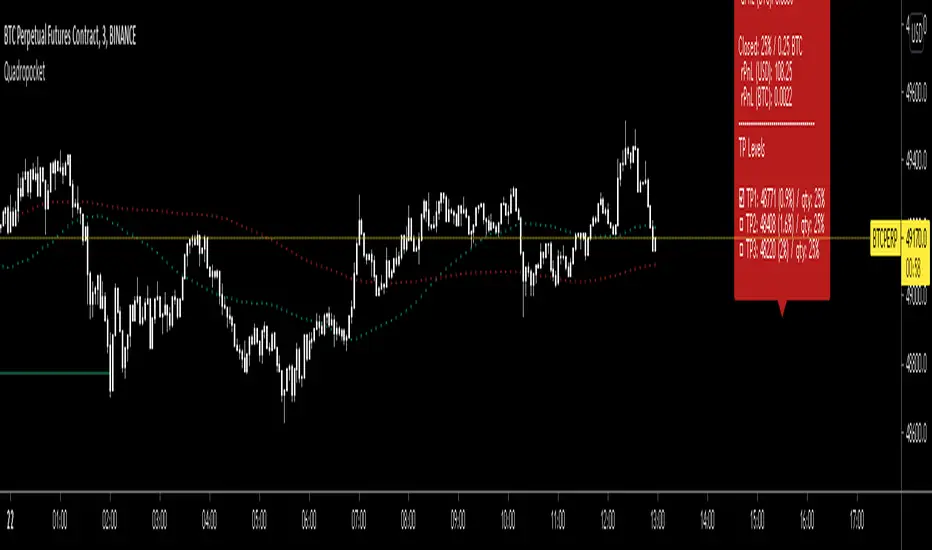
QuadropocketJe vous présente Quadropocket ( Script avec config par default pour cross Leverage ) a vous d'adaptez vos leviez ou vos holds
Il ce compose de :
- Retracement Gann pour s'adapter plus facilement au grosse réactions de marché comparé au fibonacci qui sont plus adapté a des mouvement de vagues , a cela est adapté du LSMA pour l'indication claire et net de la tendance lors du cross .
- Oscillateur de prix moyen pondéré en fonction du volume .
- ATR 14 pour calculer la tendance de la journée par rapport a la volatilité en cas de changement de tendance ou cassure Resistance/Support .
- RSX de Jurik pour évitez les bruit de mèches du RSI qui n'ont pas leurs place dans une stratégie de tendance .
- RSX-D pour les safe stop en petites UTs .
- BULL BEAR power trend en suppléments pour les confirmations de changements de tendance , ou confirmations de tendance .
- Indice d'agitation (CHOP) pour voir si les loups sont agités et si le scalp en vos le coup compte tenu de la volatilité , pour une compréhension de l'indicateur ; les valeurs plus élevées indiquent une consolidation, tandis que les valeurs moins élevées indiquent des tendances directionnelles .
-Slow Stochastic pour les entrée en tendance .
- Confiance du marché par rapport a la journée précédentes 0 = manque de confiance du marché , 100 = confiance en ce marché (volumes de transactions constant) .
- Bandes de Bollinger .
- Pivots courts(200 périodes ) , moyens(500 périodes ) , longs thermes (1400 périodes ) .
- Jurik MA pour éviter les bruits et les décalages temporaires des MA qui peuvent nous faire perdre un temps précieux sur un retournement de tendance .
- Volume Delta pour le calcul de l'offre et la demande suivant les zones de distributions .
- Klinger Volume pour déterminer la tendance haussière ou baissière des prix en intraday produit par la pression des acheteurs ou vendeurs et retenir les points haut/bas .
- Moyennes mobiles 55/200/400/800/1200 .
- Ichimoku spécial crypto 20-60-120-30 .
- Nuage Supertrend double setup (2-44 4-144) pour les invalidations (3-10 6-10) pour les entrées .
Tout cela accompagné d'un label pour un aperçu du trade en un coup d'œil
Tout compléments ou back testing que ce soit BTCUSDT / ETHUSDT est toujours le bienvenue
===================================================================================================================
Note: Testé avec différentes UT en PaperTrading avant tout trades en argent Réel
- Unité de temps préféré = m3
- Paires preféré = BTC_USDTPerp
===================================================================================================================
For english community
I present to you Quadropocket (Script with config by default for cross Leverage) to you to adapt your levies or your holds
It consists of:
- Retracement Gann to adapt more easily to large market reactions compared to fibonacci which are more adapted to wave movements, this is adapted from LSMA for the clear and clear indication of the trend during the cross.
- Volume weighted average price oscillator.
- ATR 14 to calculate the trend of the day in relation to the volatility in the event of a trend change or Resistance / Support breakout.
- Jurik's RSX to avoid the noise of RSI bits that have no place in a trend strategy.
Jurik RSX
- RSX-D for safe stops in small UTs.
RSX-D
- BULL BEAR power trend in supplements for confirmations of trend changes, or confirmations of trend.
Bull Bear Power Trend
- Agitation index (CHOP) to see if the wolves are agitated and if the scalp in your shot given the volatility, for an understanding of the indicator; higher values indicate consolidation, while lower values indicate directional trends.
-Slow Stochastic for entry into trend.
- Market confidence compared to the previous day 0 = lack of confidence in the market, 100 = confidence in this market (constant transaction volumes).
Excel Confidence%
- Bollinger bands.
- Short pivot (200 periods), medium (500 periods), long thermal baths (1400 periods).
- Jurik MA to avoid noise and temporary shifts in MA which can waste precious time on a trend reversal.
Jurik Moving Average
- Delta volume for the calculation of supply and demand according to the distribution zones.
- Klinger Volume to determine the upward or downward trend in intraday prices produced by pressure from buyers or sellers and retain high / low points.
- Moving averages 55/200/400/800/1200.
- Special crypto Ichimoku 20-60-120-30.
- Nuage Supertrend double setup (2-44 4-144) for invalidations (3-10 6-10) for entries.
All this accompanied by a label for an overview of the trade at a glance
Any additions or back testing whether BTCUSDT / ETHUSDT is always welcome
=================================================== =================================================== ===============
Note: Tested with different TUs in PaperTrading before any real money trades
- Preferred unit of time = m3
- Preferred pairs = BTC_USDTPerp
=================================================== =================================================== ===============
[ADOL_]ARVIS 4 Whale
ENG) The fourth version of ARVIS BOT This is an upgraded version of ARVIS 4. ARVIS4 🐳(Whale)
- Lighten ARVIS 4 The ARVIS 4 is a bit heavy to compensate for the slow loading, and combines the standards of the new TD .
- By upgrading the coastline, the trend-following notation was changed to be legible, and the signal generation was processed as a background to make it simple.
- Sales statistics output has been added. It enters at the average of the opening and closing prices, and closes at the closing price. As it is liquidated at the closing price, when the bot is driven
It is possible to prevent the situation from entering the section where the signal appears and disappears.
principle)
Features of the new core logic:
- You can set an alert for the TD indicator that could not be set before. TD indicators are numbered 1-9 in Settings - Appearance.
- Setup: Numbers floating above (below) the candle, in ascending and descending order (=sequence) from 1 to 9. Compare with previous candles.
That principle is the part of reasoning that no one explains. I think regularity reflects the theory of the Fibonacci sequence.
The Fibonacci sequence is a number in the golden ratio that makes up nature.
option)
- The indicator plotting range indicates the range in which to display the indicator.
- Setting is for shoreline and breakwater, and is set to the optimum value. It can be used as a basis for support/resistance by breaking through shorelines and breakwaters.
- In Big Trend, the trend judgment standard and trend length are displayed. The trend judgment criteria and trend length based on ICHIMOKU determine the uptrend and the downtrend long.
"You can see the guide by hovering the mouse over ⓘ in the indicator."
- Volume above the average trading volume determines the power of the candle.
- Mark the flow of the stochastic on the candle. Added more filtering of the moving average by augmenting the existing one.
SMA , EMA , HMA , RMA , WMA , VWMA can be selected from the options.
- Added ARVIS 3 version of HTF signal. It is displayed with a light green and red background.
- Real long and real short are key signals. It is displayed on a dark green and red background.
- Fixed an error and signal location where the swing-based heart shot and heart long did not appear at the intersection.
- Super Swing has been added. SS is indicated along the trend direction by the square ( ■ ) at the top.
Principle of core function (Example of picture explanation)
time frame)
- Available in all timeframes.
alarm)
- You can set up alerts for setup, down long, up short, real long, real short, and heart.
trading method)
- Follow the signals Real Long🥝 Short🍅 , Heart Long💚 Short❤ It depends on the color of the background.
- After entering L and S, 9🎯 can be used as a split blade position.
- Follow the downtrend📈🛐 uphill short📉🛐 as the trend criterion. You can change the settings.
- When you select theme 1 in SC , you can use it like Heikin Ashi, and when you select theme 3, you can find overbought and oversold.
reference)
You are solely responsible for all trading decisions and investments you make.
How to use)
It is set to be available only to invited users. When invited, tap Add Indicator to Favorites at the bottom of the indicator.
If you click the indicator at the top of the chart screen and look at the left tab, there is a Favorites tab. Add an indicator by clicking the indicator name in the Favorites tab.
----------------------------------------------------------------------------------------------------------------------------------------------------------------------------------------------------------------
KOR) ARVIS BOT의 네번째 버전 ARVIS 4의 업그레이드 버전입니다. ARVIS4 🐳(Whale)
- ARVIS 4를 경량화합니다. ARVIS 4가 다소 무거워 로딩이 느려지는 부분을 보완하고, 새로운 TD의 기준을 결합합니다.
- 해안선을 업그레이드 하여 추세를 따르는 표기를 가독성 있게 변경하고, 시그널 발생을 배경으로 처리하여 심플하게 구성하였습니다.
- 매매통계 출력이 추가되었습니다. 시가와 종가의 평균으로 진입하며, 종가로 청산합니다. 종가로 청산하므로, 봇구동시
신호가 떴다가 사라지는 구간에 진입이 되버리는 사태를 방지할 수 있게 됩니다.
원리)
새로운 핵심적인 로직의 기능 :
- 기존에 설정할 수 없었던, TD지표의 얼러트를 설정할 수 있습니다. TD 지표는 설정 - 모습에서 1~9까지의 숫자로 나타납니다.
- 셋업 : 캔들위(아래)에 플로팅 되는 숫자로 1~9까지의 오름차순, 내림차순 (=시퀀스)으로 구성됩니다. 4개이전의 캔들과 비교합니다.
해당 원리는 아무도 설명해주지 않는 추론의 부분입니다. 규칙성에는 피보나치 수열의 이론이 반영되어 있다고 봅니다.
피보나치 수열이란 자연을 이루는 황금비율의 숫자로 1.1.2.3.5.8.13.21.34.55.89... n번째와 n+1번째 숫자의 합이 n+2번째가 됩니다.
옵션)
- 지표 플로팅 범위는 지표를 표시할 범위를 나타냅니다.
- Setting은 해안선과 방파제에 관한 설정이며, 최적값으로 설정되어 있습니다. 해안선과 방파제를 돌파, 지지/저항의 기준으로 활용가능합니다.
- Big Trend에서는 추세판단 기준과 추세길이가 표시됩니다. ICHIMOKU기반으로 만들어진 추세판단 기준과 추세길이는 오름숏과 내림롱을 결정합니다.
"지표내 ⓘ 위에 마우스를 올리면 안내를 볼 수 있습니다."
- 거래량 평균이상의 Volume을 캔들의 힘을 가려냅니다.
- 스토캐스틱의 흐름을 캔들에 표기합니다. 기존의 것을 보강하여 더 많은 이평선의 필터링을 추가하였습니다.
SMA , EMA , HMA , RMA, WMA , VWMA 를 옵션에서 선택가능합니다.
- ARVIS 3 버전의 HTF 시그널을 추가하였습니다. 옅은 초록색과 빨간색 배경으로 표시됩니다.
- 리얼 롱, 리얼숏은 핵심적인 시그널이 됩니다. 진한 초록색과 빨간색 배경으로 표시됩니다.
- 스윙 기준의 하트숏과 하트롱이 교차로 출현하지 못하는 오류와 신호 위치를 수정하였습니다.
- Super Swing이 추가되었습니다. SS는 상단의 스퀘어( ■ ) 로 추세 방향에 따라 표시됩니다.
핵심기능의 원리 그림 설명 예시)
타임프레임)
- 모든 시간프레임에서 사용가능합니다.
알람)
- 셋업과 내림롱, 오름숏, 리얼롱, 리얼숏, Heart 에 얼러트를 설정할 수 있습니다.
매매방법)
- Real Long🥝 Short🍅 , Heart Long💚 Short❤ 신호를 따르십시오. 배경의 색상에 따릅니다.
- L, S에 진입후 9🎯 을 분할 익절 자리로 활용할 수 있습니다.
- 내림롱📈🛐 오름숏📉🛐 을 추세 기준으로 따르십시오. 설정값을 변경할 수 있습니다.
- SC에서 테마1을 선택시 하이킨 아시 처럼 사용가능하며, 테마3을 선택시 과매수, 과매도를 찾을 수 있습니다.
참고)
귀하가 내리는 모든 거래 결정과 투자에 관한 것은 전적으로 귀하의 책임입니다.
사용방법)
초대된 사용자만 사용할 수 있도록 설정이 되어있습니다. 초대를 받을 경우, 지표 하단의 즐겨찾기에 인디케이터 넣기를 누릅니다.
차트화면 상단에 지표를 눌러서 왼쪽탭에 보면 즐겨찾기 탭이 있습니다. 즐겨찾기 탭에서 지표이름을 눌러서 지표를 추가합니다.

[ADOL_]ARVIS 3ENG) This is version 3 of ARVIS BOT. ARVIS 3
Since it is a new version with a completely different identity from Trend Break, we do not use the name Trend Break.
It is a version made lighter in the existing version and newly created logic.
Existing ARVIS users can use versions 1, 2, 3 and 3R auxiliary tools to be added without additional rights.
Optional use is possible.
principle)
Features of the new core logic:
It was created considering the relative strength RSI and the ICHIMOKU moving average.
Identify the trend strength to generate a long and short reversal signal at the reversal of the trend.
By using HTF signal, it is possible to bring the signal of the upper time to the smaller time.
By using HTF, the candle splits and the standard maintains the flow of time.
A method was used to reduce the whipsaw of frequent signal appearances.
option)
A volatility warning notification has been included. A function that alerts you before volatility increases.
It is indicated in the form of ■ at the bottom of the chart.
You can optionally set the signal range.
Dynamic Fibonacci moving along the candlestick was applied. 0.5 is used as a criterion for determining a large trend.
By combining the RSI and the moving average, you can apply a background that utilizes the RSI as a sensitivity.
By combining RSI and Stochastic, the overbought/oversold section was output as the background.
You can output overbought/oversold at the desired time as a background.
Up/down divergence included as background.
Black is downward divergence and white is upward divergence.
In the lower right corner, an indicator for the probability of a long is added by combining the multiple moving averages and the figures analyzed for the convergence trend.
50% is used as a reference point for long/short conversion, 10~20% is considered oversold section, and 80~90% is considered overbought section.
It can be used as a reference point for counter-trend trading. Probability indicators allow you to increase your judgment with visualized numbers.
principle example)
time frame)
Recommended time frame: 15-minute peaks >> 1-hour peaks > 1.3-minute peaks = 4 hour peaks = daily
alarm)
Various alert functions are available. based on the alert signal
When trading, various signals help to set specific conditions.
- HTF Long Short , Alert
- Volatility warning alert
- Basic long and short alerts
- Up/down divergence alert
trading method)
1. Utilize SIGNAL1 L,S signals. It is a similar approach to the existing manual bot mode.
2.SIGNAL2's , signals can bring high-time signals to buy and sell. This is a similar approach to the existing autobot mode.
If you bring a high time signal to a small time, you can refine the hit point, so in this case, use SIGNAL2 of 15 minutes or longer.
SIGNAL2 15-minute view at 3-minute peak, SIGNAL 1 hour view at 15-minute peak, and SIGNAL 4 hour view at 1-hour peak are recommended values.
3-1. Entry criteria/stop loss criteria (when trading hands and bots)
- entry criteria; Follow the signal.
- Stop loss criteria;
Use fixed stop loss: Set 1% fixed stop loss section from signal generation. (% is set individually)
Use Candle Stop Loss: Set a stop loss when the low or high point of the signal generating bar collapses.
Use flow stop loss: Set the stop loss considering the flow of the wave.
3-2. Entry criteria/stop loss criteria (in case of signal-based bot trading)
- It is not recommended to use more than 3x magnification. The above entry requires manual intervention and risk management.
It switches every time the opposite signal appears after entering without setting the stop loss separately.
Example of using the 15-minute HTF signal in the 3-minute scale
4. Note
You are solely responsible for any trading decisions you make.
ARVIS 3R indicator will be updated. Required for use of ARVIS 3
This is an additional feature. It is created as an indicator at the bottom, not as a candle chart.
5. How to use
It is set to be available only to invited users. When invited,
Tap Add Indicator to Favorites at the bottom of the indicator.
If you click the indicator at the top of the chart screen and look at the left tab, there is a Favorites tab.
Add an indicator by clicking the indicator name in the Favorites tab.
KOR) ARVIS BOT의 3버전입니다. ARVIS 3
Trend Break와 정체성을 완전히 달리한 신버전이므로
더이상 Trend Break 의 명칭을 쓰지 않습니다.
기존버전을 경량화하고 로직을 새롭게 만든 버전입니다.
기존의 ARVIS 이용자는 추가 권한 없이 1,2,3버전과 추가될 3R보조도구의
선택 활용이 가능합니다.
원리)
새로운 핵심적인 로직의 기능 :
상대강도인 RSI와 ICHIMOKU 이평선을 고려하여 만들어졌습니다.
추세강도를 파악해 추세의 전환자리에서 롱과 숏의 전환 신호를 발생시키도록 합니다.
HTF신호를 이용하여 상위 시간의 신호를 작은 시간대로 가져올 수 있습니다.
HTF를 활용함으로써 캔들은 쪼개고 기준은 상위 시간의 흐름을 유지해
잦은 신호출현의 휩쏘를 줄이는 방법을 사용하였습니다.
옵션)
변동성 경고 알림이 포함되었습니다. 변동성이 커지기 전에 미리 알려주는 기능으로
차트하단에 ■ 형태로 표기됩니다.
시그널의 범위를 옵션으로 설정할 수 있습니다.
캔들을 따라 움직이는 동적 피보나치가 적용되었습니다. 0.5를 큰 추세 판단 기준으로 활용합니다.
RSI와 이평선을 결합하여 RSI를 민감도로 활용한 배경을 적용할 수 있습니다.
RSI와 스토캐스틱을 결합하여 과매수/과매도구간을 배경으로 출력하였습니다.
원하는 시간의 과매수/과매도를 배경으로 출력할 수 있습니다.
상승/하락 다이버전스가 배경으로 포함되었습니다.
검은색은 하락다이버전스, 흰색은 상승다이버전스입니다.
우측하단에 다중이평선과 수렴추세를 분석한 수치를 종합하여 롱의 확률에 대한 표시기가 추가되었습니다.
50%는 롱/숏의 전환 기준점으로 활용하며, 10~20%는 과매도 구간, 80~90%는 과매수 구간으로 간주하여
역추세 매매의 기준점으로 활용할 수 있습니다. 확률 표시기를 통해 가시화된 수치로 판단을 높일 수 있습니다.
원리 예시)
타임프레임)
추천타임프레임 : 15분봉 >> 1시간봉 > 1,3분봉 = 4시간봉 = 일봉
알람)
다양한 얼러트 기능을 사용할 수 있습니다. 얼러트 신호를 기반으로
매매시 다양한 신호는 구체적 조건 설정에 도움이 됩니다.
- HTF 롱숏🥵,🥶 얼러트
- 변동성 경고 얼러트
- 기본 롱,숏 얼러트
- 상승/하락 다이버전스 얼러트
매매방법)
1. SIGNAL1 L,S 신호를 활용합니다. 기존의 수동봇 모드와 비슷한 접근입니다.
2.SIGNAL2의 🥵,🥶 신호는 높은 시간의 신호를 가져와 매매할 수 있습니다. 기존의 자동봇 모드와 비슷한 접근입니다.
높은 시간대의 신호를 작은시간으로 가져오면 타점을 정교화 할 수 있으므로, 이와같은 경우 15분 이상의 SIGNAL2를 활용합니다.
3분봉에서 SIGNAL2 15분 보기, 15분봉에서 SIGNAL 1시간 보기, 1시간봉에서 SIGNAL 4시간 보기가 추천값입니다.
3-1. 진입기준/손절기준(손,봇 매매시)
- 진입기준; 시그널을 따릅니다.
- 손절기준;
고정손절가 이용 : 시그널 발생으로부터 1% 고정 손절가 구간을 설정합니다.(%는 개별로 설정)
캔들손절가 이용 : 시그널 발생봉의 저점이나 고점이 무너지면 손절을 설정합니다.
흐름손절가 이용 : 파동의 흐름을 고려하여 손절을 설정합니다.
3-2. 진입기준/손절기준(신호기반 봇 매매시)
- 3배율 이상을 권장하지 않습니다. 이상의 진입은 수동개입으로 리스크관리가 필요합니다.
손절가를 따로 설정하지 않고 진입후 반대신호가 뜰때마다 스위칭을 합니다.
3분봉에서 15분HTF 신호사용의 예시
4. 참고
귀하가 내리는 모든 거래 결정은 전적으로 귀하의 책임입니다.
ARVIS 3R 지표가 업데이트 예정입니다. ARVIS 3의 활용에 필요한
부가적인 기능입니다. 캔들차트가 아닌 하단의 지표로 생성됩니다.
5. 사용방법
초대된 사용자만 사용할 수 있도록 설정이 되어있습니다. 초대를 받을 경우,
지표 하단의 즐겨찾기에 인디케이터 넣기를 누릅니다.
차트화면 상단에 지표를 눌러서 왼쪽탭에 보면 즐겨찾기 탭이 있습니다.
즐겨찾기 탭에서 지표이름을 눌러서 지표를 추가합니다.

ComboTrade V.2.1 (BuySell Signals,Take profit,4MA,Fibo,Ichi+QL)A WORD WITH ESTEEMED TRADERS:
The type of indicator that a trader uses to create a strategy depends on the type of strategy he intends to employ; this is related to the trading style and the trader's loss tolerance.
A trader looking for a long-term trade with high profits may adopt a follow-up strategy, and on the other hand, a trader who decides to make short-term trades with frequent but low profits may be eager to use a strategy based on price fluctuations. Different types of indicators can be used to confirm the results.
Indicators alone should not be used as a tool to make trading decisions. Instead, every trader should use indicators to receive trading signals and formulate trading strategies and determine his or her exact method.
Brief and essential description:
With the above description, traders are advised to use the ComboTrade indicator as a trading assistant. Using the tools embedded in this trading assistant makes it easy for traders and depending on the trading strategy, you can get the best result for positioning.
Note 1: The trading time frame for ComboTrade with over one hour (1H) will achieve best result. Checking out the lower time frame to buy or sell as a confirmation is recommended.
Note 2: At Trading View home screen choose “ Candles or ...” as “Bar’s Style”.
Once you added ComboTrade into to your chart, go to the setting gear of the ComboTrade indicator, which includes two sections: “Input” and “Style”.
The “Input” section is for the input values of the indicators and the “Style” section is for activating and deactivating the tools.
Activate Moving Average 7, 21, 50 and 200 with close (Default)
Activate Combo Cloud by tick the “Show ichimoku” if you use it (Default)
By activating ichimoku, three components will be added to the Como Cloud with below details:
1- The “Quality Line” shows the quality line (26 Kijun-sen future candlesticks) which helps the trader to understand the direction of the trend and will help the trader to make a decision.
2. The “Period Line” shows the 103-day period and can act as a support and resistance tool. In addition, this number can be changed.
3- The intersection of various Como cloud lines has also been installed.
The TP (Take Profit) signal indicates a similar buy or sell area using the RSI and Stochastic oscillators, and be sure to pay special attention to it. Be sure to tick the related box (TP) at “Style” section.
The “Trailing Stop” at “Style” section acts as a support and resistance line. It acts as a support when the price candle is placed above the Trailing Stop line and as a resistance if the price candle is placed below the Trailing Stop line.
At “Bot Key Value” in “Input” section, the number is adjustable from 0.25 to any number. According to the trader's strategy, the number of input and output signals in this section can be adjusted. The best number for BTC is 0.78 and for Altcoins is 0.78 to 1.
At “Bot ATR Period” in “Input” section, the best default number is 8. The best values for Altcoins is 8 to 10, which has a significant effect on the regulation of signaling and support and authority lines.
The “Bot Buy” and “Bot Sell” at “Style” section are the main and most important parts of the indicator that you must tick in order to active them both.
“Plot Background” can activate the Como Cloud and set it to green (ascending) and red (descending).
The “Labels” and “Lines” are related to the important Fibonacci tool, which by displaying the lines of the Fibonacci lines and by activating the label, the numbers related to the price and the Fibonacci numbers are displayed. It helps traders to extract data from the last few days.
DISCLAIMER:
ALL DECISIONS AND RISK MANAGEMENT, ETC. ARE THE FULL RESPONSIBILITY OF THE TRADER AND THE AUTHOR IS NOT RESPONSIBLE FOR THE POSITIONS AND THE RESULTS OF THE TRADES (POSSIBLE LOSSES) IN ANY WAYS. DO YOUR OWN RESEARCH (DYOR) BEFORE ENTERING/ EXISTING IN TO/ FROM ANY POSITIONS.
Please like and use your comments after using the indicator.
Always be Profitable!
JebraTrade
14 April 2021

Buy/Sell Alert EMA with SuperFormula by zdmre*** Use it at your own risk
This indicator has 3 indicators and gives a buy/sell signal depending on the EMA.
3 indicators:
- Ichimoku
- Bollinger Band
- EMA
It also shows the value on the candle as a warning in the Buy and Sell signals. This value is calculated with a special formula I have created.
On the other hand Bollinger Band and Ichimoku Cloud are also included to check the accuracy of the signals.
For this indicator, I recommend a minimum of 4 hours chart.
TradeChartist Drifter Lite™TradeChartist Drifter Lite is an adeptly designed, functional and a visual indicator that plots trend-following Auto-Fibs , based on user defined lookback length, and includes the Ichimoku Cloud to help visualize the Price action in relation to the Support and Resistance limits of the Auto-Fibs.
What are the Drifter limits and Drifter Auto-fibs based on?
Drifter limits are based on the highest and lowest of the open/close values of the user defined Drifter Length (Default - 144).
These limits form the 0% and 100% Fib retracements, which help derive the 23.6%, 38.2%, 50%, 61.8% and 76.4% Auto-Fib plots of the Drifter.
Why is the Kumo of the Ichimoku included in the Drifter?
When the price enters the oversold/overbought zones of the Auto-Fibs towards the 100% retracement zones, the price could either come back to test the mean or follow the trend which becomes hard to predict without a secondary confirmator. Kumo cloud helps visualize the trend in relation to it and helps traders make an informed trade decision.
Users can use any of their favourite secondary confirmator like RSI, Stoch, MACD in addition to the cloud to further strengthen their decision.
How does the coloured bars help visualize the price action?
Drifter includes optional coloured bars which paint the price bars with the Bull/Bear strength based on the Drifter length.
The coloured bars help visualise the Bull/Bear power hold and also helps spot visible exhaustion which is a useful feature and acts as a good confirmator too.

Trend Indicators CollectionAnalyses MACD crosses with Ichimoku cloud direction and state
General idea:
- MACD crosses usually point to a change in trend direction and Kumo state and direction often act as a confirmation as well as a trend strength indicator. Using this, the script points out where there were was or can be a point where the trend change may have the strength to carry on.
Buy warnings:
- This warning will be triggered in two ways, both of them only if MACD is above EMA and the current close price is over Kumo:
- Senku span A crosses over Senku B (Kumo turns positive) when MACD is already positive
- MACD turns positive when Kumo is already positive
Sell warnings
- Triggered in two ways:
- Kumo turns negative when the current close price is bellow EMA
- The inverse of the above, the current close price falls bellow EMA when the Kumo is already negative
Trend Indicators Collection (TIC) contains:
- MACD, EMA, ADX, Mass index, Ichimoku Cloud, and Pivot points
- Best suited for monthly charts with 30m bars

CroSel Indicator ToolboxA value-packed or all-in-one indicator. The main one is probably the algorithmic signal. I have noticed a few trading groups that rely solely on their algo trading signals. I have derived my own using MACD . I find that it works better or just as good as what I have seen. The others indicators are also very powerful and could even be used on a stand alone basis. There are different variations included. I wanted to provide 10x the value at whatever price I would put on this. However I think I've provided at least 20x the expected value. What I like about this is that with more signals, we can visually see confluence. In turn, that should give us traders confidence. The follow is a list of all the indicators I've included so far:
How to use (for all indicators): I suggest using these trade signals as confluence for the main algorithmic trade signals. Aside from MACD and RSI , there are a limited number of signals, but they will all show up within the most recent bars that have passed. Buy when green/lime and sell when red/fuchsia. I suggest experimenting with the the different modes to see what you believe works best for your trading style.
I prefer to use the last signal provided, but I also like to rely on looking at signals as a group, if they are all rising, I'm bullish ; if they are all falling, I'm bearish .
Note on Color Scheme: Red/Fuchsia color means to short/sell and green/lime color means to long/buy.
- Algorithmic signal - provides trade signals. How to use: When there is a green arrow up, it means you should go long. When there is a red arrow down, it means you should exit your long or short sell. If the arrow is lime colored, it means the stock is trending upwards and if the arrow is fuchsia, it means the stock is trending downwards.
- Band and hit count - provides bands to track volatility , as well as tracks the number of times the price hits the upper or lower bands. It also provides candle-to-candle slope as a %. How to use: You can use this to play the odds in your favor. For example: if a stock hits the upper bands 13 times during the morning, and then hits the lower bands 4 times afterwards and then moves upwards away from the lower bands towards the middle of the bands, from here we may be able to say that since 13 is greater than 4, that the stock price may rise again and start hitting the upper bands. Another way I like to use this indicator, is if a stock hits the upper bands more than 16 to 20 times, I like to exit the trade before it has a chance to drop. Lastly, there are zones where a stock price will go above or below 100% or 0% respectively. For example, a stock starts to hit the 110% area of the bands. This could be an excellent time to sell/short the stock.
- Volume surge - provides signals of when volume is increasing/decreasing depending on the color and direction. How to use: Gives you confidence that the price will rise higher/lower.
- EMA 5 & 10 - It is the exponential moving average of the past 5 or 10 bars. It will be either be red or green depending on the slope. How to use: I like to use it as if it were a trend line (which I like to call slanted support/resistance ). For example, if I buy a stock and it falls below EMA 10 I will generally sell the stock, and if it rises past EMA 5 I will generally buy the stock.
- Background color - Background color shows whether the stock is bullish or bearish . If it is green/red, it is slightly bullish / bearish respectively. If it is lime/fuchsia, it is very bullish / bearish respectively. How to use: Take long positions if the background color is greenish(i.e. green/lime) and take short position if the background color is reddish (i.e.red/fuchsia). Please bear in mind, background color will look slightly different if you are already coloring the extended hour session backgrounds.
- Channel Breakout Lines - These lines show the rigid channel that the stock will travel through. How to use: Watch a stock that is in a channel, if it is going up, watch the red dotted line which extends into the future,
if it the stock falls below that previous red dotted line you should sell/short the stock. If a stock is going down, watch the green dotted line, and if the stock goes past the previous green dotted line, you should buy.
- MACD - Moving Average Convergence and Divergence provides trade signals. How to use: 1 turns it off. 2 provides the classic, buy and sell signals based on when the MACD line crosses over or under the signal line. 3 provides faster trade
signals. 4 provides the algorithmic signals. All variations can change according to Algo sensitivity and Algo Signal speed since the algo uses MACD as it's base.
- RSI - Relative Strength Index provides trade signals. How to use: 1 turn it off, 2 turns on and provides the buy and sell signals for above 70 and below 30 RSI respectively. 3 and 4 provide slow and fast RSI trade signals respectively.
4 is my favorite and can be used to provide confluence.
- VWAP - Volume Weighted Average Price . a 2 value is the regular vwap line. A value of 3 or 4 will show that the VWAP line or fill from line until the close is colored
according to slope of EMA 5. How to use: Buy below the VWAP if it shows some support and sell/Short above if it shows some resistance. When the color is red it will show the
- ROC - Rate of Change trade signals. Take note of the circle shaped symbols. Normal mode shows you when the rate of change has crossed the zero line; this can be a very bullish or bearish signal. 3rd mode will gives signals based on whether ROC has stopped making new highs or new lows. 4th mode gives the fastest signals, making it the least risky.
- MFI - Money Flow Index trade Signals. Take note of the Long arrow symbols. Modes work as described.
- BOP - Balance of power trade signals. Take note of the square symbols. The simple mode provides only the biggest trade signals, and the complex mode provides both the biggest and smallest trade signals.
- OBV - A running total of positive and negative volume . Take note of the diamond shaped symbols. Slow signals are really slow. Fast signals are really fast. Use according to your trading speed preference.
- Stochastics - A momentum oscillator that provides trade signals. Take note of the plus shaped symbols and factor them into your judgement on when to trade.
- CCI - Commodity Channel Index trade signals based on momentum. Take note of the X symbols.
- CMF - Chaikin Money Flow trade signals. Take note of the flag symbols.
- ADX - ADX is a component of the Directional Movement System developed by Welles Wilder. When it says to buy, I suggest that you go long, and then before it says to sell you try to sell. And then you can also try to go long before it says to buy. As soon as I see buy, I want to be in the stock and conversely, when I see sell I want to be out of it.
- Price-Volume Divergence - This indicator is a candle by candle indicator which shows that if volume is rising and price is falling, then there is bullish divergence , Conversely if price is rising and volume is falling there is bearish divergence. This a leading indicator.
- Ichimoku Clouds - This indicator just shows the clouds in the Ichimoku cloud system. It can be used to buy under the clouds and sell over the clouds. It can also be used as a possible support/resistance level during an uptrend/downtrend respectively.
- PSAR - Parabolic Stop and Reverse . Denotes uptrends/downtrends, by multiple dotted lines. You can use it by buying/selling when it breaks out of a downtrend/uptrend respectively. Or you can use it to sell/buy during an uptrend/downtrend respectively. Warning: it is generally slow. I find that it's very reliable from a 5 minute perspective.
- Fibonacci levels - People generally use Fibonacci levels for retracement for when a stock pulls back. I personally like to use it as a predictive tool along with looking at the slope. If the slope is negative/positive and moving away/near from 50% line then, I would be bearish / bullish respectively.
- Moving Average ( EMA and SMA ) lines - Exponential moving average and Smooth moving average lines. EMA lines move faster and SMA lines move slower. I like to use these lines as trend lines which can tell me if there is an uptrend or downtrend. The strength of the trend is shown by the distance away from the slowest EMA / SMA lines. I like to sell when it's far above the trendline, and buy when it's closer to the trendline. Be weary of the price crossing trendlines .
- Information Panel - (Price location, Trend Strength, Volatilty Ratio, Current State, Reversal/Continuation Odds): Mode 2 will give you basic price location info. Mode 3 is my favorite and will give you the most info. and Mode 4 will give you the Schwager volatility ratio which can help with stock selection; the higher the ratio, the more movement can be expected.
- Support & Resistance levels - Horizontal dotted lines which show the stock price and where it experiences support/resistance . Can be used in many ways. I like to use it by counting the number of support/resistance lines provided and if support lines exceed resistance lines, I will be more likely to go long.
- Candle Colors - Overlay a color onto the Candles. Note: I encourage the use of Heiken Ashi which helps a lot with low volume candles. Candles can be colored according to their location within the bands, and also according to a trailing stop loss based on Average True Range . Buy low, sell high for the location mode and for the stop loss mode, selling/buying is encouraged when the bars go completely red/green respectively.
- Linear Regression - Draws a (black) line of best fit, and shows 2 standard deviations away from the line of best fit above(red) and below(green). I suggest buying/selling below/above the line of best fit respectively. Strong buys or sells generally occur below or above the standard deviation lines respectively.

EngineeringRobo DeluxeToday we are releasing the EngineeringRobo Deluxe!
New advanced trading tools for traders and investors. The new Robo 4 is extremely powerful !
It works perfectly with other existing strategies as an add-on feature. EngineeringRobo Deluxe has seen major improvements in accuracy of levels, speed and intelligence to detect the best possible trade setups.
This script is equipped with
🔵 EngineeringRobo 4
It offers strategic trading entry and exit points, so you can preserve capital before markets tumble, and take full advantage as they start to rebound. At a glance, market timing indicators tell investors whether market conditions are right or whether it’s safer on the sideline.
Truly unique tool for technical analysis for the financial market as it includes calculation of specific metrics like SAR + MACD + Price Movement.
You no longer have to worry about spending hours in front of the computer looking for a trade.You can use the indicator on every assets available on your broker.
🔵 Change Candle Color
You can change the colors depending on buy 4 and sell 4 signals. It helps traders a lot to see the direction clearly.
🔵 BB Signals :
This strategy uses the MACD indicator together with the Bollinger Bands to sell when the price is above the upper Bollinger Band (and to buy when this value is below the lower band). This simple strategy only triggers when both the MACD and the Bollinger Band indicators are at the same time in a overbought or oversold condition.
Removed Upper & Lower bands & SMA20 from the charts.
To see bands, You can activate the Bollinger Bands on EngineeringRobo - not the Deluxe version.
If you are buying it with BB BUY, No need to wait for BB Sell to sell it. Vice versa.
They are not the opposite to each other. Get your profit at your target level and move on.
🔵 Ultimate MA crossover signals :
As a general guideline,the idea behind trading crossovers is that a short-term moving average above a long-term moving average is an indicator of upward momentum in a stock & crypto , and the opposite is true about a short-term average trading below a long-term average.
For this guideline to be of use, the moving average should have provided insights into trends and trend changes in the past.
Are the settings of SMA 50 & SMA 200 really the best for Golden Cross and Death Cross?
Have you ever tested ROI for MA cross strategies?
Do you think MA 20 and MA 50 are the best pair for traders?
Do you know that Exponential Moving Average ( EMA ) beats the Simple Moving Average ( SMA ) ?
In order to answer these questions we applied some brute mathematical force and tested 1830 different MA combination to find out the best pair through 50 years of data across stock / forex and 5 years of data across crypto markets . We have done the hard work and you get the benefits .
P.S. The oldest date is 1872 on SPCFD:SPX chart on tradingview . Almost 150 years of backtesting is possible from 1872 to 2020!
🔵 Cloud Signals :
This is a strategy made from ichimoku cloud , together with MACD . Changed Ichimoku cloud formula. Based on that we have a long or a short entry.
it is an effective strategy when paired with a trailing stop loss. Removed standard line ( Kijun Sen ), turning line ( Tenkan Sen ), lagging line ( Chikou Span ) and senkou lines, added buy & sell signals. Traders can use EngineeringRobo's cloud to see the clouds on the chart.
This method doesn't work in sideways markets, only in volatile trending markets.
🔵 EMA TrendLines & Custom Moving Average :
Moving averages help traders isolate the trend in a security or market, or the lack of one, and can also signal when a trend may be reversing. Two of the most common types are simple and exponential. We will look at the differences between these two moving averages, helping traders determine which one to use. Simple moving averages and the more complex exponential moving averages help visualize the trend by smoothing out price movements.
Each trader must decide which MA is better for his or her particular strategy. Many shorter-term traders use EMAs because they want to be alerted as soon as the price is moving the other way. Longer-term traders tend to rely on SMAs since these investors aren't rushing to act and prefer to be less actively engaged in their trades.
🟠50 And 200 Day Moving Average Rules
Trend reversal (downtrend to uptrend) - MA 50 crossover MA 200 from below.
Trend reversal (uptrend to downtrend) - MA 50 crossover MA 200 from above.
Weekly open –close above MA 20 ( bullish trend )
Weekly open –close below MA 50 ( Bearish trend )
Super Bullish : The candle is above MA 20 ( Daily )
Bullish : MA 50 Above MA 100 ( Daily )
Bearish : MA 50 below MA 100 ( Daily )
🔵 Fear & Greed Index
This strategy uses two unique EMA indicators in the formula.
1. Use the indicator to identify when investors are greedy.
2. Use the indicator to identify potential bottom levels
For best testing example:
Open BLX Chart, pick 1D time frame, open only FEAR & Greed Index
🟢Green Area : Ready to buy a lot of cryptocurrencies
🔴Red Area : Ready to sell a lot of cryptocurrencies
Price crosses above red line = Entering overbought zone
Price crosses below red line = Exiting overbought zone
Price crosses below green line = Entering oversold zone
Price crosses above green line = Exiting oversold zone
🔵 Automated Trend Channel Lines
It’s 2020 and you are still drawing lines?
The automated trend lines helps you find the best trend lines and you can stop re-drawing over and over. You don't need to flip back and forth between different timeframes. You can let your robo advisor do the work for you.
🔵 Dynamic Support and Resistance Levels
On the most fundamental level, support and resistance are simple concepts. The price finds a level that it’s unable to break through, with this level acting as a barrier of some sort. In the case of support, price finds a “floor,” while in the case of resistance, it finds a “ceiling.”
Basically, you could think of support as a zone of demand and resistance as a zone of supply.
While more traditionally, support and resistance are indicated as lines, the real-world cases are usually not as precise. Bear in mind; the markets aren’t driven by some physical law that prevents them from breaching a specific level. This is why it may be more beneficial to think of support and resistance as areas. You can think of these areas as ranges on a price chart that will likely drive increased activity from traders.
🔵 Automated Fibonacci Retracements
Automatic Fibonacci let you replace subjective manual analysis with objective automated analysis so you always get the best Fibonacci levels, this can really improve the quality of your trading decisions.
Fibonacci retracements are often used to identify the end of a correction or a counter-trend bounce. Corrections and counter-trend bounces often retrace a portion of the prior move. While short 23.6% retracements do occur, the 38.2-61.8% zone covers the most possibilities (with 50% in the middle). This zone may seem big, but it is just a reversal alert zone. One of the best ways to use the Fibonacci retracement tool is to spot potential support and resistance levels and see if they line up with Fibonacci retracement levels.
Even though Fibonacci levels are extremely popular among technical traders, one should not rely solely on Fibonacci retracement and extension levels in trading. Fibonacci tools return the best results when combined with other technical tools, such as trendlines , chart patterns, candlestick patterns, channels or technical indicators.
If you are following any EngineeringRobo Deluxe signals, you should always wait for the candle close before buying or selling.
The signal can come and go anytime during the live candle. ALL indicators do that, that is not considered repainting.
Repainting is when a signal appears, the candle is closed, and when you refresh the chart it disappeared. It is logical that until the candle is closed the signal is not decided yet, hence the alert setup as Once per bar Close.
Deluxe never repaints! Yes, you heard it right: you will never have to worry about signal changing after the candle is closed.
*** Added alarm system alerts for all signals.
________________________________________________________________________ Timeframes _____________________________________________________________________
Our recommendations to get the best results:
Swing Trading Crypto : Use 1D Time Frame Candles
Swing Trading Stocks : Use 1W Time Frame Candles
Swing Trading Commodities : Use 1W Time Frame Candles
Day Trading Crypto : Use 3H Time Frame Candles
Day Trading Stocks : Use 1D Time Frame Candles
Day Trading Commodities : Use 1D Time Frame Candles
Not recommended any other time frames.
What Is Risk-Reward Ratio RRR?
Your risk-reward ratio is how much you risk per trade, relative to how much you expect to make (reward).
When trading with Robo , you should always aim for a bigger reward compared to your risk per trade.
A good rule is only to risk 1% per trade for day traders and 5% per trade for swing trader . Robo follows strong risk management rules on the algorithm .
One of the biggest advantages of algo trading is removing human emotion from the financial markets,humans trading are susceptible to emotions that lead to irrational decisions. Robo doesn't have to think or feel good to make a trade. If conditions are met, it enters.When the trade goes the wrong way or hits a profit target, It exits. It doesn't get angry at the market or feel invincible after making a few good trades.
EngineeringRobo gives you all the tools and information you need for day-to-day trading and investing, while also keeping a great buy and sell signals! No excuse to lose in any financial market anymore! Try now!
How can you add the algorithm into your chart?
1. Login to TradingView.com
2. From the homepage, click on ‘Chart’ in the top navigation bar
3. Select “Indicators” on the top-center-middle panel
4. In the indicator library, type "EngineeringRobo Deluxe "
5. Use the website link below to obtain access to this indicator
The indicator will be added to your chart after It is approved.
7-EMA 3-SMA BB_FiboR Icnimoke and SNRContains of:-
7 EMA
3 SMA
Bollinger Bands
Fibonacci Retracement
Ichimoku
Support and resistance
The idea is, my technique required to use EMA and SMA and bollinger band to monitor trend whether strong or not, then I use Fibonacci retracement to monitor how far it will drop or how far it will go up.
On the other method, I'm using EMA and SMA and Ichimoku to monitor counter that have midterm potential.
The SNR is to calculate my support and resistance which is when to EP, TP and CL. RBS signal is when the price break the resistance, which the price exceed the top of latest length of bar you set. SBR signal indicate where we need to cutloss, when the price lower than bottom of latest of bar you set
All in one indicator. Saves all number of indicator you need. Convenience for free user

Web SlingerIf the candles are above the ichimoku clouds and webstrings, search for BUYS. If the candles are below the ichimoku clouds and webstrings, search for SELLS.
For greater effectiveness operate with the trend (also applying price action and looking for bounce points)
SMA: 9
EMA:5
EMA:9
EMA:10
EMA:15
EMA:20
EMA:25
EMA:30
EMA:35
EMA:40
EMA:45
EMA:50
EMA:55
EMA:60
EMA:65
EMA:70
EMA:75
EMA:80
EMA:85
EMA:90

Gambit's Royal FlushThis script is design for Scalp Trading on the 1 minute chart. There is no specific up or down market that favors this script, it is purely based on when a coin is in a Golden Cross.
The Buy and Sell tags will indicate the best entry and exit point based on how the coin is running.
These Buy and Sell tags are purely to indicate that the other indicators are to be consulted as double confirmation of the entry or exit point.
These indicators include:
1. The Moving Averages are selected to indicate when a coin is either in a Golden Cross (Ready to Buy) or in a Death Cross (Not Ready to buy).
Based on scalp trading styles there are options for a 7, 21, 55, 100 or 200 moving averages, each indicating Golden or Death crosses based on different user's styles.
2. The Bollinger bands along with the lagging span of the Ichimoku Coulds allows you to determine if the coin is ready to break above the Bollinger Band or below it.
3. The Ichimoku Clouds are set to show if the coin is strongly trading above the cloud and using it as support or below it and using the cloud as resistance.
Combining these indicators, set up exactly as we learn in the HODLNOTS training course allows up to make consistent and successful scalp trades.
Please feel free to reach out to me on Telegram or TradingView to gain access to this script or if there are any other questions or uncertainties around this script.
I will do my best to explain and also update this description until it is fully understandable.
MA 10,20,50,200Indicator consist of moving averages (MA).
This indicator make it easier for me to switch between few MA lines.
1. MA10
- used for intraday.
2. MA50 and Ichimoku
- to analyze swing trend
- display only MA50 and ichimoku cloud
3. MA20, MA50 and MA200
- to analyze the trend
- for swing trade
4. Lines 52 Week High / Low
- display both lines as guide when trading
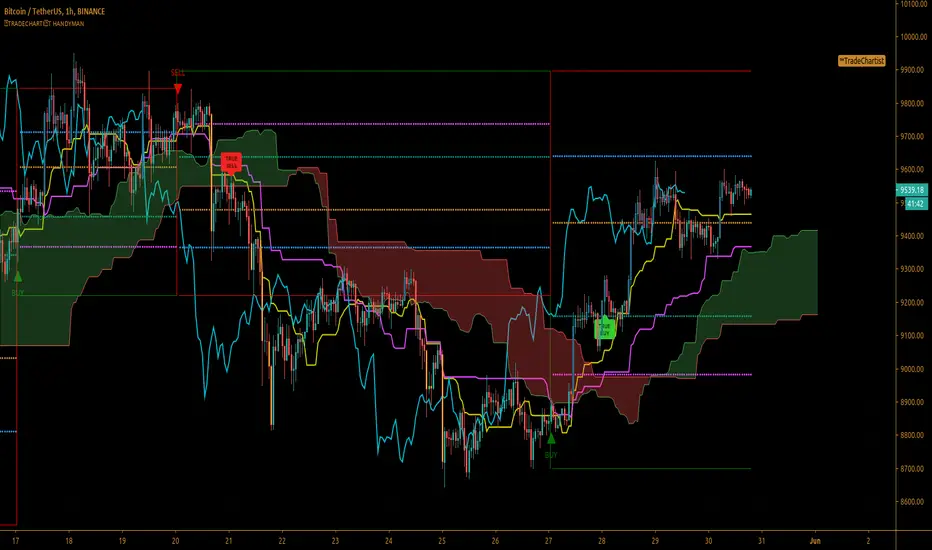
™ᴛʀᴀᴅᴇᴄʜᴀʀᴛɪꜱᴛ ʜᴀɴᴅʏᴍᴀɴ™ᴛʀᴀᴅᴇᴄʜᴀʀᴛɪꜱᴛ ʜᴀɴᴅʏᴍᴀɴ is a well designed utility script that helps plot a few important trading indicators like Bollinger bands, EMA , Ichimoku Cloud etc. along with repainting Buy/Sell signals based on Zig-Zag (Heikin Ashi trend) which can be used cautiously with levels generated.
What does ™ᴛʀᴀᴅᴇᴄʜᴀʀᴛɪꜱᴛ ʜᴀɴᴅʏᴍᴀɴ do?
Plots Bollinger Bands
Plots EMA
Plots VWMA and VWAP
Plots Ichimoku Cloud
Plots Zig-Zag based trade signals - Use with confirmation from other indicators above
---- CAUTION : Signals REPAINT as they are based on developing Zig-Zag
---- Option to plot Last True Non-Painted Signal label
---- Option to plot Fibonacci retracement levels to last known Zig-Zag high/low
based on highest/lowest of 2 trend changing up/down Heikin Ashi candles
---- Type of trade can be opted from indicator settings.
Plots RSI Color Candles
Note : This script is a good tool to get confirmations but Trade Signals cannot be used as definitive entry/exit points. This is the reason why there are no alerts coded for the signals.
Also, this script generates signals the same way as one of my first scripts, Alcides Indicator Lite, but has more trade options + more utilities to choose from indicator settings.
GBP-USD 1hr on Swing trade mode