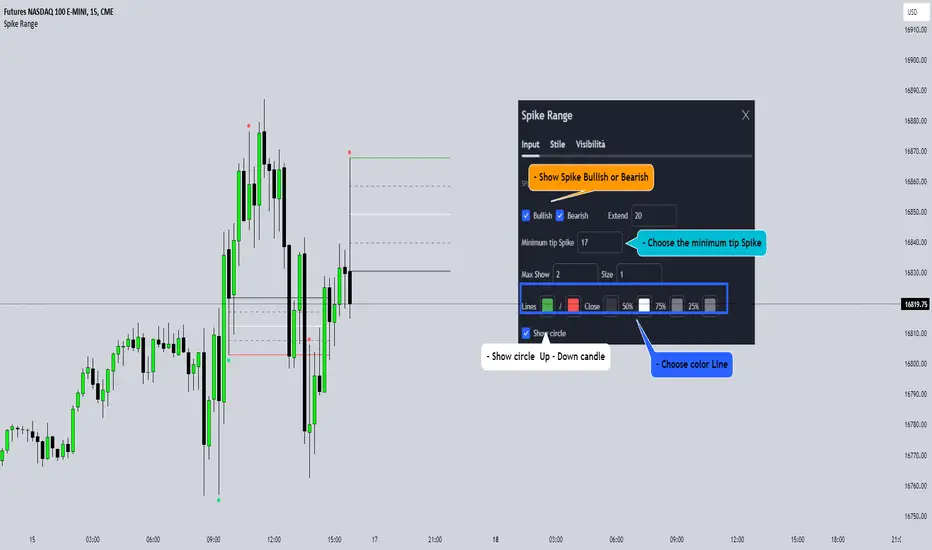
Spike RangeGuided by new ICT tutoring, I create this versatile Spike Range
This indicator shows a different way on how to display "Spikes or Shadows" based on their size,
the indicator divides the "Spike or Shadows" into levels 0.5 - 0.75 - 0.25 Fibonacci, giving the possibility of viewing the "Spike or Shadows" with a certain size and being able to use them as continuation or reversal zones
The user has the possibility to:
- Choose the size of the "Spike or Shadows"
- Choose to view "Spike or Shadows" levels
- Choose to show only bullish or only bearish "Spike or Shadows" levels
The indicator should be used as ICT shows in its concepts.
The indicator takes into account the "Spades or Shadows" that have a certain size (based on the minimum range set)
These Spikes can be rated as "FVG" so you can expect reactions on the levels it marks, considering a reversal or continuation based on the range being respected
If the Spike is Bullish and the Price closes by invalidating 50% of the range we can evaluate a possible entry up to the High of the Spike
Below is an example of how to use them:
Invalidades Range
Respect Range
Cari dalam skrip untuk "ict"
Seek liquidityGuided by ICT tutoring, I create this versatile "Seek liquidity" indicator.
This indicator shows an easy way to view the Liquidity that has been Created - Eliminated - and what liquidity is left to eliminate.
Liquidity levels appear after the sessions are over, and the lines get stuck on the candle that eliminates them.
Timing session =
//---Asian
- 18:00-00:00
//---London
- 00:00-02:00
- 02:00-05:00
- 00:00-06:00
//---New York
- 06:00-12:00
- 09.30-12.00
//---Lunch
- 12:00-13:30
//---PM
- 1.30pm - 4.00pm
- 12:00-18:00
The user has the possibility to:
- Choose whether or not to view sessions
- Choose to show levels from previous sessions
- Choose to show today's session levels
- Choose whether to view the boxes
- Choose to view the division is open daily
The indicator should be used as ICT shows in its concepts, the indicator takes into consideration both the previous and today's Liquidity, and the session levels can be used for a reversal as in the example below:

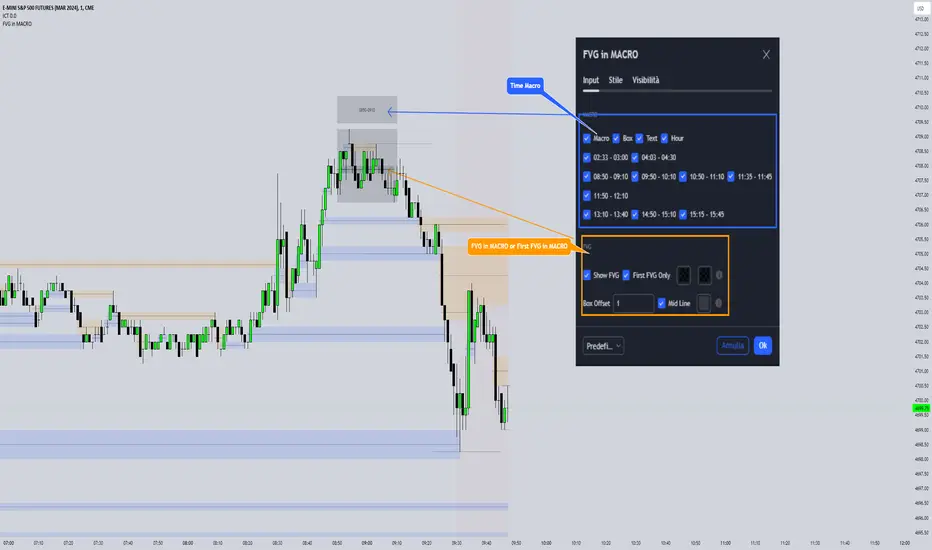
FVG in MACROGuided by ICT tutoring, I created this versatile indicator to scan the FVG in MACRO time.
This indicator combines the MACRO time with the Fair value GAP (FVG) in an alternative way, showing a simple way of viewing the FVG within the MACRO time, so you can have a clearer view of which direction the MACRO is influencing
''MACRO is a delivery time frame of the interbank price in which it undergoes a series of controls and is likely to move towards liquidity.''
The user has the possibility to:
- Choose the relevant MACRO time
- Choose whether to view all FVGs in the MACROS
- Choose to view only the First FVG at each MACRO
The indicator should be used as shown by the ICT in its concepts, during the MACRO time the price can consolidate or can head towards liquidity.
The probability that the direction is correct increases with respect for the FVG, in this way it is possible to evaluate the entry zone in the FVG and the Take profit zone for Liquidity
As in the following example:
Interest Rate and GDP Dashboard by toodegreesDescription:
The Interest Rate and GDP Dashboard is a powerful tool designed to provide traders with valuable insights into Interest Rate and Gross Domestic Product (GDP) of the largest Central Banks.
Interest Rates are closely monitored from all around the world, and play a massive role in Interbank Institutional Trading. Although mainly used by Forex traders, it's important for all types of analysts to understand risk-on and risk-off environments in respective currencies, or other asset classes, based on a global financial landscape.
Forex Pair Dashboard ( FOREXCOM:EURUSD ):
Non-Forex Pair Dashboard ( CME_MINI:ES1! ):
This tool displays the Live Interest Rates (as well as latest Interest Rate Change) and GDP, of the following countries/regions:
Australia
Canada
Europe
Japan
New Zealand
Switzerland
United Kingdom
United States
Further, analysts will be able to see Interest Rate Change labels directly on chart, to monitor Time and price relationship following rate hikes or rate cuts. The labels will display according to the impact of the Interest Rate Change on the current asset on chart, and their tooltips will display the %Change:
Analysts can also choose to mark Interest Rate Changes with vertical lines, to aid in marking changes in sentiment or global financial environment:
The real power and value provided by this tool is its tailored Interest Rate (and GDP) Differential feature for Forex markets, based on the Interest Rate Differential concept as taught by the Inner Circle Trader (ICT).
Using Interest Rate Differentials as a further Long Term Bias factor was introduced by ICT in conjunction with other higher Timeframe principles like Seasonal Tendency, Commitment of Traders, and Open Interest. This fusion ensures a holistic approach to dissecting specific Forex pairs, and the involvement of Institutional traders.
Key Features:
Dynamically calculates and organizes the dashboard to display the interest rate differential of the chart's forex pair, or displays all if outside of forex markets.
Pinpoint historical interest rate changes with precision using vertical lines and/or dynamic labels with tooltips.
Other Features:
Toggle Options: Customize your viewing experience by toggling the display of previous rate changes, enabling or disabling GDP visibility, and tailoring the size and location of the dashboard.
Fine-tune Visuals: Adjust the size and style of the previous interest rate labels and lines to suit your preferences, offering a personalized touch to your analytical workspace.
Usage Guidance:
Add the Interest Rate and GDP Dashboard to your Tradingview chart.
Tailor your experience by customizing the table and style to be in line with your analytical preferences, ensuring a visually engaging and personalized chart.
Observe where and when key Interest Rate decisions impact the macro trend or market environment.
Leverage this invaluable information to shape your Higher Timeframe narrative in confluence with other tools.

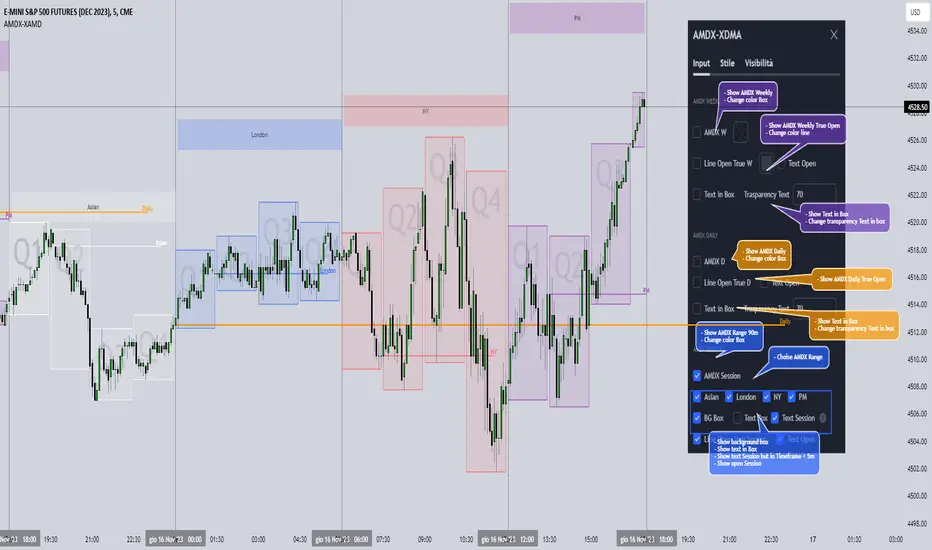
AMDX-XAMDGuided by ICT tutoring and also inspired by the teaching of
Daye', I create this versatile "AMDX" indicator.
A = Accumulation
M = Manipulation
D = Distribution
X = Continuation Or Reversal
This indicator shows a different way of viewing all the Timeframes by dividing them into Quarters, in this context the Trading sessions are divided into a 90m cycle, dividing each time range into Q1-Q2-Q3-Q4, in this way you have a clear vision of what the price is likely to do
True Open Times =
Opening Week - Monday at 6pm
Opening Day - 00:00
Asia -7.30pm
London -01.30
New York -07:30
PM -1.30pm
Session Times =
Q1 Asia 18:00-00:00
Q2 London 00:00-06:00
Q3 New York 06:00-12:00
Q4 PM 12:00-18:00
The user has the possibility to:
- Choose whether to display AMDX W
- Choose whether to display AMDX D
- Choose whether to display AMDX Session
- Choose to show the text in the Box
- Choose to show open levels
The indicator should be used as ICT and 'Daye' show in their concepts.
The indicator divides everything into Quarter ranges and classifies them into Q1-Q2-Q3-Q4 (as in the example above), and each Quarter has its own specific function, and can be used in this way:
If Q1 does an expansion it is likely that Q2 will do a consolidation, Q3 will do a Manipulation and Q4 will do a reversal returning to Q1
-If we are Bullish we buy under Open Session
-If we are Bearish we buy above open session
As in the example below:
If something is not clear, comment below and I will reply as soon as possible.
Immediate rebalanceGuided by the new ICT tutoring, I create this versatile Immediate Rebalance indicator
This indicator shows a different way on how to view the "Spikes or Shadows", based on the direction of the price this indicator divides the "Spike or Shadows" into levels 0.5 - 0.75 - 0.25 Fibonacci, giving the possibility to view the levels both in normal or in pre-Macro times
The user has the possibility to:
- Choose to have Spike levels shown in MultiTimeframe
- Choose to show Sike levels only Bullish or only Bearish
- Choose to show Sike levels only in pre-Macro/Macro times
- Choose to view the maximum amount of levels with Max Show
The indicator must be used as ICT shows in its concepts, the indicator takes into consideration the last 2 candles already closed so on the candle that is forming it is possible to expect reactions on the levels it marks, below is an example of how to use it in MultiTimeframe
Below I show an example on how to set the indicator to see Immediate Rebalance in Macro times
Below is an example of when not to take the indicator into consideration

Liquidity Sentiment Profile (Auto-Anchored) [LuxAlgo]
The Liquidity Sentiment Profile (Auto-Anchored) is an advanced charting tool that measures by combining PRICE and VOLUME data over specified anchored periods and highlights the distribution of the liquidity and the market sentiment at specific price levels. This version is a variation of the previously published Liquidity Sentiment Profile , wherewith this version allows users to select a variety of different anchoring periods, such as 'Auto', 'Fixed Range', 'Swing High', 'Swing Low', 'Session', 'Day', 'Week', 'Month', 'Quarter', and 'Year'
Liquidity refers to the availability of orders at specific price levels in the market, allowing transactions to occur smoothly.
🔶 USAGE
A Liquidity Sentiment Profile (Auto-Anchored) is a combination of liquidity and a sentiment profile, where the right side of the profile highlights the distribution of the traded activity at different price levels, and the left side of the profile highlights the market sentiment at those price levels
The liquidity profile is categorized by assigning different colors based on the significance of the traded activity of the specific price levels, allowing traders to reveal significant price levels, such as support and resistance levels, supply and demand zones, liquidity gaps, consolidation zones, etc
The Liquidity Sentiment Profiles aim to present Value Areas based on the significance of price levels, thus allowing users to identify value areas that can be formed more than once within the range of a single profile
Level of Significance Line - displays the changes in the price levels with the highest traded activity (developing POC)
Buyside & Sellside Liquidity Zones - displays Liquidity Levels, also known as Supply and Demand Zones
🔶 SETTINGS
The script takes into account user-defined parameters and plots the profiles, where detailed usage for each user-defined input parameter in indicator settings is provided with the related input's tooltip.
🔹 Liquidity Sentiment Profile
Anchor Period: The indicator resolution is set by the input of the Anchor Period.
Fixed Period: Applicable if the Anchor Period is set to 'Fixed Range' then the period of the profile is defined with this option
Swing Detection Length: Applicable if the Anchor Period is set to 'Swing High' or 'Swing Low' then the length required to detect the Swing Levels is defined with this option which is then used to determine the period of the profile
🔹 Liquidity Profile
Liquidity Profile: Toggles the visibility of the Liquidity Profiles
High Traded Nodes: Threshold and Color option for High Traded Nodes
Average Traded Nodes: Color option for Average Traded Nodes
Low Traded Nodes: Threshold and Color option for Low Traded Nodes
🔹 Sentiment Profile
Sentiment Profile: Toggles the visibility of the Sentiment Profiles
Bullish Nodes: Color option for Bullish Nodes
Bearish Nodes: Color option for Bearish Nodes
🔹 Buyside & Sellside Liquidity Zones
Buyside & Sellside Liquidity Zones: Toggles the visibility of the Liquidity Levels
Buyside Liquidity Nodes: Color option for Buyside Liquidity Nodes
Sellside Liquidity Nodes: Color option for Sellside Liquidity Nodes
🔹 Other Settings
Level of Significance: Toggles the visibility of the Level of Significance Line
Price Levels, Color: Toggles the visibility of the Profile Price Levels
Number of Rows: Specify how many rows each profile histogram will have. Caution, having it set to high values will quickly hit Pine Script™ drawing objects limit and fewer historical profiles will be displayed
Profile Width %: Alters the width of the rows in the histogram, relative to the profile length
Profile Range Background Fill: Toggles the visibility of the Profiles Range
🔶 RELATED SCRIPTS
Liquidity-Sentiment-Profile
Buyside-Sellside-Liquidity
ICT-Concepts

Liquidity Sentiment Profile [LuxAlgo]The Liquidity Sentiment Profile is an advanced charting tool that measures by combining PRICE and VOLUME data over specified anchored periods and highlights within a sequence of profiles the distribution of the liquidity and the market sentiment at specific price levels.
The Liquidity Sentiment Profile allows traders to reveal significant price levels, dominant market sentiment, support and resistance levels, supply and demand zones, liquidity availability levels, liquidity gaps, consolidation zones, and more based on price and volume data.
Liquidity refers to the availability of orders at specific price levels in the market, allowing transactions to occur smoothly.
🔶 USAGE
A Liquidity Sentiment Profile is a combination of a liquidity and a sentiment profile, where the right part of the profile displays the distribution of the traded activity at different price levels and the left part displays the market sentiment at those price levels.
The Liquidity Sentiment Profiles are visualized with different colors, where each color has a different meaning.
The Liquidity Sentiment Profiles aim to present Value Areas based on the significance of price levels, thus allowing users to identify value areas that can be formed more than once within the range of a single profile.
Level of Significance Line - displays the changes in the price levels with the highest traded activity (developing POC)
🔶 SETTINGS
The script takes into account user-defined parameters and plots the profiles, where detailed usage for each user-defined input parameter in indicator settings is provided with the related input's tooltip.
🔹 Liquidity Sentiment Profiles
Anchor Period: The indicator resolution is set by the input of the Anchor Period, the default option is AUTO.
🔹 Liquidity Profile Settings
Liquidity Profile: Toggles the visibility of the Liquidity Profiles
High Traded Nodes: Threshold and Color option for High Traded Nodes
Average Traded Nodes: Color option for Average Traded Nodes
Low Traded Nodes: Threshold and Color option for Low Traded Nodes
🔹 Sentiment Profile Settings
Sentiment Profile: Toggles the visibility of the Sentiment Profiles
Bullish Nodes: Color option for Bullish Nodes
Bearish Nodes: Color option for Bearish Nodes
🔹 Other Settings
Level of Significance: Toggles the visibility of the Level of Significance Line
Profile Price Levels: Toggles the visibility of the Profile Price Levels
Number of Rows: Specify how many rows each profile histogram will have. Caution, having it set to high values will quickly hit Pine Script™ drawing objects limit and fewer historical profiles will be displayed
Profile Width %: Alters the width of the rows in the histogram, relative to the profile length
Profile Range Background Fill: Toggles the visibility of the Profiles Range
🔶 LIMITATIONS
The amount of drawing objects that can be used is limited, as such using a high number of rows can display fewer historical profiles and occasionally incomplete profiles.
🔶 RELATED SCRIPTS
🔹 Buyside-Sellside-Liquidity
🔹 ICT-Concepts
🔹 Swing-Volume-Profiles

Market Structure CHoCH/BOS (Fractal) [LuxAlgo]The Market Structure CHoCH/BOS (Fractal) indicator is an experimental take on classical market structure, whereas fractal patterns are used for their construction instead of swing points.
Compared to utilizing swing points for highlighting market structure like our Smart Money Concepts indicator , fractal-based market structure can appear as more adaptive, however, it can also be more restrictive when it comes to returning swing points which can cause the indicator to miss reversals in some cases.
If enabled from within the settings, users can see support and resistance levels returned from the detected market structure with breakouts highlighted on the chart. Alongside this feature, an additional dashboard showing the structure to fractal structure percentage is also provided.
🔶 SETTINGS
Length: Length of the fractal patterns to detect.
🔹 Style
Bullish Structures: Show bullish structures.
Bearish Structures: Show bullish structures.
Support: Show support levels.
Resistance: Show resistance levels.
🔹 Dashboard
Show Dashboard: Show structure to fractal percentage dashboard on the chart.
Location: Location of the dashboard on the chart.
Size: Dashboard size.
🔶 USAGE
Market structure is commonly used to determine trend direction by using price positions relative to prior swing points. Using fractal patterns to determine market structure can allow users to obtain shorter, more frequent structure labels.
Market structure is commonly classified as follows:
Change of Character (CHoCH), also referred to as Market Structure Shift (MSS)
Break of Structure (BOS), also referred to as Market Structure Break (MSB)
Change of Characters indicate a shift in the market trend, confirming trend reversals. Break of Structures on the other hand occur once a trend is already determined, confirming new higher highs/lower lows.
Using higher length values allow users to detect longer-term fractals, thus highlighting longer-term market structures. The image above detects fractal patterns made of 7 candles, even if the increment is only of 2 bars this significantly reduces the amount of detected market structure labels.
The result obtained by utilizing fractals and higher settings can be a more dynamic view of market structure, however, as seen in the image above this can introduce very significant delay compared to utilizing pure swing points.
🔹 Support/Resistance
The indicator also returns support/resistance levels constructed from the market structure, these levels are obtained similarly to order blocks, finding the minimum on the interval of a bullish market structure and the maximum of a bearish market structure.
Price reaching a support/resistance level can be expected to bounce from it. Once a level is broken, the support/resistance level will no longer extend, and a circle will be displayed highlighting the break.
While utilizing this script for fractal-based market structure, these levels can be useful to ensure all swing points are still considered by the user with the possibility of the indicator missing reversals due to its calculation not being based on swing points themselves.
🔹 Dashboard
The dashboard reports the structure to fractal percentage, that is the amount of bullish/bearish market structures relative to the total amount of detected bullish/bearish fractal patterns.
This allows us to see how often a detected fractal pattern is used to display a market structure.
🔶 DETAILS
🔹 Fractals
In the context of technical analysis, Fractals refer to specific patterns that exhibit self-similarity at different scales or timeframes.
The most commonly known fractal pattern consists of a consecutive sequence of candles (more commonly 5), with the central candle being the lowest (in case of a bullish fractal) or highest (in case of a bearish fractal).
A bullish fractal has candles on the right side of the central candle with increasing lows, while candles on the left side have decreasing lows.
A bearish fractal has candles on the right side of the central candle with decreasing highs, while candles on the left side have increasing highs.
🔶 RELATED SCRIPTS
🔹 Smart Money Concepts
🔹 Market Structure Trailing Stop
🔹 ICT Concepts

30MIN CYCLE█ HOW DOES IT WORK?
The known 90 min cycle is used as one killzone. But actually all 18 min are relevant to search for a trade. All 18 min when a new box starts only then is the placement of an order valid. If the entry candle isn't in a box then it will probably fail. The boxes should only be used in the M1 or M5 timeframe. The best hitrate is in the M1 timeframe. Included are the last 48 "Mini-Killzones" für intraday trading and backtesting. These "Mini-Killzones" can be used with the "Liquidity Inducement Strategy".
█ WHAT MAKES IT UNIQUE?
This is the first indicator on tradingview that shows all mini-killzones for trading and backtesting a whole tradingday. The well-known killzones of ICT are from 08:00-11:00 and 14:00 - 17:00 (UTC+1) but with this indicator there is finally a refinement of the ICT Smart Money Concept killzones.
█ HOW TO USE IT?
For a proper use of this indicator we suggest to know already at least SMC or better Liquidity Indcuement Trading. This indicator is a further confluence before placing an order. After you made your setup you will have these mini-killzones as a confluence. We don't suggest to open a trade only according to this indicator.
█ ADDITIONAL INFO
This indicator is free to use for all tradingview users.
█ DISCLAIMER
This is not financial advice.

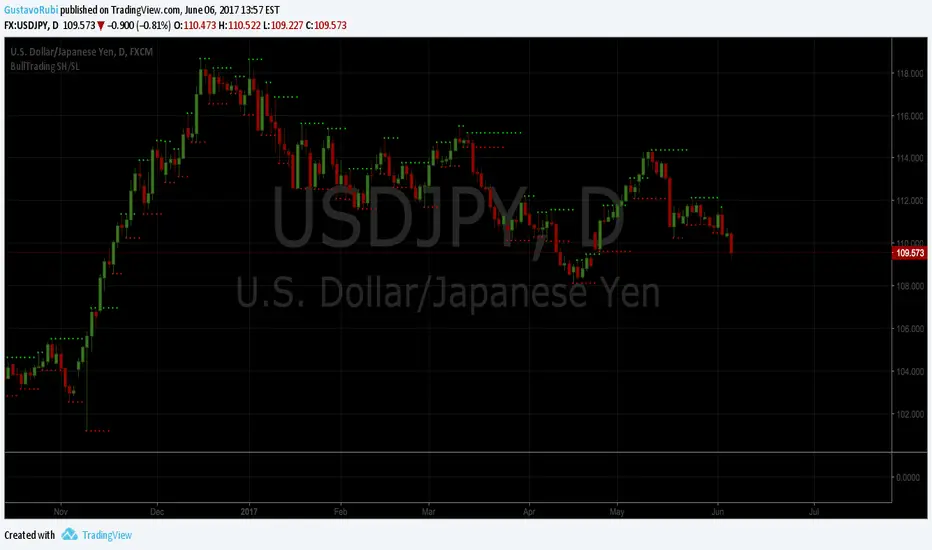
BullTrading SwingHigh/SwingLowTraders, good afternoon... are you in a mood for an excellent Institutional Trading Course?
Best of all for FREE!! (please use this valuable information with respect, there are people selling the information contained in this course as their own).
This guy has more than 20 years of trading experience under his belt. This information is a real gem for any trader, no matter the timeframe you trade. This script is a tribute for ICT production and shows the swing highs and swing lows used on institutional trading (Use it in D and 4H timeframes resolution for analysis in order to apply manual trading in lower timeframes).
Here is the link to the ICT Sniper Institutional Trading Course. Enjoy www.dropbox.com
Custom Dividers [louis]Custom Dividers is a streamlined utility designed for Multi-Timeframe Analysis (MTF). It allows you to visualize higher timeframe structures directly on lower timeframe charts by drawing infinite vertical lines at the open of new periods.
Unlike standard grid lines and other divider indicators, this has custom inputs, giving you complete control over non-standard timeframes (e.g., 90-minute cycles, 6-hour blocks, or 2-day periods).
🔑 Key Features
- 4 Independent Timeframe Slots: Configure up to four different vertical dividers simultaneously.
- Custom Minute Inputs (TF 1 & TF 2): Instead of restricting you to a dropdown, the first two slots allow you to input any integer for minutes.
Example: Set 90 for 90-minute cycle dividers.
Example: Set 360 for 6-hour dividers.
- Standard Timeframe Selectors (TF 3 & TF 4): Traditional dropdowns for standard periods like Daily (D), Weekly (W), or Monthly (M).
- Visual Customization:
Lines: Uses line.new() drawing logic to ensure dividers stretch infinitely from top to bottom, regardless of price scale.
Styles: Select from Solid, Dashed, or Dotted directly in the inputs.
Width & Color: Fully customizable to blend into your chart theme.
⚙️ How to Configure
Go to the Settings (Inputs Tab):
TF 1 & TF 2: Enter the specific number of minutes (e.g., 60 = 1 Hour, 240 = 4 Hours). Toggle the checkbox to Show/Hide.
TF 3 & TF 4: Select the timeframe period from the dropdown. Toggle the checkbox to Show/Hide.
Style: Choose your line style, color, and width.
Note: Since this indicator uses geometric drawings (line.new) to achieve full-height vertical lines, all visual settings (Color, Width, Style) are located in the Inputs Tab, not the Style tab.

Reversal Detection System v3.3═══════════════════════════════════════════════════
REVERSAL DETECTION SYSTEM v3.3
Professional Multi-Feature Market Structure Analysis
═══════════════════════════════════════════════════
Born from 40+ years of trading experience across commodities, stocks, and futures markets. After founding multiple successful companies including Anchor Financial and U.S. Investors Group, I shifted focus entirely to trading, spending 12 years specializing in micro futures scalping (MNQ, MES, MYM, MGC, MCL). This system represents 20+ years of indicator development on ThinkScript, now converted to TradingView to help the trading community.
DEVELOPER: NPR21 - Retired sales executive, professional day trader, second-degree black belt in Tae Kwon Do (discipline shapes trading mindset). Converting my personal ThinkScript library to TradingView to share proven tools with the community.
═══════════════════════════════════════════════════
CORE FEATURES
═══════════════════════════════════════════════════
✓ REVERSAL DETECTION - Adaptive ATR-based with 5 sensitivity presets (Very High to Very Low) plus custom mode. Non-repainting confirmed signals with optional preview.
✓ SMART MONEY CONCEPTS - BOS (Break of Structure) continuation signals and CHoCH (Change of Character) reversal warnings. Fractal-based institutional footprint tracking.
✓ PREMIUM/DISCOUNT ZONES - Three-zone price structure (Premium/Equilibrium/Discount) with volume-based strength analysis. Shows actual buy/sell pressure from last 20 bars with Strong/Weak High/Low labels.
✓ ORDER BLOCKS - Volumetric split visualization showing buy/sell pressure ratios. Automatic mitigation detection with breaker zones (flipped polarity). Shows institutional entry zones.
✓ FAIR VALUE GAPS (FVG) - Three-candle gap detection with 50% Consequent Encroachment lines. Dynamic fill percentage tracking with auto-cleanup when filled.
✓ MOBIUS TREND PIVOTS - Institutional-grade pivot system with True Range-based target zones. Dynamic cloud visualization with real-time long/short entry signals and risk offset lines.
✓ STRONG/WEAK HIGHER HIGHS & LOWER LOWS - Market structure shift detection with strength percentages showing momentum conviction.
✓ SUPPLY/DEMAND ZONES - Rectangular zones at confirmed reversal pivots with adjustable display limits.
═══════════════════════════════════════════════════
WHY THIS WORKS
═══════════════════════════════════════════════════
Each feature captures different institutional behavior:
- Premium/Discount = Where smart money accumulates vs distributes
- Order Blocks = Exact zones where institutions placed large orders
- BOS/CHoCH = Trend structure confirmation and reversal warnings
- FVG = Inefficient price discovery that gets filled
- Mobius = Pivot-based target zones with high hit rates
- Volume Strength = Actual order flow conviction (not price-based guesses)
═══════════════════════════════════════════════════
QUICK START
═══════════════════════════════════════════════════
1. Choose sensitivity: High (1-5m), Medium (15m-1H), Low (4H-Daily)
2. Enable features you want (all ON by default)
3. Set ONE alert: "STRONG Bullish/Bearish Signal" for best setups
4. Paper trade 1-2 months before going live
SCALPERS (1-5m): Use Very High sensitivity, focus on Order Blocks + Mobius signals
DAY TRADERS (15m-1H): Use Medium sensitivity, focus on BOS/CHoCH + Premium/Discount
SWING TRADERS (4H-Daily): Use Low sensitivity, focus on major structure + Strong/Weak HL
═══════════════════════════════════════════════════
CUSTOMIZATION
═══════════════════════════════════════════════════
- Independent text size controls for ALL label types (Tiny/Small/Normal/Large)
- Adjustable swing high/low line width (1-5)
- Customizable zone extensions and lookback periods
- Color customization for all components
- Toggle each feature independently
- Real-time info dashboard showing active features
═══════════════════════════════════════════════════
ALERT SYSTEM
═══════════════════════════════════════════════════
Available alerts:
- Bullish/Bearish Reversals
- BOS and CHoCH (structure breaks)
- Fair Value Gaps
- Mobius pivot crossovers
- Strong confluence signals (reversal + trend aligned)
Recommended: Start with "STRONG Bullish/Bearish Signal" - these require multiple confirmations and have highest win rates.
═══════════════════════════════════════════════════
WORKS ON
═══════════════════════════════════════════════════
✓ All timeframes (1m to Monthly)
✓ All instruments (Stocks, Forex, Futures, Crypto, Indices)
✓ Tested extensively on micro futures (MNQ, MES, MYM, MGC, MCL)
═══════════════════════════════════════════════════
IMPORTANT NOTES
═══════════════════════════════════════════════════
- This indicator provides technical analysis signals - NOT financial advice
- Always use proper risk management (1-2% risk per trade maximum)
- Past performance does not guarantee future results
- Combine with price action and fundamental analysis
- Test thoroughly on paper/demo before live trading
- Best results come from understanding WHY features work, not blindly following signals
═══════════════════════════════════════════════════
COMPREHENSIVE GUIDE
═══════════════════════════════════════════════════
For detailed usage instructions including:
- Step-by-step trade examples for Forex, Futures Scalpers, and Swing Traders
- Multi-timeframe confirmation strategies
- Alert configuration guide
- Troubleshooting and optimization
- Performance tracking methods
Visit: docs.google.com
═══════════════════════════════════════════════════
CREDITS
═══════════════════════════════════════════════════
Inspiration from Michael J. Huddleston & ICT (Inner Circle Trader) for Smart Money Concepts framework. Mobius for trend pivot methodology. The trading community for decades of shared knowledge.
═══════════════════════════════════════════════════
VERSION HISTORY
═══════════════════════════════════════════════════
v3.3 (January 27, 2026) - Added Premium/Discount zones with volume strength, Mobius pivots, Strong/Weak HL detection, enhanced customization
v3.2 (January 2026) - Enhanced order blocks, FVG tracking, info table
v3.1 (January 2026) - Initial TradingView release

Multi-Timeframe Order BlocksDesigned to identify and visualize key supply and demand zones based on order block theory across multiple timeframes. The indicator detects order blocks by analyzing sequential candle patterns and price movement thresholds to highlight potential reversal or continuation zones where institutional buying or selling activity may have occurred.
The indicator works by scanning for clusters of consecutive bullish or bearish candles followed by a significant price move, which signals the formation of an order block. It then plots these zones as colored boxes on the chart—green for demand (bullish order blocks) and red for supply (bearish order blocks). The zones can be based on candle bodies or wicks, depending on user preference, and the indicator supports multi-timeframe analysis by allowing optional higher timeframe inputs.
How It Works:
Sequential Candle Detection: The indicator looks for a specified number of consecutive bullish or bearish candles (configurable by the user) to identify potential order blocks.
Price Movement Threshold: It checks if the price movement after the order block formation exceeds a user-defined percentage threshold, ensuring only significant zones are marked.
Zone Plotting: Once an order block is confirmed, the indicator draws a supply or demand zone as a box on the chart, using either candle bodies or wicks for zone boundaries.
Multi-Timeframe Support: Users can optionally specify higher timeframes to incorporate broader market context, enhancing the reliability of the zones.
Zone Management: The indicator limits the number of zones displayed to avoid clutter, automatically removing the oldest zones when the maximum count is exceeded.
How to Interpret:
Demand Zones (Green Boxes): These represent areas where buying pressure was strong enough to create a bullish order block. Price often finds support here, making these zones potential entry points for long trades or areas to watch for price bounces.
Supply Zones (Red Boxes): These indicate areas of strong selling pressure forming bearish order blocks. Price may face resistance in these zones, which can be used as potential exit points for longs or entry points for shorts.
Multi-Timeframe Confirmation: Zones identified on higher timeframes tend to be stronger and more reliable. Use the optional higher timeframe inputs to align your trades with broader market trends.
Use with Other Indicators: Combine order block zones with volume, momentum, or trend indicators to improve trade confirmation and risk management.
Zone Breaks: A decisive break and close beyond a supply or demand zone may signal a shift in market sentiment and potential trend continuation or reversal.
Disclaimer
This indicator is provided for educational and informational purposes only and does not constitute financial advice. Trading involves significant risk, and it is possible to lose more than your initial investment. Users should conduct their own research and consider their financial situation carefully before making any trading decisions. The developer and publisher of this indicator are not responsible for any trading losses or damages incurred. Always use proper risk management and consult with a licensed financial advisor if needed.

15 Zaman Kutusu ve 10 Zaman Acilisi15 Range Boxes & 10 Open Lines
This indicator is a comprehensive technical analysis tool designed to track specific time intervals (Sessions, Killzones) and critical opening prices on your chart.
Key Features:
15 Custom Range Boxes: Individual settings for color, time, and labels.
10 Open Price Lines: Track daily, weekly, or session opens.
Smart History Limit: "Son X Kutuyu Goster" feature preventing lag and flickering.
Pips Display: Automatically calculates and displays the range width in pips.
Minimalist Mode: Hides details when "Cok Kucuk" label size is selected.
Language: Fully Turkish menu settings.
Note: Inspired by Nephew Sam's concept, coded from scratch with performance optimizations and additional features.
DISCLAIMER This indicator is for educational purposes only. It does not constitute financial advice or trading signals. Use at your own risk.

FxNeel Session (Lite)Here is light version. You can all types of ICT session like Asia, london, new york, Aisa kill zone, CBDR .
Happy trading. Please drop your feedback.

NY Open 60-Min VarBox + Pure ICT FVG V8This is little indicator that shows the NY-Stock Exc. opening candles with a vertical line and a label. It works for different time scales. It also finds the bullish FVGs. It is a good tool for those who follow the opening of the exchange.

_mr_beach Liquidity Sweep + VWAP V2 Trend Filter, Presets_mr_beach Liquidity Sweep + VWAP Reversal V2 (Trend Filter, Presets)
Overview
This strategy models a common institutional market behavior:
Liquidity is taken above the previous day’s high or below the previous day’s low, followed by a return toward fair value (VWAP) and a reversal in the direction of the dominant trend.
The script is designed as a TradingView Strategy for systematic backtesting and optimization.
________________________________________
Core Logic
• Liquidity Levels
o Previous Day High
o Previous Day Low
Used as typical stop-liquidity zones.
• Fair Value
o VWAP is used as confirmation that price has returned to a fair value area.
• Trend Filter
o EMA-based trend direction filter to avoid counter-trend trades.
________________________________________
Trading Rules
Trend Filter
• Long trades only when price closes above EMA.
• Short trades only when price closes below EMA.
Liquidity Sweep
• Bullish sweep: Price trades below Previous Day Low.
• Bearish sweep: Price trades above Previous Day High.
Entry Confirmation
• Long
o Sweep below Previous Day Low
o Close back above Previous Day Low
o Close above VWAP
• Short
o Sweep above Previous Day High
o Close back below Previous Day High
o Close below VWAP
________________________________________
Risk Management
• Stop Loss: ATR-based
• Take Profit: ATR-based
• Risk automatically adapts to market volatility.
• All multipliers are user-adjustable.
________________________________________
Preset Profiles
The script includes ready-to-use preset profiles:
• Index – conservative, session-based, one trade per day
• Forex – session-filtered, moderate volatility settings
• Crypto – higher volatility parameters, no session filter
• Custom – fully manual configuration
Presets control EMA length, ATR settings, SL/TP multipliers, session usage, and trade frequency.
________________________________________
Session & Trade Control
• Optional session filter (default: US regular session)
• Optional one trade per day limit to reduce overtrading and noise
________________________________________
Chart Elements
• EMA (trend direction)
• VWAP (fair value)
• Previous Day High / Low (liquidity zones)
________________________________________
Alerts
• Long setup: Liquidity sweep + VWAP reversal
• Short setup: Liquidity sweep + VWAP reversal
________________________________________
Recommended Usage
• Markets: Indices, liquid stocks, Forex majors, crypto
• Timeframes: 5m and 15m
• Parameters should be optimized per market and timeframe.
________________________________________
Disclaimer
This script is for educational and backtesting purposes only.
It does not constitute financial advice.
Performance depends on market conditions, timeframe, fees, and execution.
Tags: Liquidity, VWAP, EMA, Reversal, Sweep, Smart Money, ICT, ATR, Strategy

_mr_beach Liquidity Sweep + VWAP ReversalLiquidity Sweep + VWAP Reversal (Trend Filter, Session, 1 Trade per Day)
Overview
This strategy models a common institutional market behavior: liquidity is taken above the previous day’s high or below the previous day’s low, followed by a return toward fair value (VWAP) and a reversal in the direction of the prevailing trend.
Designed as a TradingView strategy for structured backtesting in the Strategy Tester.
Core Components
Liquidity Levels: Previous Day High / Previous Day Low
Fair Value Reference: VWAP
Trend Filter: EMA (default: 200)
Volatility-Based Risk: ATR
Trading Rules
Trend Filter
Long only when price closes above EMA
Short only when price closes below EMA
Liquidity Sweep
Bullish sweep: Low < Previous Day Low
Bearish sweep: High > Previous Day High
Entry Confirmation
Long: After a sweep below the Previous Day Low, price closes back above the level and above VWAP
Short: After a sweep above the Previous Day High, price closes back below the level and below VWAP
Risk Management
Stop Loss: ATR-based (slATR)
Take Profit: ATR-based (tpATR)
Automatically adapts to changing market volatility
Session & Trade Frequency
Optional session filter (default: 09:30–16:00 exchange time)
Optional one trade per day limit to reduce overtrading
Chart Elements
EMA (trend direction)
VWAP (fair value)
Previous Day High / Low (liquidity zones)
Alerts
Long setup: Liquidity sweep + VWAP reversal
Short setup: Liquidity sweep + VWAP reversal
Recommended Usage
Markets: Indices, liquid stocks, Forex majors, crypto
Timeframes: 5m, 15m
Note: Parameters such as ATR multipliers and session settings should be optimized per market
Disclaimer
This is a backtesting strategy, not financial advice.
Results depend on market conditions, timeframe, fees, and slippage.
Tags: Liquidity, VWAP, EMA, Reversal, Sweep, Smart Money, ICT, ATR, Strategy

cephxs / New X Opening Gaps [Pro +]NWOG & NDOG - OPENING GAPS
Smart Gap Detection with Intelligent Filtering
Visualizes New Week Opening Gaps (NWOGs) and New Day Opening Gaps (NDOGs) with built-in intelligence to show you only what matters. No more cluttered charts with gaps from 3 months ago that price will never revisit.
THE PROBLEM WITH GAP INDICATORS
Most gap indicators dump every single gap on your chart and call it a day. You end up with 50 boxes cluttering your screen, half of which are miles away from current price and the other half are so tiny they're basically noise.
This one's different and I explain why below.
SMART FILTERING (THE GOOD STUFF)
Two filters work together to keep your chart clean:
Size Filter: Uses ATR-based detection to filter out insignificant gaps, dynamic with less volatile time periods
- Filter None: Show everything (if you really want chaos)
- Filter Insignificant: Hide the micro-gaps that don't matter
- Juicy Gaps Only: Only show gaps worth paying attention to
Distance Filter: Only displays gaps within range of current price
- Really Close: 0.5 ATR - tight focus on immediate levels
- Balanced: 1 ATR - sweet spot for most traders
- Slightly Far: 3 ATR - wider view for swing traders
Cleanup Interval: Controls how quickly out-of-range gaps disappear
- Immediately: Gaps hide/show every bar as price moves
- 5 / 15 / 30 Minutes: Gaps only update visibility at interval boundaries - reduces visual noise during choppy price action
The magic: gaps appear and disappear as price moves toward or away from them. Old gaps that price has left behind fade out, and gaps that become relevant fade back in. Use delayed cleanup intervals if you want gaps to "stick around" a bit longer before disappearing.
GAP TYPES EXPLAINED
New Week Opening Gaps (NWOGs):
The gap between Friday's close and Monday's open. These form over the weekend when markets are closed and often act as significant support/resistance.
Two classifications:
Void Gaps: Gap direction aligns with Friday's candle direction (continuation)
Overlap Gaps: Gap direction conflicts with Friday's candle (potential reversal)
New Day Opening Gaps (NDOGs):
The gap between one day's close and the next day's open. Smaller but frequent - useful for intraday traders looking for fill targets.
FEATURES
Automatic Week/Day Detection: Handles forex (17:00 ET open) and futures (18:00 ET open) correctly
DST-Aware: Uses New York timezone with automatic daylight saving adjustments
50% Equilibrium Line: Marks the midpoint of each gap - key level for entries
Days Ago Labels: Shows how old each gap is at a glance
Extension Modes: Choose between live-extending boxes or fixed-width boxes
Separate Color Schemes: Different colors for void vs overlap NWOGs, bullish vs bearish NDOGs
INPUTS
NWOG Display
Show NWOGs: Master toggle
Extension Mode: "Extend Live" or "Extend to Week Close"
Maximum NWOGs: Limit displayed gaps (1-50)
Show Void/Overlap Gaps: Toggle each type independently
Show NWOG Labels: Toggle gap labels
NDOG Display
Show NDOGs: Master toggle
Extension Mode: "Extend Live" or "Extend to Day Close"
Maximum NDOGs: Limit displayed gaps (1-50)
Show NDOG Labels: Toggle gap labels
Filter Settings
Size Filter: Filter None / Filter Insignificant / Juicy Gaps Only
Only Show Near Price: Enable/disable distance filtering
Distance Filter: Really Close / Balanced / Slightly Far
Cleanup Interval: Immediately / 5 Minutes / 15 Minutes / 30 Minutes - controls how often gaps update visibility
ATR Period: Period for ATR calculation (default: 14)
Right Edge Offset: How many bars ahead boxes extend
Styling
Box Transparency: Fill and border opacity
Midline Style: Solid / Dotted / Dashed
Label Style: Simple ("NWOG, 5d ago") or Descriptive ("NWOG (Void Bull), 5d ago")
Label Size: Tiny / Small / Normal / Large
RECOMMENDED SETTINGS
For intraday (1m-15m):
Size Filter: Filter Insignificant
Distance Filter: Really Close or Balanced
Show NDOGs: On
Maximum NDOGs: 5-10
For swing trading (1H-4H):
Size Filter: Juicy Gaps Only
Distance Filter: Balanced or Slightly Far
Show NWOGs: On
Maximum NWOGs: 10-20
TIMEFRAME NOTES
Works on daily timeframe and below. Above daily, the indicator disables itself since NWOG/NDOG gap detection requires daily open/close data.
ASSET SUPPORT
Automatically handles different market open times:
Forex: Week opens Sunday 17:00 ET, closes Friday 17:00 ET
Futures: Week opens Sunday 18:00 ET, closes Friday 16:15 ET
Stocks/Other: Uses session-based detection
FAQ
Why do gaps appear and disappear?
That's the distance filter working. As price moves, gaps that were far away become relevant and appear. Gaps that price leaves behind disappear. This keeps your chart focused on actionable levels.
What's the difference between void and overlap gaps?
Void gaps continue Friday's direction (trend continuation). Overlap gaps conflict with Friday's direction (potential reversal setup). Different traders prefer different types.
Why can't I see any gaps?
Check your filter settings. "Juicy Gaps Only" with "Really Close" distance filter is very selective. Try "Filter Insignificant" with "Balanced" for more gaps.
DISCLAIMER
This indicator is for educational purposes only. Opening gaps are one tool among many - they don't guarantee fills or reversals. Always use proper risk management and never trade based on a single indicator. Past gap fills don't guarantee future performance. Do your own analysis.
CHANGELOG
Pro +: Added smart size/distance filtering, void/overlap classification, NDOG support, DST-aware timezone handling
Base: Initial NWOG visualization
Made with ❤️ by fstarlabs

Key levels by Chav3zNY-Time Anchored Sessions
Visualizes the Asia, London, and New York sessions using customizable boxes or high/low lines. Unlike standard session indicators, this tool uses the America/New York time zone to ensure your session start and end times remain accurate throughout Daylight Savings changes.
2. Dynamic HTF Key Levels (PDH/PDL, PWH/PWL, PMH/PML)
Automatically plots the Previous Daily, Weekly, and Monthly Highs and Lows.
Clean Intraday Origin: To prevent "chart clutter," these lines do not drag across the entire historical data. They originate at the start of the current day (NY Midnight), providing a clean horizontal reference for the current trading session.
Lookback Control: Choose how many days of historical key levels you want to remain visible on your chart.
3. Custom Time-Anchored Levels
Includes two fully customizable "Price Anchors" (e.g., Midnight Open, 09:30 AM NY Open).
Origin Point Precision: Lines start exactly at the candle of the specified time (e.g., 09:30) and extend forward, rather than drawing through the pre-market.
Price Capture: Choose to anchor to the Open, High, or Low of that specific timestamp.
4. Full Aesthetic Customization
Every level (Daily, Weekly, Monthly, and Custom) can be individually styled:
Color & Visibility: Set each level to your preferred color (Defaulted to Black for a clean look).
Line Style: Toggle between Solid, Dashed, or Dotted lines.
Thickness: Adjust the line width (1px, 2px, etc.) for better visibility on high-resolution screens.
How to Use
Midnight Open: Set Level 1 to 0000 to track the Daily Open, a crucial level for determining daily bias.
NY Open: Set Level 2 to 0930 to mark the "Opening Range" anchor for the New York session.
Liquidity Targets: Use the PDH/PDL and PWH/PWL levels to identify draw-on-liquidity areas for intraday scalp or swing setups.

AssetCorrelationUtils
- Open source Library Used for Indicators that utilize correlation between assets for divergence calculations. It has no drawing elements.
ASSET CORRELATION UTILS
PineScript library for automatic detection of correlated asset pairs and triads for multi-asset analysis.
WHAT IT DOES
This library automatically identifies correlated assets based on the current chart symbol. It returns properly configured asset pairings for use in SMT divergence detection, inter-market analysis, and multi-asset comparison tools.
HOW IT WORKS
The library matches your chart symbol against known correlation groups:
Index Futures: NQ/ES/YM/RTY triads (including micros)
Metals: Gold/Silver/Copper triads (futures and CFD)
Forex: EUR/GBP/DXY and USD/JPY/CHF triads
Energy: Crude/Gasoline/Heating Oil triads
Treasury: ZB/ZF/ZN bond triads
Crypto: BTC/ETH/TOTAL3 and major altcoin pairings
Inversion flags are automatically computed for assets that move inversely (e.g., DXY vs EUR pairs).
HOW TO USE
import fstarcapital/AssetCorrelationUtils/1 as acu
// Simple: auto-detect from current chart
config = acu.resolveCurrentChart()
// Access resolved assets
primary = config.primary
secondary = config.secondary
tertiary = config.tertiary
EXPORTED FUNCTIONS
resolveCurrentChart(): One-call auto-detection using chart syminfo
resolveAssets(): Full detection with custom parameters
resolveTriad() / resolveDyad(): Manual resolution with inversion logic
detect*() functions: Category-specific detectors for custom workflows
TYPES
AssetPairing: Core structure for primary/secondary/tertiary tickers with inversion flags
AssetConfig: Full resolution result with detection status and asset category
DISCLAIMER
This library is a utility for building multi-asset indicators. Asset correlations are not guaranteed and may change over time. Always validate pairings for your specific trading context.
Full Default Function @type and @field descriptions below.
Library "AssetCorrelationUtils"
detectIndicesFutures(ticker)
Detects Index Futures (NQ/ES/YM/RTY + micro variants)
Parameters:
ticker (string) : The ticker string to check (typically syminfo.ticker)
Returns: AssetPairing with secondary and tertiary assets configured
detectMetalsFutures(ticker)
Detects Metal Futures (GC/SI/HG + micro variants)
Parameters:
ticker (string) : The ticker string to check
Returns: AssetPairing with secondary and tertiary assets configured
detectForexFutures(ticker)
Detects Forex Futures (6E/6B + micro variants)
Parameters:
ticker (string) : The ticker string to check
Returns: AssetPairing with secondary and tertiary assets configured
detectEnergyFutures(ticker)
Detects Energy Futures (CL/RB/HO + micro variants)
Parameters:
ticker (string) : The ticker string to check
Returns: AssetPairing with secondary and tertiary assets configured
detectTreasuryFutures(ticker)
Detects Treasury Futures (ZB/ZF/ZN)
Parameters:
ticker (string) : The ticker string to check
Returns: AssetPairing with secondary and tertiary assets configured
detectCryptoFutures(ticker)
Detects CME Crypto Futures (BTC/ETH + micro variants)
Parameters:
ticker (string) : The ticker string to check
Returns: AssetPairing with secondary and tertiary assets configured
detectCADFutures(ticker)
Detects CAD Forex Futures (6C + micro variants)
Parameters:
ticker (string) : The ticker string to check
Returns: AssetPairing with secondary and tertiary assets configured
detectForexCFD(ticker, tickerId)
Detects Forex CFD pairs (EUR/GBP/DXY, USD/JPY/CHF triads)
Parameters:
ticker (string) : The ticker string to check
tickerId (string) : The full ticker ID (syminfo.tickerid) for primary asset
Returns: AssetPairing with secondary and tertiary assets configured
detectCrypto(ticker, tickerId)
Detects major Crypto assets (BTC, ETH, SOL, XRP, alts)
Parameters:
ticker (string) : The ticker string to check
tickerId (string) : The full ticker ID for primary asset
Returns: AssetPairing with secondary and tertiary assets configured
detectMetalsCFD(ticker, tickerId)
Detects Metals CFD (XAU/XAG/Copper)
Parameters:
ticker (string) : The ticker string to check
tickerId (string) : The full ticker ID for primary asset
Returns: AssetPairing with secondary and tertiary assets configured
detectIndicesCFD(ticker, tickerId)
Detects Indices CFD (NAS100/SP500/DJ30)
Parameters:
ticker (string) : The ticker string to check
tickerId (string) : The full ticker ID for primary asset
Returns: AssetPairing with secondary and tertiary assets configured
detectEUStocks(ticker, tickerId)
Detects EU Stock Indices (GER40/EU50) - Dyad only
Parameters:
ticker (string) : The ticker string to check
tickerId (string) : The full ticker ID for primary asset
Returns: AssetPairing with secondary asset configured (tertiary empty for dyad)
getDefaultFallback(tickerId)
Returns default fallback assets (chart ticker only, no correlation)
Parameters:
tickerId (string) : The full ticker ID for primary asset
Returns: AssetPairing with chart ticker as primary, empty secondary/tertiary (no correlation)
applySessionModifierWithBackadjust(tickerStr, sessionType)
Applies futures session modifier to ticker WITH back adjustment
Parameters:
tickerStr (string) : The ticker to modify
sessionType (string) : The session type (syminfo.session)
Returns: Modified ticker string with session and backadjustment.on applied
applySessionModifierNoBackadjust(tickerStr, sessionType)
Applies futures session modifier to ticker WITHOUT back adjustment
Parameters:
tickerStr (string) : The ticker to modify
sessionType (string) : The session type (syminfo.session)
Returns: Modified ticker string with session and backadjustment.off applied
isTriadMode(pairing)
Checks if a pairing represents a valid triad (3 assets)
Parameters:
pairing (AssetPairing) : The AssetPairing to check
Returns: True if tertiary is non-empty (triad mode), false for dyad
getAssetTicker(tickerId)
Extracts clean ticker string from full ticker ID
Parameters:
tickerId (string) : The full ticker ID (e.g., "BITGET:BTCUSDT.P")
Returns: Clean ticker string (e.g., "BTCUSDT.P")
resolveTriad(chartTickerId, pairing)
Resolves triad asset assignments with proper inversion flags
Parameters:
chartTickerId (string) : The current chart's ticker ID (syminfo.tickerid)
pairing (AssetPairing) : The detected AssetPairing
Returns: Tuple
resolveDyad(chartTickerId, pairing)
Resolves dyad asset assignment with proper inversion flag
Parameters:
chartTickerId (string) : The current chart's ticker ID
pairing (AssetPairing) : The detected AssetPairing (dyad: tertiary is empty)
Returns: Tuple
resolveAssets(ticker, tickerId, assetType, sessionType, useBackadjust)
Main auto-detection entry point. Detects asset category and returns fully resolved config.
Parameters:
ticker (string) : The ticker string to check (typically syminfo.ticker)
tickerId (string) : The full ticker ID (typically syminfo.tickerid)
assetType (string) : The asset type (typically syminfo.type)
sessionType (string) : The session type for futures (typically syminfo.session)
useBackadjust (bool) : Whether to apply back adjustment for futures session alignment
Returns: AssetConfig with fully resolved assets, inversion flags, and detection status
resolveCurrentChart()
Simplified auto-detection using current chart's syminfo values
Returns: AssetConfig with fully resolved assets, inversion flags, and detection status
AssetPairing
Core asset pairing structure for triad/dyad configurations
Fields:
primary (series string) : The primary (chart) asset ticker ID
secondary (series string) : The secondary correlated asset ticker ID
tertiary (series string) : The tertiary correlated asset ticker ID (empty for dyad)
invertSecondary (series bool) : Whether secondary asset should be inverted for divergence calc
invertTertiary (series bool) : Whether tertiary asset should be inverted for divergence calc
AssetConfig
Full asset resolution result with mode detection and computed values
Fields:
detected (series bool) : Whether auto-detection succeeded
isTriadMode (series bool) : True if triad (3 assets), false if dyad (2 assets)
primary (series string) : The resolved primary asset ticker ID
secondary (series string) : The resolved secondary asset ticker ID
tertiary (series string) : The resolved tertiary asset ticker ID (empty for dyad)
invertSecondary (series bool) : Computed inversion flag for secondary asset
invertTertiary (series bool) : Computed inversion flag for tertiary asset
assetCategory (series string) : String describing the detected asset category

Star SMC and Price action [ARule]This script is a Smart Money Concepts (SMC) + Price Action + VWAP + Swing Zones indicator.
It detects and draws:
✅ Fair Value Gaps (FVG)
✅ Imbalances (HTF FVG)
✅ BOS / CHoCH (Market Structure)
✅ Internal & Swing Structure
✅ Order Blocks (Internal + Swing)
✅ Equal High / Equal Low (EQH / EQL)
✅ Premium / Discount Zones
✅ Multi-Timeframe High & Low levels
✅ VWAP trend filter
✅ Swing High / Low zones with volume/count filter
✅ Alerts for all major SMC events
👉 Basically:
💎 “All-in-one institutional trading indicator”
✅ 1) HTF FVG / Imbalance System (First Part)
This part:
Uses multiple higher timeframes:
5m, 15m, 1H, 4H, 1D, 1W
Detects imbalance (FVG-like gaps)
Draws boxes on chart
Marks mitigated zones
Adds labels like: 5m, 15m, 1H etc.
Logic:
An imbalance forms when:
current high < previous low (gap down)
or
current low > previous high (gap up)
Then it draws a box 📦
✅ 2) Mitigation Logic (Very Important)
Your script checks when FVG is filled:
Options:
Wick filled
Body filled
Half filled
None
Example:
"Wick filled" => low <= imb.open
Meaning:
👉 Price touched the FVG → mark as mitigated.
✅ 3) Smart Money Concepts (SMC Core)
This huge section detects:
🔹 BOS (Break of Structure)
When price breaks previous swing high/low.
🔹 CHoCH (Change of Character)
Trend reversal signal.
Example:
Uptrend → break low → CHoCH bearish
Downtrend → break high → CHoCH bullish
✅ 4) Internal vs Swing Structure
Internal Structure:
Small moves (lower timeframe)
Fast signals ⚡
Swing Structure:
Major trend structure
Strong signals 💪
You can enable/disable both in settings.
✅ 5) Order Blocks (OB)
Detected when structure breaks.
Two types:
🟢 Bullish OB
🔴 Bearish OB
Logic:
Script finds last opposite candle before BOS/CHoCH.
Then draws OB box 📦
Also checks mitigation:
close > OB high → bearish OB broken
close < OB low → bullish OB broken
✅ 6) Equal High / Equal Low (Liquidity)
Detects liquidity zones:
EQH = Equal High
EQL = Equal Low
Logic:
If two highs/lows are close within ATR threshold.
Used for:
👉 Liquidity grab / stop hunt zones.
✅ 7) Fair Value Gaps (FVG) – Another System
This is separate from HTF imbalance.
Condition:
currentLow > high → bullish FVG
currentHigh < low → bearish FVG
Draws 2 boxes per FVG.
✅ 8) Premium / Discount Zones
Based on latest swing high & low:
Premium zone = top 50%
Discount zone = bottom 50%
Equilibrium = middle
Used in SMC for entries.
✅ 9) Multi-Timeframe High/Low Levels
Draws:
Previous Day High/Low
Previous Week High/Low
Previous Month High/Low
✅ 10) VWAP Filter (Your Added Block)
You added:
VWAP Line
vwapValue = ta.vwap(close)
Trend Filter
Bullish → price above VWAP
Bearish → price below VWAP
ATM / ITM / OTM logic
atm_condition = abs(close - vwap) <= 25
Meaning:
ATM = price near VWAP
ITM / OTM = based on VWAP direction
💡 This is NOT real option ATM — it's a conceptual filter.
✅ 11) Swing High / Low Zones (Last Part)
This part:
Detects swing highs & lows using pivot logic
Creates zones (boxes)
Counts touches or volume inside zone
Filters strong zones
Example:
More touches = stronger support/resistance
More volume = institutional interest
✅ What makes this script powerful 💎
It combines:
Concept Purpose
FVG / Imbalance Institutional gaps
BOS / CHoCH Trend change
Order Blocks Smart money zones
EQH/EQL Liquidity
Premium/Discount Entry zones
VWAP Trend filter
Swing Zones Support/Resistance
👉 This is almost like ICT + SMC + Volume + VWAP hybrid.
✅ If you want, I can help you:
I can:
✅ Simplify this script (remove heavy parts)
✅ Add NIFTY / BANKNIFTY option logic
✅ Add Buy/Sell signals
✅ Add scanner (BOS + VWAP + FVG)
✅ Add dashboard table
✅ Optimize performance (reduce lag)
✅ Convert VWAP → real ATM strike logic
✅ Explain any part line-by-line
