ICT Macro Tracker° (Open-Source) by PesSpecific time indicator for order effectiveness when US market opens
Cari dalam skrip untuk "ict"

ICT x Vihapa 4 in 1Indicator Description:
This indicator is designed to provide comprehensive market structure and session-based insights. It includes:
NWoG / NDoG Levels: Displays New Week Opening Gap (NWoG) and New Day Opening Gap (NDoG) for market context.
Key Opening Price Levels: Highlights significant time-based price levels, including 00:00, 08:30, 09:30, and 13:00.
Previous Key Levels: Marks critical historical levels such as the previous week's high and low, previous day’s high and low, and 4-hour highs and lows.
Trading Sessions: Clearly distinguishes major market sessions including the Asian, London, and New York sessions.
This indicator serves as a valuable tool for traders seeking to align their strategies with institutional price behavior and time-based market dynamics.

ICT SMT Divergence Lines - EnhancedThis indicator identifies and highlights Smart Money Technique (SMT) divergence between two user-selected symbols across any timeframe. It compares the last two completed candles of both symbols and marks potential SMT signals only when market context aligns with smart money principles.
⚡ Key Features
✅ SMT Bullish Signal
Symbol 1 forms a lower low compared to its prior candle.
Symbol 2 forms a higher low compared to its prior candle.
The previous candle on the chart was bearish (close < open).
✅ SMT Bearish Signal
Symbol 1 forms a higher high compared to its prior candle.
Symbol 2 forms a lower high compared to its prior candle.
The previous candle on the chart was bullish (close > open).
✅ Visual Representation
Draws a clean, subtle line between the two SMT candles — green for bullish SMT and red for bearish SMT — making divergence easy to spot.
Optional small triangle markers above or below the bar where SMT is detected.
Old lines are automatically removed to keep the chart uncluttered.
✅ Multi-timeframe compatible
Works on any chart timeframe.
Compares the last two completed candles in the current chart timeframe, or can be adapted for a fixed higher timeframe.

ICT Macro and Daye QT ShiftEST Vertical Lines - Auto DST Adjustment
Overview
This indicator draws customizable vertical lines at specific Eastern Time (EST/EDT) points throughout the trading day, automatically adjusting for daylight savings time. Designed for precision trading on 1-minute and 5-minute charts, it highlights key intraday moments when price action tends to accelerate.
Features
- **18 pre-configured NY session times** (09:50-15:45 ET)
- **Auto timezone conversion** - Always shows correct EST/EDT regardless of your local timezone
- **3 line styles** - Choose between solid/dashed/dotted lines
- **Clean labeling** - Optional time markers above each line
- **1m/5m optimized** - Perfect for scalpers and day traders
- **Visual alerts** - "TOUCH" labels when price interacts with lines
Inputs
| Parameter | Description | Default |
|-----------|-------------|---------|
| Line Times | Comma-separated HH:MM times | 09:50,10:10,...15:45 |
| Line Color | Line color | Black |
| Line Width | 1-5px thickness | 2 |
| Line Style | Solid/Dashed/Dotted | Solid |
| Show Labels | Display time markers | true |
How To Use
1. Apply to 1m or 5m charts
2. Lines appear automatically at specified EST times
3. Watch for price reactions at these key levels
4. Customize styles via indicator settings
Ideal For
- NY open/London close traders
- Earnings/News traders
- Breakout traders
- Market open/close strategies
Updates
v1.1 - Added line style customization
v1.0 - Initial release

ICT Macro H1"H1 Candle Time Box" is a custom TradingView indicator that highlights a configurable time window surrounding the close of each 1-hour (H1) candle. The indicator draws a transparent box 15 minutes before and after each H1 candle close (by default), helping traders visualize time-based reaction zones.
🔍 Features:
Custom time window: Users can set how many minutes before and after the H1 close the box should appear.
Dynamic positioning: Boxes are drawn slightly above the candles to avoid overlap with price bars.
Live time labels: Each box displays its time range (e.g., "08:45 - 09:15") based on the start and end time of the zone.
Auto-cleaning: Only a limited number of recent boxes (default: 5) are shown, keeping the chart clean.
Requires 1-minute chart for precise timing.
This tool is especially helpful for intraday traders to identify areas of interest or market reactions before and after key hourly closes.

Nirmal Fair Value GapsICT Fair Value Gaps
Trade Wisely
How a Fair Value Gap Works
Formation:
A Fair Value Gap occurs when a strong price movement (usually from institutional orders) creates an imbalance between buyers and sellers.
This is typically seen in a three-candle pattern, where the middle candle has a large body, and the two surrounding candles have wicks but little overlap with the middle candle’s range.
Identification:
The FVG is marked between the high of the first candle and the low of the third candle (for bullish gaps).
For bearish gaps, it’s the low of the first candle and the high of the third candle.
Market Behavior Around FVG:
Price often retraces into the gap before resuming its original direction.
This happens because the market seeks to "fill" the imbalance where few trades occurred.
Traders use FVGs as potential entry zones for trend continuation trades.
Trading Fair Value Gaps
In an Uptrend:
Look for bullish fair value gaps as potential support zones for buy entries.
Price may dip into the gap and then continue upward.
In a Downtrend:
Look for bearish fair value gaps as potential resistance zones for sell entries.
Price may retrace into the gap and then drop further.
Confluence Factors:
FVGs work best when combined with other strategies like order blocks, liquidity zones, or key Fibonacci levels.

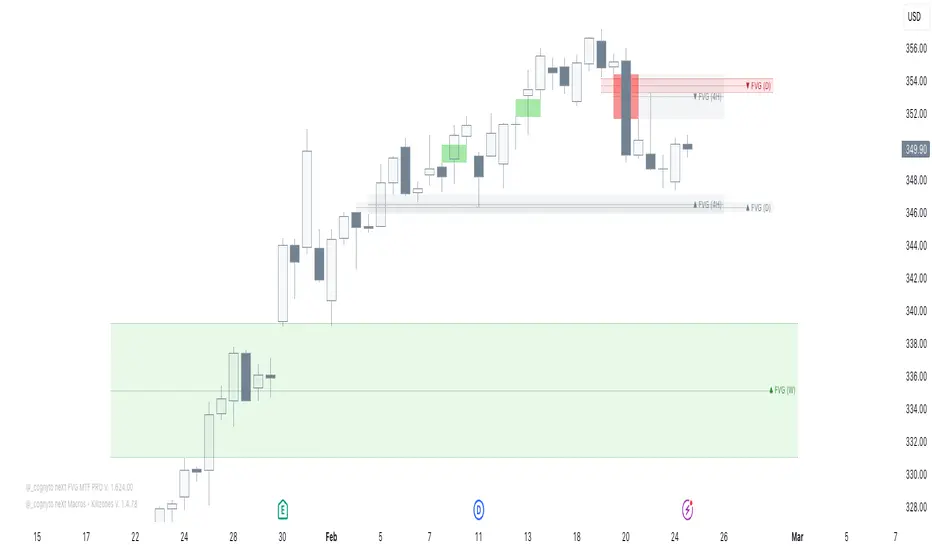
neXt FVG MTF PRO [cognyto]The neXt FVG Multi-Timeframe Indicator represents a remarkable edge in Fair Value Gap analysis. It offers traders a comprehensive and simplified interface to simultaneously monitor Fair Value Gaps across up to 9 different configurable timeframes . This feature shows traders exclusively the closest and most relevant gaps, enabling more precise top-down price action analysis. This makes it particularly valuable for strategies focused on market liquidity and inefficiencies.
Here are the 10 fundamental features that distinguish this indicator
1. Intelligent Visualisation of Next Gaps
An advanced filtering system is implemented to prioritise the visualisation of the nearest FVGs, hence its name -next-, offering a clean FVGs layout on the screen and improving analysis precision. The visualisation system continuously updates according to market price evolution, and as FVGs appear, are mitigated, or eliminated across different timeframes, it updates to ensure a structured and efficient interface.
2. Top-Down Multi-Timeframe Analysis
An efficient visualisation system is implemented to simultaneously manage up to 9 different timeframes. The differentiation between FVGs and their timeframes is established through proportional length in their visual presentation, where higher timeframes extend further to the right, establishing a clear visual hierarchy. The further right the gap extends, the stronger its significance. This structure allows visualization of both current timeframe gaps and those of higher timeframes, facilitating comprehensive market analysis.
3. Alerts
The indicator incorporates a complete notification system that allows users to stay informed in real-time about a wide range of critical events related to Gaps. This system includes customisable alerts for new Fair Value Gaps formation, mitigation notifications, and precise identification of significant gap breakout patterns, technically known as Breakaway gaps.
4. Mitigation
Mitigations represent a fundamental element in technical analysis, identifying zones where price has reached equilibrium. Considering the analytical importance of mitigated gaps, the indicator maintains their visualisation with a specific different color distinction. Additionally, it includes optional functionality for removing mitigated gaps, which can be activated according to user preferences.
5. BISI and SIBI
In addition to the FVGs present in all timeframes, the indicator facilitates precise configuration of BISI and SIBI gaps in the current timeframe, maintaining dynamic visualisation during the additional analysis process alongside other timeframes. This feature optimises the evaluation of historical market imbalances and inefficiencies, offering significant analytical perspectives in the current timeframe, and even refining market entry or exit strategies.
6. Breakaway-Gaps
The indicator provides advanced functionality for identifying and analysing Breakaway-Gaps, presenting in a structured manner the corresponding candle formations that create the Gap. This feature allows precise evaluation of strong market movements, including the assessment of potential retracements and directional patterns in high volatility conditions.
7. Consequent-Encroachment (C.E.)
The indicator implements advanced functionality that visualizes the midpoint of the displacement candle that generates the gap, using precise calculation based on the opening and closing levels of that candle.
8. FVG Fulfilment
The indicator offers advanced configuration options for FVG fullfilmet conditions through two main criteria: confirmation through candle closure that exceeds the established FVG limits, or validation through the intersection of extreme candle levels (maximum/minimum) with the FVG threshold.
9. FVG-Visualisations
Gaps are visualised on the platform once the third candle formation is complete. The system provides optional visualisation functionality during the formation process, although this feature is specifically recommended for predictive analysis, being most effective during daily or weekly market closing intervals. This feature maintains its consistency exclusively in the active timeframe.
10. Customisation
The indicator presents a wide range of advanced customisation options, facilitating comprehensive modification of visual elements. This includes professional adaptation of color palettes, typographic dimensions, line configurations, and design attributes, allowing precise optimisation according to specific user analytical requirements.
This indicator is available exclusively on TradingView. To access it, please see the ‘Author's Instructions’ above and visit our website.
DISCLAIMER
This indicator is provided for informational and educational purposes only. It does not constitute financial advice, trading advice, or any other type of advice, and should not be interpreted as a recommendation to buy, sell, or hold any investment or security of any kind. The information provided by this indicator is not intended as a substitute for professional financial advice. Users of this indicator bear sole responsibility for their trading and investment decisions, including the interpretation of market data and signals generated by this indicator. Past performance is not indicative of future results. Trading financial markets carries substantial risk of loss. Users should conduct their own research, seek professional advice when needed, and exercise due diligence before making any trading or investment decisions.
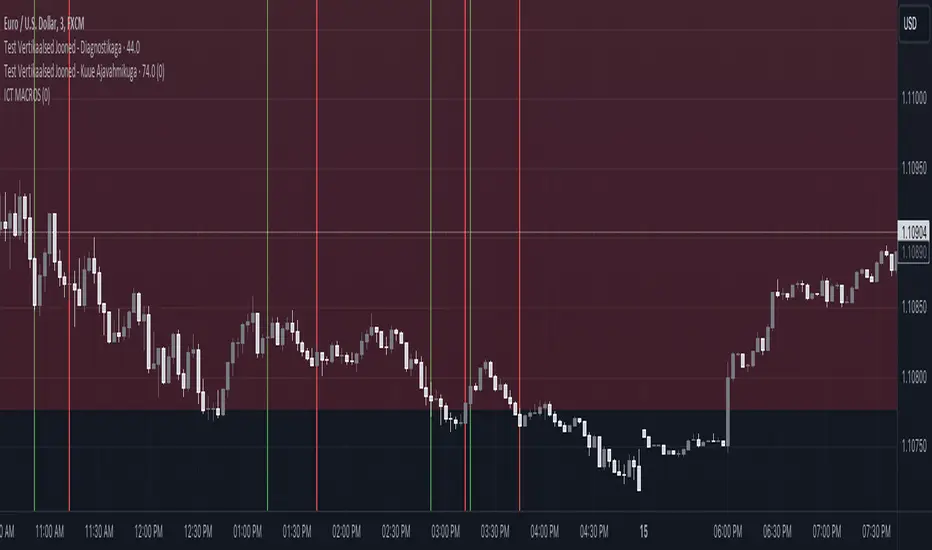
ICT MACROS (UTC-4)This Pine Script creates an indicator that draws vertical lines on a TradingView chart to mark specific time intervals during the day. It allows the user to see when certain predefined time periods start and end, using vertical lines of different colors. The script is designed to work with time frames aligned to the UTC-4 timezone.
### Key Features of the Script
1. **Vertical Line Drawing Function**:
- The script uses a custom function, `draw_vertical_line`, to draw vertical lines at specific times.
- This function takes four parameters:
- `specificTime`: The specific timestamp when the vertical line should be drawn.
- `lineColor`: The color of the vertical line.
- `labelText`: The text label for the line (used internally for debugging purposes).
- `adjustment_minutes`: An integer value that allows time adjustment (in minutes) to make the lines align more accurately with the chart’s candles.
- The function calculates an adjusted time using the `adjustment_minutes` parameter and checks if the current time (`time`) falls within a 3-minute range of the adjusted time. If it does, it draws a vertical line.
2. **User Input for Time Adjustment**:
- The `adjustment_minutes` input allows users to fine-tune the appearance of the lines by shifting them slightly forward or backward in time to ensure they align with the chart candles. This is useful because of potential minor discrepancies between the script’s timestamps and the chart’s actual candle times.
3. **Predefined Time Intervals**:
- The script specifies six different time intervals (using the UTC-4 timezone) and draws vertical lines to mark the start and end of each interval:
- **First interval**: 8:50 - 9:10 AM
- **Second interval**: 9:50 - 10:10 AM
- **Third interval**: 10:50 - 11:10 AM
- **Fourth interval**: 13:10 - 13:40 PM
- **Fifth interval**: 14:50 - 15:10 PM
- **Sixth interval**: 15:15 - 15:45 PM
- For each interval, there are two timestamps: the start time and the end time. The script draws a green vertical line for the start and a red vertical line for the end.
4. **Line Drawing Logic**:
- For each time interval, the script calculates the timestamp using the `timestamp()` function with the specified time in UTC-4.
- The `draw_vertical_line` function is called twice for each interval: once for the start time (with a green line) and once for the end time (with a red line).
5. **Visual Overlay**:
- The script uses the `overlay=true` setting, which means that the vertical lines are drawn directly on top of the existing price chart. This helps in visually identifying the specific time intervals without cluttering the chart.
### Summary
This Pine Script is designed for traders or analysts who want to visualize specific time intervals directly on their TradingView charts. It provides a customizable way to highlight these intervals using vertical lines, making it easier to analyze price action or trading volume during key times of the day. The `adjustment_minutes` input adds flexibility to align these lines accurately with chart data.
ICT Watermark | FluxxDescription:
The watermark indicator is designed to enhance the visual presentation of your trading charts by adding customizable watermarks. This tool allows you to overlay essential information, such as ticker symbols, timeframes, dates, and custom text, directly onto your charts. While providing larger text options then all other watermarks currently available.
Key Features:
Customizable Watermarks: Users can enable up to two watermarks with adjustable text content, color, size, and position.
Dynamic Information Display: Option to display real-time symbol and timeframe details, as well as the current date.
Flexible Placement: Watermarks can be positioned at the top, middle, or bottom of the chart, and aligned to the left, center, or right.
Multiple Size Options: Includes a variety of text sizes, making the text larger than any other watermark out there!
Use Cases:
Branding: Add your name or brand to your charts for a personalized touch.
Clarity: Overlay important chart details without obstructing the main content, helping in presentations or shared analysis.
This indicator is original and valuable for traders who seek to enhance the clarity and professionalism of their charts. It is particularly useful for those who create educational content or wish to maintain consistent chart branding.
ICT Premium/DiscountThis script indicator prints lines for the highest, lowest and middle price in a selected time period (in days).
With that you can easily see wheter the price is currently high, low or balanced compared to the prices in the selected time period.
I also added a gray dotted vertical line to the chart which represents the beginning of your selected time period
You can choose the time period on your own and you can also customize the color and style of the lines.
Your lines may get printed in a separate window. To fix this, click on the indicator and select
Move to -> existing pane above
Your lines also may stay stuck on the same place on the chart and are not fixed to a high/low. To fix this, right-click on the left price scale and select
Merge all scales into one -> on the right

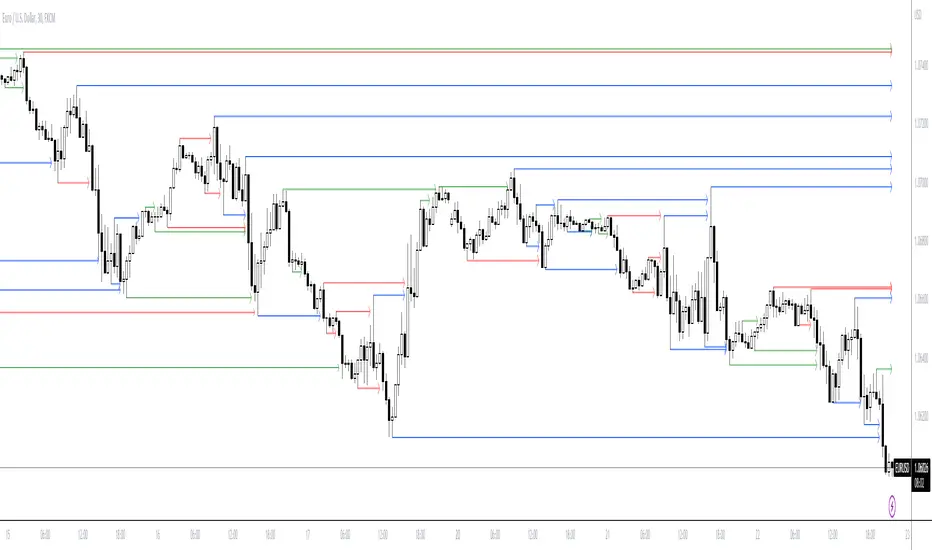
ICT KillZones + Pivot Points [TradingFinder] Support/Resistance 🟣 Introduction
Pivot Points are critical levels on a price chart where trading activity is notably high. These points are derived from the prior day's price data and serve as key reference markers for traders' decision-making processes.
Types of Pivot Points :
Floor
Woodie
Camarilla
Fibonacci
🔵 Floor Pivot Points
Widely utilized in technical analysis, floor pivot points are essential in identifying support and resistance levels. The central pivot point (PP) acts as the primary level, suggesting the trend's likely direction.
The additional resistance levels (R1, R2, R3) and support levels (S1, S2, S3) offer further insight into potential trend reversals or continuations.
🔵 Camarilla Pivot Points
Featuring eight distinct levels, Camarilla pivot points closely correspond with support and resistance, making them highly effective for setting stop-loss orders and profit targets.
🔵 Woodie Pivot Points
Similar to floor pivot points, Woodie pivot points differ by placing greater emphasis on the closing price, often resulting in different pivot levels compared to the floor method.
🔵 Fibonacci Pivot Points
Fibonacci pivot points combine the standard floor pivot points with Fibonacci retracement levels applied to the previous trading period's range. Common retracement levels used are 38.2%, 61.8%, and 100%.
🟣 Sessions
Financial markets are divided into specific time segments, known as sessions, each with unique characteristics and activity levels. These sessions are active at different times throughout the day.
The primary sessions in financial markets include :
Asian Session
European Session
New York Session
The timing of these major sessions in UTC is as follows :
Asian Session: 23:00 to 06:00
European Session: 07:00 to 14:25
New York Session: 14:30 to 22:55
🟣 Kill Zones
Kill zones are periods within a session marked by heightened trading activity. During these times, trading volume surges and price movements become more pronounced.
The timing of the major kill zones in UTC is :
Asian Kill Zone: 23:00 to 03:55
European Kill Zone: 07:00 to 09:55
New York Kill Zone: 14:30 to 16:55
Combining kill zones and pivot points in financial market analysis provides several advantages :
Enhanced Market Sentiment Analysis : Aligns key price levels with high-activity periods for a clearer market sentiment.
Improved Timing for Trade Entries and Exits : Helps better time trades based on when price movements are most likely.
Higher Probability of Successful Trades : Increases the accuracy of predicting market movements and placing profitable trades.
Strategic Stop-Loss and Profit Target Placement : Allows for precise risk management by strategically setting stop-loss and profit targets.
Versatility Across Different Time Frames : Effective in both short and long time frames, suitable for various trading strategies.
Enhanced Trend Identification and Confirmation : Confirms trends using both pivot levels and high-activity periods, ensuring stronger trend validation.
In essence, this integrated approach enhances decision-making, optimizes trading performance, and improves risk management.
🟣 How to Use
🔵 Two Approaches to Trading Pivot Points
There are two main strategies for trading pivot points: utilizing "pivot point breakouts" and "price reversals."
🔵 Pivot Point Breakout
When the price breaks through pivot lines, it signals a shift in market sentiment to the trader. In the case of an upward breakout, where the price crosses these pivot lines, a trader might enter a long position, placing their stop-loss just below the pivot point (P).
Conversely, if the price breaks downward, a short position can be initiated below the pivot point. When using the pivot point breakout strategy, the first and second support levels can serve as profit targets in an upward trend. In a downward trend, these roles are filled by the first and second resistance levels.
🔵 Price Reversal
An alternative method involves waiting for the price to reverse at the support and resistance levels. To implement this strategy, traders should take positions opposite to the prevailing trend as the price rebounds from the pivot point.
While this tool is commonly used in higher time frames, it tends to produce better results in shorter time frames, such as 1-hour, 30-minute, and 15-minute intervals.
Three Strategies for Trading the Kill Zone
There are three principal strategies for trading within the kill zone :
Kill Zone Hunt
Breakout and Pullback to Kill Zone
Trading in the Trend of the Kill Zone
🔵 Kill Zone Hunt
This strategy involves waiting until the kill zone concludes and its high and low lines are established. If the price reaches one of these lines within the same session and is strongly rejected, a trade can be executed.
🔵 Breakout and Pullback to Kill Zone
In this approach, once the kill zone ends and its high and low lines stabilize, a trade can be made if the price breaks one of these lines decisively within the same session and then pulls back to that level.
🔵 Trading in the Trend of the Kill Zone
Kill zones are characterized by high trading volumes and strong trends. Therefore, trades can be placed in the direction of the prevailing trend. For instance, if an upward trend dominates this area, a buy trade can be entered when the price reaches a demand order block.

ICT LIQUIDITY indicator [Focused Trader]This indicator allows you to draw liquidity according to ICT. Specifically, you can choose to draw liquidity for specific sessions (Asia,New York,London).
Filtering by session
You can chooose to display only liquidities created in specific session. For example, the favourite liquidity is that of Asia. And then, in London market usually grabs it. So you set to display only liquidites of asia.
Session background
You can also display background over specific session, this is very usefull to see how market behaves - liquidity created in Asia is very often taken in London session. You can use any colour you'd like.
Colouring and style of lines
There is an option to choose colour for liquidity lines from different sessions and also choose specific colour for highs and lows. You can also set different styles (dash, dot, arrow, ...) of liquidty lines.
ICT FVG indicator [Focused Trader]This is simple fair value gap indicator. It draws FVG (fair value gaps) as boxes. If FVG is partially filled, it is also displayed and smaller size FVG is drawn. If FVG is filled totally, it is deleted from chart. There is limitation of 500 drawing objects for indicators on Tradingview, so keep in mind that this indicator will display only last 500 FVGs.
For simplicity, there is only one setting, which is coloring of FVGs. It is perhaps a good idea to lower your opacity (to about 10%) and choose color of FVG according to your preferences and current theme (dark or white).

ICT Market SessionsThis indicator highlights sessions, kill-zones and significant time elements on the chart based on ITC's method.
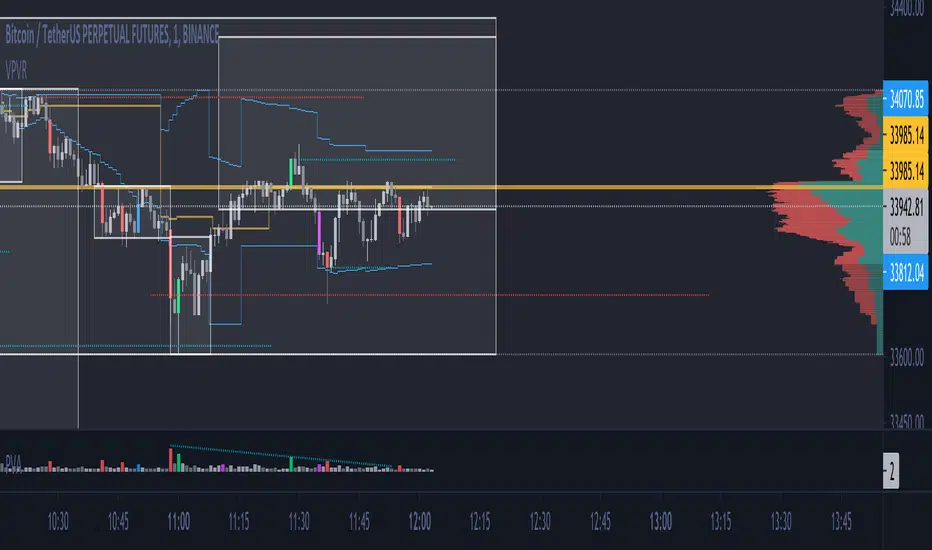
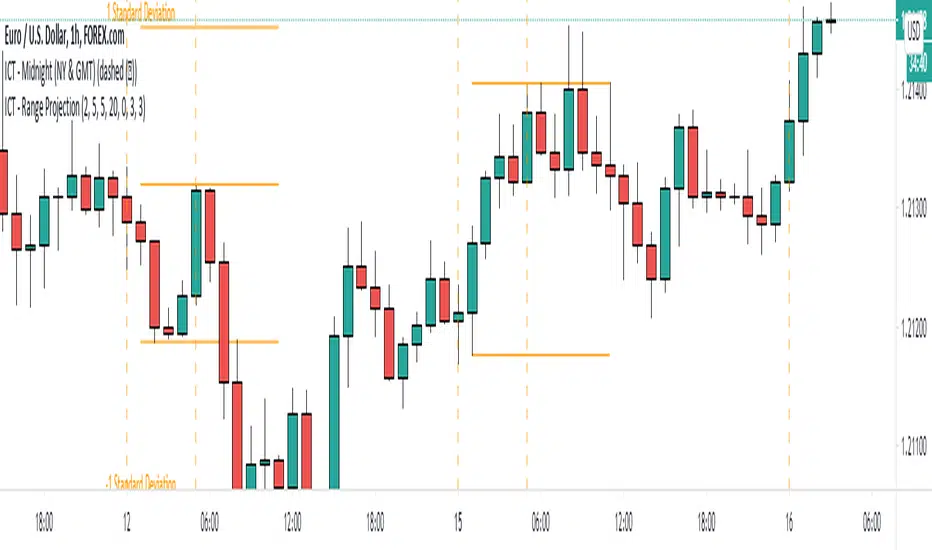
ICT - Range ProjectionThis script helps you to project future intra-day range or weekly range based on the Asia range.
It draws multiple horizontal lines on the standard deviation levels. (There is a limitation of around 50 vertical lines per script)

ICT Killzone For Crypto Markets.Adjusted for Crypto 24/7 markets
Adjusted for UTC
i have hidden the asian open range and daily bars on my charts , you can choose to have them on
Less screen clutter
London Open 8:00 - 4:30 - Killzone 7:00 - 9:00
NewYork Open 9:30 - 4:00 Killzone 8:00 - 10:00
Shanghai open 9:15 Killzone 8:00 - 10:00
NOT MY ORIGINAL SCRIPT. JUST MODIFIED VERSION


NeuraEdge Pro v1- Auto-OptimizedNeuraEdge Pro is an advanced, self-optimizing trading system that combines Smart Money Concepts (SMC), ICT principles, and adaptive neural networks to identify high-probability trade setups. The indicator automatically learns from its signal history and optimizes parameters in real-time to maintain your target win rate.
Key Features:
✅ Auto-optimization based on historical performance
✅ Neural adaptive system that learns market conditions
✅ ICT session filtering (London, New York, Asian)
✅ Smart Money Concepts integration
✅ Multi-timeframe support (Scalping to Swing trading)
✅ Built-in risk management system
📊 How It Works
NeuraEdge Pro identifies institutional order blocks, fair value gaps, and liquidity zones using advanced price action analysis. The system then filters these setups through multiple confluence factors including:
Market structure alignment
Volume confirmation
Neural network prediction
Session timing (ICT concepts)
Momentum indicators
RSI divergences
The higher you set the confluence number to (max 5) the more accurate but less signal quantity preferred on higher time frame from 1 HR and above.
The unique auto-optimization engine tracks signal performance and automatically adjusts internal parameters to improve accuracy over time.
⚙️ Recommended Settings by Trading Style
🔥 Scalping (1m - 5m charts)
Trading Mode:
✅ Scalp Mode
❌ Intraday Mode
❌ Swing Mode
✅ ICT Concepts
✅ Neural Adaptive
Risk Management:
Risk % per Trade: 0.5-1.0%
Risk:Reward Ratio: 2:1
ATR-Based Stop Loss: ON
ATR Multiplier: 1.3
Min SL Points: 15-20
Advanced Settings:
Analysis Lookback: 40
Order Block Strength: 4-5
Base FVG Size: 0.8-1.0
Base Volume Threshold: 1.8
Base Confluence Score: 4
📈 Intraday (15m - 1h charts)
Trading Mode:
❌ Scalp Mode
✅ Intraday Mode
❌ Swing Mode
✅ ICT Concepts
✅ Neural Adaptive
Risk Management:
Risk % per Trade: 1.0-1.5%
Risk:Reward Ratio: 2.5:1
ATR-Based Stop Loss: ON
ATR Multiplier: 1.5
Min SL Points: 25-30
Advanced Settings:
Analysis Lookback: 50
Order Block Strength: 4
Base FVG Size: 0.9
Base Volume Threshold: 1.6
Base Confluence Score: 4
📊 Swing Trading (4h - Daily charts)
Trading Mode:
❌ Scalp Mode
❌ Intraday Mode
✅ Swing Mode
✅ ICT Concepts
✅ Neural Adaptive
Risk Management:
Risk % per Trade: 1.5-2.0%
Risk:Reward Ratio: 3:1
ATR-Based Stop Loss: ON
ATR Multiplier: 1.8
Min SL Points: 40-50
Advanced Settings:
Analysis Lookback: 75
Order Block Strength: 3-4
Base FVG Size: 1.0-1.2
Base Volume Threshold: 1.5
Base Confluence Score: 3-4
🤖 Auto-Optimization Settings
Recommended for all timeframes:
Enable Auto-Optimization: ON
Optimization Lookback: 100 trades
Target Win Rate: 60%
💡 The system needs at least 10-15 signals to begin optimization. Initial signals use base settings, then the system adapts automatically.
🔮 Predictive Analysis
Keep these balanced for optimal results:
Enable Predictive Mode: ON
Price Action Weight: 0.4
Volume Weight: 0.3
Momentum Weight: 0.3
These weights determine how much each factor influences setup scoring.
📱 Signal Interpretation
BUY Signals (Green Labels)
Price has reached a bullish order block or FVG
Multiple confluence factors aligned
Neural network confirms bullish bias
Entry price shown on label
Green dashed line = Take Profit target
Red dashed line = Stop Loss
SELL Signals (Red Labels)
Price has reached a bearish order block or FVG
Multiple confluence factors aligned
Neural network confirms bearish bias
Entry price shown on label
Green dashed line = Take Profit target
Red dashed line = Stop Loss
📊 Dashboard Explained
Top Section:
Mode - Active trading mode and timeframe
Trend - Current market structure (Bullish/Bearish/Range)
Vol - Volume ratio (higher = stronger moves)
ATR - Current volatility measurement
Auto-Optimize Section:
Win Rate - Historical performance (updates after signals)
FVG/Vol/Conf - Current optimized parameters with arrows:
↑ = System increased selectivity (fewer signals)
↓ = System decreased selectivity (more signals)
= = No change from base settings
Ready OBs - Number of high-probability setups currently available
⚠️ Important Trading Rules
Wait for signal labels - Don't trade order blocks/FVGs without confirmation
Respect the stop loss - Always displayed as red dashed line
Use proper position sizing - Based on your Risk % setting
Trade during recommended sessions - When ICT Concepts enabled
Let auto-optimization work - Give it 15-20 signals before judging
One signal at a time - System prevents new signals for 5 bars after entry
🎯 Best Practices
✅ DO:
Use on liquid, trending markets (Forex majors, indices, crypto majors)
Enable only ONE trading mode matching your timeframe
Keep ICT Concepts enabled for session filtering
Trust the auto-optimization after 15+ signals
Set alerts for BUY/SELL signals
❌ DON'T:
Enable multiple trading modes simultaneously
Override stop losses manually
Trade during low liquidity hours without ICT filtering
Expect perfection - manage risk appropriately
Judge performance before 20+ signals
🔔 Alert Setup
The indicator includes 4 alert types:
Buy Signal - Long entry opportunity
Sell Signal - Short entry opportunity
Sell-Side Sweep - Liquidity grabbed above
Buy-Side Sweep - Liquidity grabbed below
Set up alerts via TradingView's alert menu for real-time notifications.
📈 Performance Tracking
The dashboard shows real-time performance metrics:
Win Rate % - Percentage of profitable signals
Parameter adjustments - How the system is adapting
Neural Score - AI confidence (0-1 scale)
ICT Session Status - Whether optimal trading hours are active
💡 Pro Tips
Start conservative - Use recommended settings for your timeframe
Give it time - Auto-optimization needs 20-30 signals for best results
Higher timeframes = higher quality - Fewer but better signals
Volume matters - Strongest signals occur on volume spikes
Structure alignment - Best trades align with overall trend
⚙️ Technical Requirements
Minimum Timeframe: 1 minute
Maximum Timeframe: Monthly
Best Timeframes: 5m, 15m, 1h, 4h
Asset Classes: Forex, Crypto, Indices, Stocks
Account Type: Any (works with all TradingView plans)
📞 Support & Updates
This indicator is actively maintained and updated based on user feedback. Future updates will include additional features and optimizations.
Disclaimer: Trading involves substantial risk. This indicator is a tool to assist analysis, not a guarantee of profits. Always use proper risk management and never risk more than you can afford to lose. Past performance does not guarantee future results.

Trading Macro Windows by BW v2
Trading Macros by BW: Integrating ICT Concepts for Session Analysis
This indicator combines two key Inner Circle Trader (ICT) concepts—Change in State of Delivery (CISD) or Inverted Fair Value Gap (IFVG) signals with Macro Time Windows—to provide a unified tool for analyzing intraday price action, particularly during Pacific Time (PT) sessions. Rather than simply merging existing scripts, this integration creates a cohesive visual framework that highlights how macro consolidation periods interact with potential reversal or continuation signals like CISD or IFVG. By overlaying macro candle styling and borders on the chart alongside selectable signal lines, traders can better contextualize setups within ICT's macro narrative, where price often manipulates liquidity during these windows before displacing toward higher-timeframe objectives.
Core Components and How They Work Together:
Macro Time Windows (Inspired by ICT's Macro Periods):
ICT emphasizes "macro" as 30-minute windows (e.g., 06:45–07:15 PT, 07:45–08:15 PT, up to 11:45–12:15 PT) where price tends to consolidate, sweep liquidity, or form key structures like Fair Value Gaps (FVGs). These periods set the stage for the session's directional bias.
The indicator styles candles within these windows using a user-defined color for wicks, borders, and bodies (translucent for visibility). This visual emphasis helps traders focus on activity inside macros, where reversals or continuations often originate.
Borders are drawn as vertical lines at the start and end of each window (with a +5 minute buffer to capture related activity), using a dotted style by default. This creates a "study zone" that encapsulates macro events, allowing traders to assess if price is respecting or violating these zones in alignment with broader ICT models like the Power of 3 (AMD cycle).
Toggle: "Macro Candles Enabled" (default: true) – Turn off to disable styling and borders if focusing solely on signals.
CISD or IFVG Signals (Selectable Mode):
Mode Selection: Choose between "Change in the State of Delivery" (CISD) or "IFVG" (default: IFVG). Both detect shifts in market delivery during specific 30-minute slices (15–45 or 17–45 minutes past the hour in PT sessions).
CISD Mode: Based on ICT's definition of a sudden directional shift, this identifies aggressive displacements after sweeping recent highs/lows. It uses a rolling reference high/low over 6 bars, checks for sweeps (penetrating by at least 2 ticks in the last 2-3 bars), reclamation (closing beyond the reference with at least 50% body), and displacement (50% of prior range or an immediate FVG of 6+ ticks). Signals plot a horizontal line from the close, extending 24 bars right, labeled "CISD."
IFVG Mode: Focuses on Inverted Fair Value Gaps, where a bullish FVG (low > high by 13+ ticks) forms but is inverted (closed below) in the same slice, signaling bearish intent (or vice versa). This targets violations against opposing liquidity, often leading to raids on external ranges. Signals plot similarly, labeled "IFVG."
Shared Logic: Both modes enforce a 55-bar cooldown to prevent clustering, operate only during PT sessions (06:30–13:00), and use tick-based thresholds for precision across instruments. The integration with macros allows traders to see if signals occur within or at the edges of macro windows, enhancing confirmation—for example, a CISD inside a macro might indicate a manipulated reversal toward the session's true objective.
Toggle: "Signals Enabled" (default: true) – Turn off to hide all signal lines and labels, isolating the macro visualization.
How Components Interact:
Macro windows provide the "narrative context" (consolidation/manipulation), while CISD/IFVG signals detect the "delivery shift" (displacement). Together, they form a mashup that justifies publication: isolated signals can be noisy, but when filtered by macro periods, they align with ICT's session model. For instance, an IFVG inversion during a macro might confirm a liquidity sweep before targeting PD arrays or order blocks.
No external dependencies; all calculations are self-contained using Pine's built-in functions like ta.highest/lowest for references and time-based sessions for windows.
Usage Guidelines:
Apply to intraday charts (e.g., 1-5 min) or stocks during PT hours.
Look for confluence: A bull IFVG signal post-macro low sweep might target the next macro high or daily bias.
Customize colors/styles for signals (solid/dashed/dotted lines) and macros to suit your chart.
Backtest in replay mode to observe how macros frame signals—e.g., price often respects macro borders as S/R.
Limitations: Timezone-fixed to PT (America/Los_Angeles); signals are directional hints, not trade entries. Combine with ICT tools like order blocks or liquidity pools for full setups.
This script draws from community ICT implementations but refines them into a single, purpose-built tool for macro-driven trading, reducing chart clutter while emphasizing interconnected concepts. Feedback welcome!

Midnight Range Standard DeviationsCredit to Lex Fx for the basic framework of this script
This indicator is designed to assist traders in identifying potential trading opportunities based on the Intraday Concurrency Technique (ICT) concepts, specifically the midnight range deviations and their relationship to Fibonacci levels. It builds upon the work of Lex-FX, whom we gratefully acknowledge for the original concept and inspiration for this indicator.
Core Concept: ICT Midnight Range
The core of this indicator revolves around the concept of the midnight range. According to ICT, the high and low formed in a specific time window (typically the first 30 minutes after midnight, New York Time) can serve as a key reference point for intraday price action. The indicator identifies this range and projects potential support and resistance levels based on deviations from this range, combined with Fibonacci ratios.
How ICT Uses Midnight Range Deviations
ICT methodology often involves looking for price to move away from the initial midnight range, then return to it, or deviate beyond it, as key areas for potential entries.
Range Identification: The indicator automatically identifies the high and low of the midnight range (00:00 - 00:30 NY Time).
Deviation Levels: The indicator calculates and displays deviation levels based on multiples of the initial midnight range. These levels are often used to identify potential areas of support and resistance, as well as potential targets for price movement. These levels can be set in the additional fib levels section, which can be configured in increments of .5 deviations all the way up to 12 deviations.
Fibonacci Confluence: ICT often emphasizes the confluence of multiple factors. This indicator adds Fibonacci levels to the midnight range deviations. This allows traders to identify areas where Fibonacci retracements or extensions align with the deviation levels, potentially creating stronger areas of support or resistance.
Looking for Sweeps: ICT often uses these levels to look for times that the high and low are swept as potential areas of liquidity, indicating the start of potential continuations.
Time-Based Analysis: The time at which price interacts with these levels can also be significant in ICT. The indicator provides options to extend the range lines to specific times (e.g., 3 hours, 6 hours, 10 hours, 12 hours, or a custom defined time) after midnight, allowing traders to focus on specific periods of the trading day.
Indicator Settings Explained:
Time Zone (TZ): Defines the time zone used for calculating the midnight range. The default is "America/New_York".
Range High Color, Range Low Color, Range Mid Color: Customize the colors of the high, low, and mid-range lines.
Range Fill Color: Sets the fill color for the area between the range high and low.
Line Style: Choose the style of the range lines (solid, dashed, dotted).
Range Line Thickness: Adjust the thickness of the range lines for better visibility.
Show Fibonacci Levels: Enable or disable the display of Fibonacci deviation levels.
Fib Up Color, Fib Down Color: Customize the colors of the Fibonacci levels above (up) and below (down) the midnight range.
Show Trendline: Enables a trendline that plots the close price, colored according to whether the price is above the high, below the low, or within the midnight range.
Show Range Lines, Show Range Labels: Toggles the visibility of the range lines and their associated labels.
Label Size: Adjust the size of the labels for better readability.
Hide Prices: Option to display only the deviation values on labels, hiding price values.
Place Fibonacci Labels on Left Side: Option to switch label position from right side to left side.
Extend Range To (Hours from Midnight): This section gives you a wide variety of options on how far you want to extend the range to, you can do 3,6,10,12, and 23 hours. Alternatively, you can select the "Use Custom Length" and set a specific time in hours.
Additional Fib Levels: This section allows the trader to set additional deviation points in increments of .5 deviations from .5 all the way up to 12 deviations
TradingView Community Guidelines Compliance:
This indicator description adheres to the TradingView community guidelines by:
Being educational: It explains the ICT methodology and how the indicator can be used in trading.
Being transparent: It clearly describes all the indicator's settings and their purpose.
Providing credit: It acknowledges Lex-FX as the original author of the concept.
Avoiding misleading claims: It does not guarantee profits or imply that the indicator is a "holy grail."
Disclaimer: Usage of this indicator and the information provided is at your own risk. The author is not responsible for any losses incurred as a result of using this indicator.
Important Considerations:
This indicator is intended for educational purposes and to assist in applying the ICT methodology.
It should not be used as a standalone trading system.
Always combine this indicator with other forms of technical analysis and risk management techniques.
Backtest thoroughly on your chosen market and timeframe before using in live trading.
Trading involves risk. Only trade with capital you can afford to lose.

ATR/ADR MTF Projection ArrayATR/ADR MTF Projection Array
Overview
A powerful predictive tool that projects ATR (Average True Range) and ADR (Average Daily Range) levels as clean support and resistance arrays on your chart. Designed for traders who want to anticipate the high and low of the day using volatility-based projections with multi-timeframe confluence.
This indicator combines traditional ATR analysis with ICT-style ADR methodology, giving you institutional-grade level projections from a single, customizable tool.
Key Features
🎯 Dual Volatility Metrics
ATR Projections — Classic volatility-based levels with full multi-timeframe support
ADR Projections (ICT Style) — Average Daily Range levels using Inner Circle Trader methodology
Enable/disable each independently based on your trading preference
📊 Multi-Timeframe ATR Analysis
Plot ATR levels from up to 3 timeframes simultaneously (Daily, Weekly, Monthly or custom)
Each timeframe displays with distinct styling for easy identification
Perfect for confluence trading across multiple time horizons
⚡ ICT ADR Methodology
NY Midnight calculation mode (ICT standard) or Classic Daily
Key ICT levels built-in:
1/3 ADR (Judas Swing) — Critical manipulation level where fake moves often terminate
1/2 ADR — Mid-range reference
2/3 ADR — Trending day continuation target
100% ADR — Full daily range completion
150% ADR — Extension target for expansion days
Two projection modes: Static (from anchor) or Dynamic (from session high/low)
🔧 Flexible Anchor Points
Previous Close (default)
Daily Open
Weekly Open
Monthly Open
Session Open
📈 Range Completion Tracking
Real-time display of how much of the expected daily range has been consumed
Visual status indicator helps identify when the day's move may be exhausted
How To Use
For Bias Confirmation:
Establish your directional bias using your preferred method (trigger day, market structure, etc.)
Monitor the 1/3 ADR level during London/NY open for potential Judas Swing (manipulation move)
Target 2/3 to 100% ADR for your HOD/LOD objective
For Target Setting:
Use ATR levels as volatility-based profit targets
ADR 100% level often marks session extremes
When Range Used reaches 100%+, expect consolidation or reversal
For Multi-Timeframe Confluence:
Enable Weekly/Monthly ATR levels alongside Daily
Look for clustering of levels across timeframes for high-probability zones
Settings Guide
Master Controls — Toggle ATR/ADR systems and bull/bear levels independently
ATR Settings — Configure period, multiplier, anchor point, and select which timeframes to display
ATR Level Multipliers — Choose which projection levels to show (0.5x, 0.75x, 1.0x, 1.25x, 1.5x)
ADR Settings (ICT Style) — Select calculation mode (NY Midnight recommended), period (5 days is ICT standard), and projection mode
ADR Level Selection — Toggle individual ICT levels (1/3, 1/2, 2/3, 100%, 150%)
Visual Settings — Customize colors, line styles, labels, and info table position
Alerts Included
ATR 1.0x Bull/Bear Cross
ADR 1/3 Judas Swing Zone (Bull/Bear)
ADR 100% Range Completion (Bull/Bear)

Sunmool's Next Day Model FVG AlertNY Killzone FVG Alert - ICT Fair Value Gap Detection Indicator
This comprehensive Pine Script indicator is specifically designed for traders following ICT (Inner Circle Trader) methodology and Smart Money Concepts. The indicator automatically detects Fair Value Gaps (FVG) that occur during the New York Killzone session, providing real-time alerts when these critical market imbalances are identified.
Key Features:
🎯 Fair Value Gap Detection
Automatically identifies bullish and bearish Fair Value Gaps using the classic 3-candle pattern
Filters gaps based on customizable minimum size thresholds to avoid insignificant imbalances
Provides visual representation through colored boxes and labels for easy identification
⏰ New York Killzone Focus
Specifically monitors the NY Killzone session (default: 7:00 AM - 10:00 AM EST)
Fully customizable session times to accommodate different trading preferences
Only detects FVGs when all three candles forming the gap occur within the killzone timeframe
📅 ICT Next Day Model Compliance
Automatically excludes Mondays from FVG detection as per ICT Next Day Model principles
Optional Monday exclusion can be toggled on/off based on trading strategy
Ensures alignment with professional ICT trading methodologies
🔔 Advanced Alert System
Three distinct alert conditions: Bullish FVG, Bearish FVG, and Combined alerts
Customizable alert messages for different notification preferences
Compatible with TradingView's full alert system including email, SMS, and webhook notifications
🎨 Visual Customization
Adjustable colors for bullish and bearish FVG boxes
Configurable box extension length for better visualization
Optional background highlighting during killzone sessions
Clean, professional chart presentation that doesn't clutter your analysis
📊 Technical Specifications
Works on all timeframes, though most effective on intraday charts (1m, 5m, 15m)
Timezone-aware calculations ensure accurate session detection globally
Efficient code structure minimizes processing load and chart lag
Compatible with other indicators and doesn't interfere with existing chart setups
🎯 Ideal For:
ICT methodology traders seeking automated FVG detection
Smart Money Concepts practitioners
Scalpers and day traders focusing on NY session
Traders looking to identify high-probability entry zones
Anyone interested in market structure and liquidity concepts
📈 Trading Applications:
Fair Value Gaps often serve as areas where price may return to "fill" the imbalance, making them excellent zones for:
Potential reversal areas
Take profit targets
Stop loss placement reference points
Market structure analysis
Confluence with other ICT concepts
⚙️ Customizable Parameters:
FVG minimum size filter
Killzone session start/end times
Visual display options
Alert preferences
Color schemes and styling options
This indicator brings institutional trading concepts to retail traders, helping identify the same market inefficiencies that smart money targets. By focusing specifically on the New York Killzone - one of the most liquid and volatile trading sessions - it provides high-quality signals during optimal market conditions.
Whether you're new to ICT concepts or an experienced trader looking to automate your FVG detection, this indicator provides the precision and reliability needed for professional trading analysis.
