LANZ Origins🔷 LANZ Origins – Multi-Framework Liquidity, Structure & Risk Management Overlay
LANZ Origins is an advanced multi-framework visualization toolkit that unifies key institutional concepts into one efficient interface. Designed for professional traders, it merges session mapping, liquidity analysis, imbalance detection, multi-account risk control, and higher-timeframe candle tracing — all in a single overlay.
🧩 Core Components
🈵 Asian Range Liquidity
Automatically detects and projects the Asian session range (19:00–02:00 NY) with an optional mid-price line (50 %). This provides visual context for intraday liquidity and manipulation zones commonly referenced in ICT-style analysis.
📊 Imbalance Detector
Highlights Fair Value Gaps (FVG), Opening Gaps (OG), and Volume Imbalances (VI) directly on-chart, using separate color schemes for bullish and bearish inefficiencies. Each element can be customized by width, ATR filter, and extension length.
🕯️ Higher-Timeframe Candles (ICT Style)
Displays multi-timeframe candles (HTF1–HTF6) simultaneously — e.g., 5 m, 30 m, 1 h, 4 h, 1 D, 1 W — each rendered with independent wick, border, and fill settings. Includes remaining-time counters, timeframe labels, and optional imbalance shading between bodies.
📈 Market Structure (ZigZag 30 m)
Replicates 30-minute swing structure to all active timeframes, producing dynamic pivots with live extension. Ideal for contextualizing BOS/CHoCH events across multiple scales.
💸 Multi-Account Lot Size Panel
Calculates position size for up to five accounts simultaneously, using your defined capital, risk %, and fixed SL distance (in pips). Results appear in a clean table at the bottom-right corner of the chart.
🎨 Session Visualization
Colored backgrounds mark key trading phases:
🟢 Day division
🔴 No-action zone
🔵 Kill-zone
🟡 Hold session
⚙️ Customization & Performance
Every module can be toggled individually, with full color, opacity, and style control. The script is optimized for overlay use and supports up to 500 boxes, lines, and labels with efficient resource handling.
🧠 Best Use Case
LANZ Origins is ideal for traders who follow:
Smart Money Concepts / ICT methodology
Liquidity & Imbalance-based trading
Multi-timeframe confluence setups
Risk-based position sizing workflows
Use it to observe how price interacts with liquidity pools, higher-timeframe candles, and imbalances within key sessions — while monitoring lot size risk in real time.
📌 Recommended Setup
Timeframes: 30m - 5m – 3m
Pairs: FX
Session Timezone: New York (EST/EDT)
Combine with: LANZ Strategy series for execution and journaling
💬 Note
This indicator does not generate buy/sell signals. It’s a visual and analytical tool built to support your own decision-making process.
Cari dalam skrip untuk "ict"

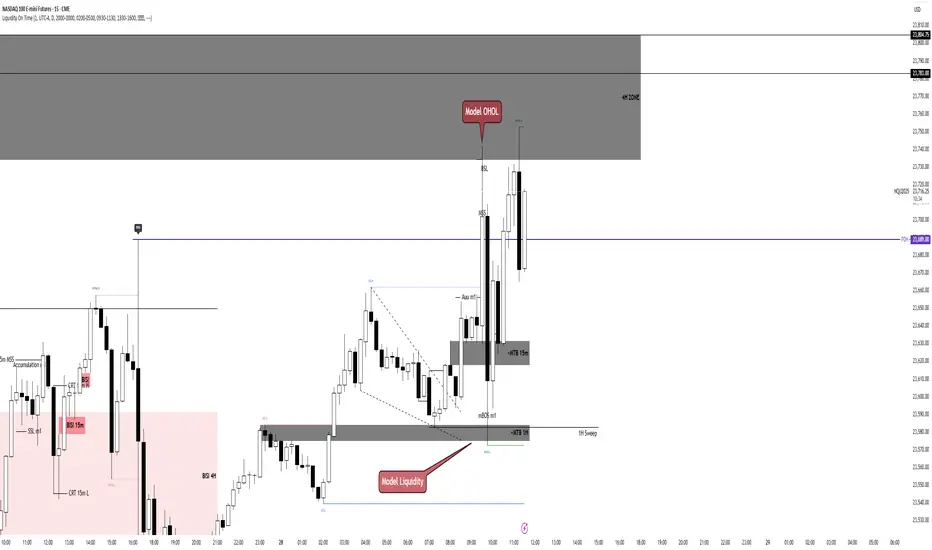
Liquidity On TimeIn ICT, liquidity means pools of orders resting in the market.
These are usually stop-losses or pending orders from retail traders.
Liquidity on time combines liquidity with the time-of-day element.
ICT teaches that markets deliver liquidity at specific trading sessions.
Main sessions: London Open (2–5 AM EST) and New York Open (7–10 AM EST).
These times concentrate order flow, creating high-probability moves.
Smart Money hunts liquidity at those hours, not randomly.
Example: During London Open, stops above Asian range = liquidity target.
New York session often sweeps London highs/lows before real move.
Thus, timing tells us when liquidity will likely be attacked.
"Liquidity on time" = confluence of where liquidity sits and when it’s taken.
It explains why moves often happen at precise clock times, not anytime.
Traders use it to avoid chasing price outside killzones.
ICT emphasizes “time & price” must agree for valid setups.
Price alone is incomplete; time confirms when Smart Money acts.
This prevents overtrading in quiet hours.
Example setup: Liquidity sweep at 9:30 AM NYSE open → entry trigger.
Liquidity on time also explains engineered stops runs before news.
The concept ties into Killzones, FVGs, and SMT divergence.
In short, Liquidity on Time = knowing WHEN liquidity will be raided.
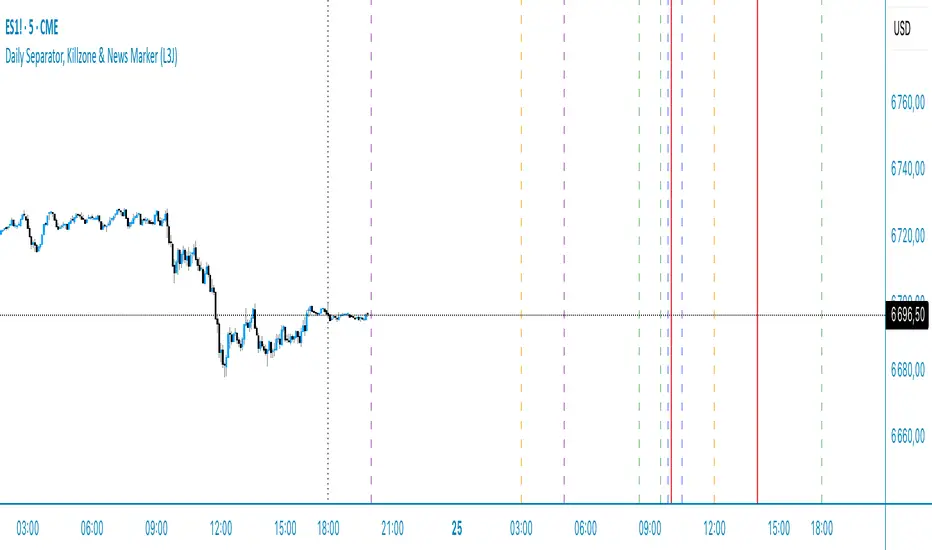
Daily Separator & Killzone marker (L3J)The “Daily Separator (L3J)” is a tool built for day traders who want a clean intraday structure around key U.S. market times and a professional trading-day model. It visually segments trading days, marks critical intraday timestamps (pre-market, cash open, killzone), and aligns with routines inspired by ICT concepts.
Important note: internal code comments and notes are written in French.
What the script does
Draws clear, configurable vertical lines to separate each trading day.
Supports two trading-day models:
- CME 18:00–17:00 (anchored on the Asian session, common for indices/futures)
- Calendar 00:00–23:59 (midnight-to-midnight)
Plots four key intraday rays in UTC‑4:
- 08:30 — U.S. pre-market open
- 09:30 — U.S. cash market open
- 09:50 — killzone start (per my routine)
- 10:30 — killzone end (per my routine)
Smart display logic: each day’s marker stays visible until the time is reached, then auto-hides to keep charts clean.
Object-budget control: caps the number of historical separators to preserve performance.
Day trading strengths (ICT-friendly)
Robust CME anchoring: day switches at the Asian session start in UTC‑4, which better reflects U.S. liquidity flow than calendar midnight.
Focused killzone: highlights 09:50–10:30 for impulse setups, rebalancing, and liquidity events around the open.
Clean readability: fully customizable colors, styles, and widths; markers auto-remove after their window.
Inputs (end‑user labels in French)
- Timezone: choose the time zone (default UTC‑4) for session alignment.
- Day separator:
- Day type: “CME 18:00–17:00” or “Calendrier 00:00–23:59”
- Color, style (solid, dashed, dotted), width
- Max number of visible separators (performance control)
Session (CME): Asian session window used as the anchor (default 18:00–16:00 UTC‑4)
ndependent intraday markers:
- Pre‑Market Open 08:30
- Market Open 09:30
- Killzone Open 09:50
- Killzone Close 10:30
- Each with show/hide, color, style, and width settings
Best practices
U.S. indices ( CME_MINI:ES1! , CME_MINI:NQ1! ) and U.S. equities: favor the “CME 18:00–17:00” mode for a more liquidity‑centric read.
ICT day trading: form directional bias around 09:30, execute between 09:50–10:30 as initial volatility structures.
Multi‑timeframe use: keep it on execution charts (1–5 min) and context charts (15–60 min) for time alignment.
Technical notes
Created by L3J.
Pine Script v6, overlay=true, controlled object budget.
Deterministic time calculations via Pine built‑ins.
All times are expressed in UTC‑4 to align with U.S. practice; adjust the timezone input as needed.
- Internal code comments/notes are written in French.
If this script helps you structure your sessions better, consider leaving a like and sharing it with other intraday traders.
Happy trading, everyone!
TrueOpens [AY]¹ See how price reacts to key multi-day and monthly open levels—perfect for S/R-focused traders.
Experimental indicator for tracking multi-day openings and ICT True Month Open levels, ideal for S/R traders.
TrueOpens ¹ – Multi-Day & True Month Open Levels
This indicator is experimental and designed to help traders visually track opening price levels across multiple days, along with the ICT True Month Open (TMO).
Key Features:
Supports up to 12 configurable multi-day opening sessions, each with independent color, style, width, and label options.
Automatically detects the True Month Open using the ICT method (2nd Monday of each month) and plots it on the chart.
Lines can extend dynamically and are limited to a user-defined number of historical bars for clarity.
Fully customizable timezones, label sizes, and display options.
This indicator is ideal for observing how price interacts with key levels, especially for traders who favor support and resistance-based strategies.
Disclaimer: This is an analytical tool for observation purposes. It does not provide buy or sell signals. Users should combine it with their own analysis and risk management.

Weekly Range ProjectionsWeekly Range Projections
Inspired by toodegrees' excellent "ICT Friday's Asian Range" indicator
This indicator is a modified and enhanced version of the original Friday's Asian Range indicator created by toodegrees. While studying their brilliant work, I realized the concept could be expanded beyond just Friday's Asian session to create a more versatile tool for weekly price projections.
What's New?
I've transformed the original concept into a fully customizable range projection tool that allows traders to:
Select Any Day of the Week - Not limited to just Fridays anymore
Define Custom Time Ranges - Set your own start and end times to capture any session (Asian, London, New York, or custom ranges)
Flexible Deviation Levels - Choose between 1-9 standard deviations instead of the fixed 5
Toggle Body/Wick Ranges - Show or hide body and wick projections independently
Updated to Pine Script v6 - Taking advantage of the latest Pine Script features
How It Works
The indicator captures the price range (body and/or wick) during your specified time window on your chosen day, then projects standard deviation levels from that range. These levels often act as significant support/resistance throughout the week.
Use Cases
Weekly Opening Range - Capture Monday's opening range for week-long projections
Session-Based Analysis - Define any session on any day for targeted analysis
Multi-Timeframe Projections - Create different instances for various time ranges
ICT Concepts - Perfect for traders following ICT methodologies with customizable ranges
Credits
Huge thanks to toodegrees for creating the original Friday's Asian Range indicator and sharing it with the community. Their clean code structure and innovative approach to range projections inspired this modification. The core logic and visual presentation style remain true to their original vision, with added flexibility for broader applications.
If you find this useful, please also check out toodegrees' original indicators - they create fantastic tools for the TradingView community!
Settings Guide
Range Settings - Choose your day and define start/end times
Range Type - Toggle body and/or wick ranges
Deviations - Select how many standard deviation levels to display
Styling - Customize colors and line styles for both range types
Alerts - Set up alerts for price crossing specific deviation levels
Remember to use this on 5-minute or 15-minute charts as intended by the original design.
Note: This indicator follows the Mozilla Public License 2.0

Checklist Dashboard Table# Checklist Dashboard Table – ICT/SMC Trading Helper
Overview
The “Checklist Dashboard Table” is a TradingView indicator designed to help traders structure, organize, and validate their market analyses following the ICT/SMC (Inner Circle Trader / Smart Money Concepts) methodology. It provides a visual and interactive checklist directly on your chart, ensuring you never miss a crucial step in your decision-making process.
Key Features
- Visual Checklist : All your trading criteria are displayed as color-coded checkboxes (green for validated, red for not validated), making your analysis process both clear and efficient.
- Clear Separation Between Analysis and Confirmations :
- Analysis : Reminders for your routine, such as timeframe selection (M3 to H4), trend analysis via RSI, and identification of key zones (Midnight Open, SSL/BSL, Asian High/Low).
- Confirmations : Six customizable criteria to check off as you validate your setup (clear trend, OB + FVG, OTE zone, Premium/Discount, R/R > 1:2, CBDR/Midnight).
- Personal Notes Section : Keep your trade entries, observations, or comments in a dedicated field in the indicator’s settings. Your notes are displayed right in the checklist for quick reference and journaling.
- Elegant and Compact Display : The table is styled for readability and can be positioned anywhere on your chart.
- Quick Customization : Instantly update any criterion or your personal notes via the script settings.
How to Use
1. Add the indicator to your chart.
2. Review the “Analysis” section as your pre-trade routine reminder.
3. Check off the “Confirmations” criteria as you validate your entry strategy.
4. Write your trade notes or comments in the provided notes section.
5. Use the checklist to reinforce discipline and repeatability in your trading.
Why Use This Checklist?
- Prevents you from skipping important steps in your analysis.
- Reinforces trading discipline and consistency.
- Allows you to document and review your trade decisions for ongoing improvement.
Who Is It For?
Perfect for ICT/SMC traders, but also valuable for anyone looking to organize and systematize their trading process.
Happy trading!

First FVG📘 Indicator Description (English)
First FVG – NY Open is a TradingView indicator designed to automatically identify the first Fair Value Gap (FVG) that appears during the New York session, following the ICT (Inner Circle Trader) methodology.
It highlights institutional inefficiencies in price caused by imbalanced price action and helps traders spot high-probability entry zones, especially after the 9:30 AM EST (New York Open).
⚙️ How It Works
Session time: The indicator scans for FVGs starting at 9:32 AM (allowing 3 candles after the NY Open to form).
FVG Conditions:
Bullish FVG: When the high of 2 candles ago is lower than the low of the current candle and the middle candle is bullish.
Bearish FVG: When the low of 2 candles ago is higher than the high of the current candle and the middle candle is bearish.
Only the first FVG per session is drawn, as taught by ICT for setups like Judas Swing or NY Reversal models.
A colored box is drawn to represent the FVG zone.
A dotted horizontal line (CE) is drawn at the midpoint of the FVG box (Consequent Encroachment), a key level watched by smart money traders.
A dashed vertical line is drawn at 9:30 NY time to mark the open.
🧠 How to Use It
Wait for the NY Open (9:30 AM EST) – the indicator becomes active at 9:32 AM.
Watch for the first FVG box of the day. This is often a high-probability reaction zone.
Use the CE line (center of the FVG) as a reference for entries, rejections, or liquidity grabs.
Combine with market structure, PD Arrays, and liquidity concepts as taught by ICT for confluence.
The FVG box and CE line will extend forward for several candles for visual clarity.
🎛️ Customizable Settings
Session time (default: 09:32–16:00 NY)
FVG box color (up/down)
Text color
Max number of days to keep boxes on chart
Option to show or hide the 9:30 NY Open vertical line

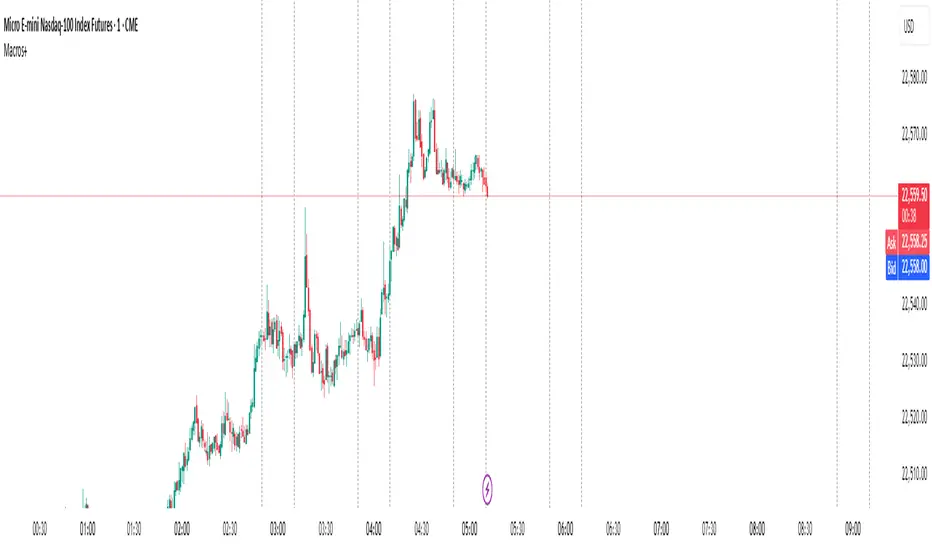
Predictive Time & AlertsPredictive Time Engine (ICT Macros)
Summary
The Predictive Time Engine is a visual tool designed specifically for traders who utilize Time & Price based methodologies, particularly those inspired by ICT (Inner Circle Trader) concepts.
The primary purpose of this indicator is to visualize the critical "time windows" where market liquidity is most likely to be significantly manipulated or distributed. Instead of only appearing in real-time, this indicator is predictive: at the beginning of each day, it will automatically calculate and draw all selected macro sessions for the day ahead, serving as your daily time roadmap.
With this tool, you will no longer miss these crucial moments and can be better prepared to anticipate price action.
Key Features
Predictive Visualization: Automatically projects and draws all macro time windows for the current trading day, giving you a forward-looking view of where the action is likely to occur.
ICT Macro Time Filter: Based on the "Hourly-Macros" concept, which are specific 20-minute periods within each hour (e.g., 09:50 - 10:10) where the price delivery algorithm (IPDA) is often active. You can select and enable each macro window you wish to monitor.
Full Customization: You have complete control over how the information is displayed. Choose between:
Outline: A clean, transparent box frame.
Background: A solid, colored background for the time zone.
Vertical Lines (Dotted, Dashed, Solid): Marks the beginning of each macro session with a vertical line in your chosen style.
Real-time Alerts: Set up notifications in TradingView to get an alert precisely when the price enters one of your selected Macro Time windows.
Automatic Management: Drawings from previous days are automatically cleared to keep your chart clean and focused on the current day's schedule.
The Concept Behind the Indicator
This indicator is inspired by the concept that the market moves in fractal Time Cycles, from yearly down to 90-minute periods. Each of these time cycles often follows a pattern of AMD (Accumulation, Manipulation, Distribution).
Accumulation: A phase of order gathering.
Manipulation: Price is often driven in the opposite direction of its true intent to sweep liquidity (stop losses).
Distribution: The true price move towards a liquidity target (Draw On Liquidity).
The Macro Time windows marked by this indicator are often the stage where the Manipulation phase or the beginning of the Distribution phase occurs. By knowing when these times are approaching, traders can be on high alert and look for confirming trade setups in the most potent areas and times.
How to Use
Configure Sessions: Open the indicator's Settings.
In the "1. General Settings" tab, ensure the Timezone matches your chart's local time (Default: "America/New_York").
In the "2. Active Macro Sessions" tab, check the box for each macro time window you want to monitor.
Choose Display Style: In "General Settings", select your preferred "Display Style" (Outline, Background, or various Line types). You can also change the color.
Set Up Alerts (Optional):
Click the "Alert" clock icon in the TradingView toolbar.
In the "Condition" section, select this indicator: Predictive Time Engine.
From the dropdown below it, ensure "Sesi Makro Dimulai" (Macro Session Start) is selected.
Set your desired notification options and click "Create".
Chart Interpretation: Use the marked time zones as high-alert areas. Pay close attention to how price reacts when entering or leaving these zones to find potential entry opportunities that align with your trading strategy.
Disclaimer: This tool is provided for educational and analytical purposes only. It is not financial advice. All trading decisions are solely your responsibility. Conduct your own research and manage your risk appropriately.
[TehThomas] - Market Structure Shift (MSS)
- Market Structure Shift (MSS) Script Overview
This TradingView script is designed to help traders identify Market Structure Shifts (MSS) and Breaks of Structure (BOS), which are key concepts in ICT (Inner Circle Trader) and Smart Money Concepts (SMC) trading. By detecting significant shifts in price action, the script provides visual cues and alerts to help traders spot potential trend changes and continuation patterns.
How the Script Works
1. Identifying Swing Highs & Lows
The script detects swing highs and swing lows based on a pivot strength setting (default: 3).
A swing high forms when a candle’s high is higher than the highs of a set number of candles on both sides.
A swing low forms when a candle’s low is lower than the lows of the surrounding candles.
2. Market Structure Shift (MSS) Detection
A bullish MSS occurs when price closes above the most recent swing high after previously being in a bearish trend.
A bearish MSS occurs when price closes below the most recent swing low after being in a bullish trend.
This signals a potential trend reversal and is often a key area for liquidity grabs and smart money entry points.
3. Break of Structure (BOS) Detection (Optional - Can be enabled/disabled in settings)
A BOS is detected when price continues in the direction of the trend, confirming a structural break rather than a shift.
Bullish BOS: Price breaks a swing high but does not reverse (confirms trend continuation).
Bearish BOS: Price breaks a swing low but continues downward.
BOS levels help traders confirm trend strength and potential trade continuation setups.
4. Drawing Structure Lines & Labels
The script plots horizontal lines at the detected MSS and BOS levels.
Labels such as "MSS" or "BOS" appear at the breakout points.
Traders can customize the line style, color, and text size for better visibility.
5. Alert System for MSS & BOS
The script includes alert conditions that notify traders when an MSS or BOS occurs.
Alerts can be set for:
Any MSS / Any BOS
Bullish MSS / Bullish BOS
Bearish MSS / Bearish BOS
Settings You Can Change
The script allows for full customization through the following input parameters:
Pivot Strength (pivot_strength)
Default: 4
Adjusts how many candles must be considered to form a valid swing high or low.
Higher values result in stronger structure points, while lower values detect short-term movements.
Color Settings
Highs Color (highs) → Default: Blue (for bullish structure)
Lows Color (lows) → Default: Red (for bearish structure)
Toggle Display Options
Show BOS (show_bos) → Enables/disables BOS detection.
Show MSS (show_mss) → Enables/disables MSS detection.
Line & Label Customization
BOS Line Style (bos_style) → Options: Solid, Dashed, Dotted
MSS Line Style (mss_style) → Options: Solid, Dashed, Dotted
BOS & MSS Line Width → Adjustable from 1 to 4 pixels
BOS & MSS Text Size → Options: Tiny, Small, Normal, Large, Huge
BOS & MSS Text Position → Options: Left, Center, Right
Why This Script is Useful
✔ Detects Key Market Structure Changes
MSS and BOS are critical for identifying trend reversals and trend continuations.
Helps traders avoid false breakouts by distinguishing between structural shifts and simple breakouts.
✔ Enhances Smart Money Trading Strategies
MSS often aligns with liquidity grabs before price reverses.
BOS confirms continuation trades in strong trends.
Works well with Fair Value Gaps (FVGs), Order Blocks (OBs), and Liquidity Zones.
✔ Customizable Alerts & Visuals
Traders can enable alerts for MSS and BOS to receive notifications when price shifts.
Adjustable styling ensures clarity across different trading setups.
✔ Works on Any Asset & Timeframe
Suitable for Forex, Crypto, Stocks, and Indices.
Can be used on lower timeframes (scalping) or higher timeframes (swing trading).
How to Use the Market Structure Shift Concept in Trading
1️⃣ Identify Market Conditions
Apply the script and check if price is forming Higher Highs (HH), Higher Lows (HL), Lower Highs (LH), or Lower Lows (LL).
Determine if the market is trending or ranging.
2️⃣ Watch for MSS (Reversal Signals)
Bullish MSS: Price closes above a key swing high → potential bullish reversal.
Bearish MSS: Price closes below a swing low → potential bearish reversal.
3️⃣ Confirm BOS (Trend Continuation Signals)
Bullish BOS: Price continues breaking highs, confirming an uptrend.
Bearish BOS: Price continues breaking lows, confirming a downtrend.
4️⃣ Combine with Other ICT & SMC Concepts
Look for Order Blocks (OBs) and Fair Value Gaps (FVGs) near MSS/BOS levels for better trade entries.
Wait for liquidity grabs before entering trades (avoid stop hunts).
Use higher timeframe MSS/BOS zones as key support & resistance areas.
Final Thoughts
This script is a must-have tool for traders using ICT & SMC trading strategies. It helps identify trend shifts, liquidity grabs, and continuation moves by marking Market Structure Shifts (MSS) and Breaks of Structure (BOS) on the chart.

OHLC, Sessions & Key Levels [Orderflowing]Multi-Timeframe (+) OHLC, Sessions & Key Levels | Custom-Timeframe OHLC | Sessions Analysis | Market Key Levels
Built using Pine Script V5.
Introduction
The OHLC, Sessions & Key Levels Indicator is a tool designed for traders who want to integrate Multi-Timeframe (MTF) OHLC Data, Sessions Analysis, and Key Market Levels into their trading system.
This Indicator can help traders by automatically marking the OHLC, Sessions & Key Levels directly on the price chart, saving time furthermore potentially allowing for better judgement in their trading and risk management process.
Innovation and Inspiration
The Indicator draws from multiple concepts;
The OHLC levels across different timeframes, session-based analysis, and plotting potentially important and pivotal market levels.
Concept Inspiration from ICT-Traders / Market Maker Model Traders.
Use of Open-Source Code
Specific parts of this Indicator's code have been inspired by & further developed from publicly available code originally developed for the MetaTrader platform.
All such integrations have been wired to work within the TradingView environment, specifically using Pine Script Version 5.
Elements have been made to benefit the overall functionality, the code logic, to make sure it offers unique value to TradingView's users.
Core Features
OHLC MTF Analysis
Foundation
This component allows traders to track the Open, High, Low, and Close levels across different timeframes, ranging from intraday periods to yearly data.
Customization
Traders can adjust the bar offset, width, and colors of the OHLC bars, as well as display options. Option to highlight the Open/Close with labels and the High/Low with marks.
Application
The OHLC MTF component gives traders a clear view of important price levels, which can serve as support, resistance, or potential entry/exit points.
Main Trading Sessions & Custom Sessions
Starting Point
The Sessions component relies on the user-inputted key market sessions, defaults include New York, London, Asia, and optionally Sydney. Session Defaults to UTC.
Please Note: Adjust Time Zone in TradingView's Desktop App or Web Interface to use the sessions in correct local time.
Customization
Traders can adjust session names, session times, time zone, visibility, session colors, and session-specific high and low markers.
This allows us to visualize price movements during these selected periods.
Application
By highlighting different trading sessions, traders can potentially better time their trades, understanding when significant price movements usually occur. This can potentially be used to try and find patterns in a time-based method.
Key Levels
Customization
Traders can choose which key levels to display and adjust the visual style of these levels, including line width, style, and color.
Application
The Key Levels feature can help traders identify support and resistance levels that can serve as potential entry or exit points. Can be useful in market structure analysis by marking significant price levels based on different timeframes.
Designed for multi-timeframe analysis, allowing traders to track OHLC levels, session ranges, and key market levels.
It’s highly customizable, making it suitable across trading styles and charting setups, whether scalping, day trading, swing trading or longer term investing.
Multi-Timeframe (MTF) OHLC
Can be plotted as a Candlestick or Bar-Chart or Both
These can help traders keep an eye on price levels across multiple timeframes while allowing the actual chart to be on another timeframe than the displayed OHLC.
Example - OHLC on the Weekly Candle/Bar - Chart 4 Hourly Candles
While being on lower timeframes, the trader can keep an eye on how the OHLC candle is developing. ICT-Traders find the Daily (Default Setting) OHLC useful in analysis.
It can be customized to any timeframe the trader wishes to use.
Inspired by ICT-Traders / Market Maker Model Traders and Top-Down Analysis Style.
Combined with Session Analysis to view into the price behavior during specific trading sessions, could potentially be very useful for finding trading setups.
OHLC Levels
Creates lines based on user input - Can potentially be important reference points for trade setups / invalidation / confirmation, levels could be used as the HTF Origin.
Conclusion
The OHLC MTF, Sessions & Key Levels Indicator is a tool that combines multiple market analysis concepts into a single unique script. It offers another view of the market's behavior by combining OHLC data from a different timeframe, main trading sessions, and key levels.
Why Invite-Only?
The OHLC, Sessions & Key Levels Indicator is offered as invite-only because you receive a quality and customizable tool that combines multiple functions into one convenient script.
This Indicator stands out by being a complete and optimized trading tool based on three desirable components.
—
Multi-Timeframe OHLC Analysis, Sessions Tracking & Key Levels
—
Into One Customizable Indicator.
Disclaimer
While the Indicator offers a view of the OHLC price action on multiple timeframes, key levels & trading sessions, traders should not solely rely on it for trading decisions. As with all trading tools, it should be used as part of a complete trading strategy.

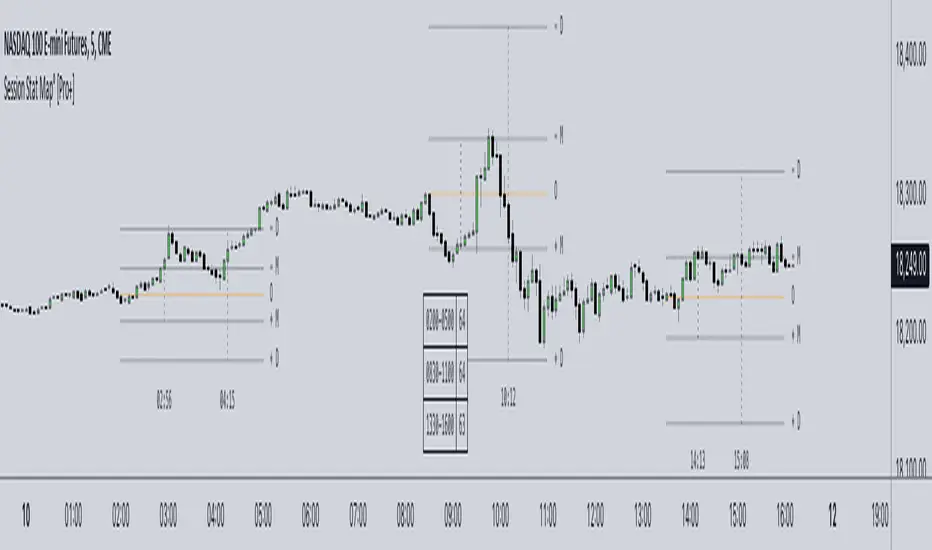
Session Statistical Mapping° [Pro+] (Joshuuu)Introduction:
Dive into the dynamic world of statistical market analysis with Session Statistical Mapping Pro+, an advanced tool designed for intraday traders of all asset classes.
Description:
This indicator offers a detailed algorithmic statistical measurement of Time and price, integrating the principles of Inner Circle Trader (ICT) to analyze the market behaviours such as Manipulation, and Distribution. This tool supercharges your trading strategies with data-driven insights.
ICT traders classify manipulation as a movement to trap market participants in the "wrong" direction. This allows analysts to anticipate the intended real direction of the distribution phase.
On the other hand, when price distributes, it's looking to expand for higher – or lower – prices. Analysts can therefore note distribution levels for a draw on liquidity, retracement, or reversal.
These levels and the Time at which they are reached during the selected session, will provide important information about orderflow when price trades through them and the sequence in which the delivery occurs.
Additionally, to amplify the price mapping, this tool plots the average Time at which its manipulation and distribution phases should complete. This feature allows traders to utilize historical Timings in conjunction with the price levels of manipulation and distribution.
As with any historical data driven tool, analysts should not expect past behaviour to match future performance. This tool was created with a data driven edge to bring attention to when sessions are likely to turn after their manipulations, or retrace after completing set distributions.
Key Features:
Algorithmic Measurement of Price: Leverage algorithmic theory to measure price movements with precision. This tool calculates average session manipulation and distribution price levels, providing traders with actionable insights based on historical data – key manipulation and distribution levels.
Algorithmic Measurement of Time: Utilize algorithmic theory to measure time-based movements within specific sessions. This tool calculates the projected average Time at which the manipulation and distribution phases are completed during a given session. This feature enhances traders' ability to interpret market movements and align their strategies with Time data.
Four Sessions Times: Customize up to four Time ranges to focus on specific trading sessions, such as the European, US, or Asian market sessions. This allows traders to align their analysis with the operational hours of major market participants, capturing the most relevant price movements. Traders can also create unique sessions based on their trading Time to study market behaviour when they usually operate in the markets – unlocking a level of understanding towards their personal backtested model and strategies.
Flexible Calculation: The sample size of the sessions can be set to a specific number – the default is 1000. This allows traders to adjust the depth of historical data used in their analysis, balancing detail and performance.
Further Customization:
Custom Appearance: Adjust the style of session lines with options like dotted, solid, and various colors. This helps traders visually distinguish between different types of market activities (e.g., Open, Manipulation, Distribution) on their charts.
Lookback Periods: Option to show available lookback periods for a deeper historical analysis, providing context and historical benchmarks for current market conditions.
Extended Visualization: Pre-extend lines until session close for better visualization of market phases. This helps traders see the continuation of trends and market behaviours beyond the immediate session.
Clean Chart Layout: Options to delete old labels and abbreviate labels maintain a clean and organized chart, enhancing readability and focus.
Conclusion
By incorporating algorithmic theory Time and price measurements, historical data insights, and the principles of Inner Circle Trader (ICT), this indicator offers a comprehensive approach to understanding market behaviour. Whether you're analyzing price patterns, timing market movements, or combining both, Session Statistical Mapping Pro+ equips you with the potential roadmap of an asset, allowing you to navigate the complexities of the market’s volatility.
Usage Guidance:
Add Session Statistical Mapping Pro to your Tradingview chart.
Choose up to 4 sessions for the mapping to plot on your chart, be sure to adjust your style and visual preferences to differentiate the sessions’ levels.
Observe how calculated manipulation, distributions, and delivery times align together with predetermined analysis.
Leverage this information with other models and insights to create a stronger narrative for your analysis.
These tools are available ONLY on the TradingView platform.
Terms and Conditions
Our charting tools are products provided for informational and educational purposes only and do not constitute financial, investment, or trading advice. Our charting tools are not designed to predict market movements or provide specific recommendations. Users should be aware that past performance is not indicative of future results and should not be relied upon for making financial decisions. By using our charting tools, the purchaser agrees that the seller and the creator are not responsible for any decisions made based on the information provided by these charting tools. The purchaser assumes full responsibility and liability for any actions taken and the consequences thereof, including any loss of money or investments that may occur as a result of using these products. Hence, by purchasing these charting tools, the customer accepts and acknowledges that the seller and the creator are not liable nor responsible for any unwanted outcome that arises from the development, the sale, or the use of these products. Finally, the purchaser indemnifies the seller from any and all liability. If the purchaser was invited through the Friends and Family Program, they acknowledge that the provided discount code only applies to the first initial purchase of the Toodegrees Premium Suite subscription. The purchaser is therefore responsible for cancelling – or requesting to cancel – their subscription in the event that they do not wish to continue using the product at full retail price. If the purchaser no longer wishes to use the products, they must unsubscribe from the membership service, if applicable. We hold no reimbursement, refund, or chargeback policy. Once these Terms and Conditions are accepted by the Customer, before purchase, no reimbursements, refunds or chargebacks will be provided under any circumstances.
By continuing to use these charting tools, the user acknowledges and agrees to the Terms and Conditions outlined in this legal disclaimer.
Skrip berbayar
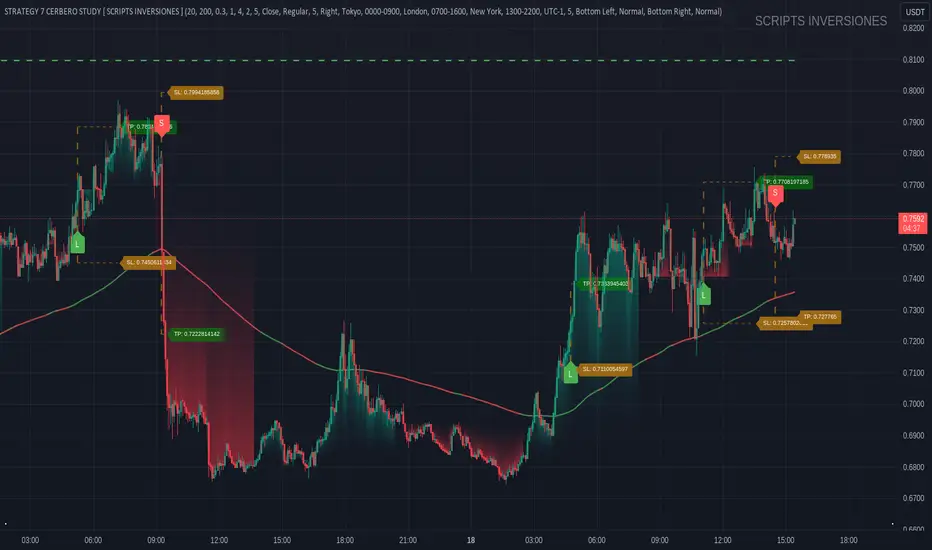
STRATEGY 7 CERBERO STUDY [ SCRIPTS INVERSIONES ]USE:
ADXCONFIG:
Purpose: Select the range for the strength required in the ADX for our alert condition. This setting allows traders to define the threshold at which the ADX indicates sufficient market momentum for trading decisions.
USETRENDLOGIC:
Function: Utilizes the trend EMA to make long entries when the price is above and short entries when it is below the EMA. This provides a simple, clear rule based on the relative position of the price to the EMA, facilitating trend-following strategies.
SELECT A VALUE FOR EMA:
Description: Choose the range for the EMA, and the alert conditions will be applied depending on whether the price is above or below when USETRENDLOGIC is activated. This allows for flexibility in setting the sensitivity of the EMA to price movements.
ACTIVATE/DEACTIVATE EMA 35 AND EMA 50:
Usage: These EMAs are used to determine the trend in shorter periods of time, providing traders with quick insights into market dynamics and potential trend shifts.
LOGIC 1:
ENABLE/DEACTIVATE STRATEGY 1/1:
Conditions: If the 1/1 strategy is activated, it will use the following setup:
Volume entry + EMA condition + BREAK
ADX > ADXCONF
DMI+/DMI- higher depending on the trend
Explanation: This strategy combines volume analysis with EMA and trend indicators to identify strong, actionable trading signals.
This image shows its use.
LOGIC 2:
ENABLE/DEACTIVATE STRATEGY 1/2:
Conditions: If the 1/2 strategy is activated, it utilizes:
Volume entry + EMA condition + BREAK
Purpose: Focuses on significant breaks in EMA levels with accompanying high volume, suggesting a strong momentum-backed entry point.
This image shows its use.
LOGIC 3:
ENABLE/DEACTIVATE STRATEGY 1/3:
Conditions: If the 1/3 strategy is activated, it involves:
Volume entry + EMA condition
RSI
ADX > ADXCONF and DMI+/DMI- higher depending on the trend
Utility: Combines volume, EMA, and RSI indicators with ADX strength to filter entries during extreme market conditions, enhancing the probability of capturing significant moves.
This image shows its use.
LOGIC 4:
ENABLE/DEACTIVATE STRATEGY 1/4:
Conditions: If the 1/4 strategy is activated, it incorporates:
Volume entry + EMA condition
RSI ABOVE/BELOW your EMA
Application: This strategy uses RSI levels in relation to an EMA to fine-tune entry points, helping to confirm momentum before entering trades.
This image shows its use.
LOGIC 5:
ENABLE/DEACTIVATE STRATEGY 1/5:
Conditions: If the 1/5 strategy is activated, it utilizes:
Volume entry + EMA condition
Function: A straightforward strategy that uses volume and EMA conditions to identify primary entry points, focusing on the basic elements of trend and momentum.
This image shows its use.
POI LOGIC (Point of Interest)
Activate/Deactivate 2/1 POI Strategy
When the 2/1 POI strategy is activated, it employs the following conditions to determine market entries:
Volume Entry + EMA Condition + POI TOUCHED + ADX > ADXCONF and DMI+/DMI- higher depending on the trend:
Volume Entry: Looks for significant volume as confirmation that there is enough interest at the current price level.
EMA Condition: A specific condition regarding the Exponential Moving Average (EMA) must be met, such as the price being above or below the EMA, depending on the anticipated direction of price movement.
POI Touched: The price must have touched a previously identified Point of Interest, indicating a level where the price has reacted before.
ADX > ADXCONF: The Average Directional Movement Index (ADX) must be greater than a set value (ADXCONF), indicating sufficient trend strength.
DMI+/DMI- higher depending on the trend: The Directional Movement Indicator Plus (DMI+) or Minus (DMI-) needs to be higher, depending on whether the trend is bullish or bearish, respectively.
This strategy is designed to capitalize on price levels where the market has shown previous reactions, using a combination of technical analysis and volume to confirm entry signals.
This image shows its use.
DIVERGENCE LOGIC
Activate/Deactivate Divergence Strategy
When the divergence strategy is activated, it employs the following conditions for making trading decisions:
Volume Entry + Divergence: This condition indicates that a market entry should be considered when there is a divergence between the price and a technical indicator (such as RSI, MACD, etc.), accompanied by significant volume.
Divergence occurs when the price of an asset moves in the opposite direction of the technical indicator, which may suggest a potential reversal in market trends. Volume plays a crucial role here, as high volume during a divergence can confirm the strength of the potential trend reversal.
This strategy aims to capitalize on moments when the market shows signs of exhaustion in a trend and is potentially gearing up to reverse, making divergences a key component in anticipating significant movements.
This image shows its use.
FOREX LOGIC
Activate/Deactivate FOREX Strategy
When the Forex strategy is activated, it uses the following conditions to execute trades:
Volume Entry + DI+ > DI- for long entries: This condition means that to consider a long position (buy), the Positive Directional Indicator (DI+) must be greater than the Negative Directional Indicator (DI-). This suggests that the market trend is moving upward, supported by sufficient trading volume backing this direction.
DI- > DI+ for short entries: For short entries (sells), the required condition is that the DI- (Negative Directional Indicator) is greater than the DI+ (Positive Directional Indicator). This indicates that the market trend is downward and that there is adequate volume confirming this bearish trend.
These conditions ensure that market entries are made with a clear confirmation of market direction based on volume and directional movement, which is crucial for increasing the probabilities of successful Forex trades.
This image shows its use.
ICT STUDY
Activate/Deactivate Strategy ICT
USAGE:
We use all these components in our indicator to provide comprehensive and effective control when trading using the ICT (Inner Circle Trader) methodology. Each element aids in visualizing and anticipating market movements more accurately, facilitating informed and strategic decision-making.
POI (Point of Interest): Used to identify critical points where the market has shown significant past activity, offering clues on potential future price reactions.
Imbalances: Crucial for spotting areas where supply or demand has been lacking, suggesting potential entry or exit points based on trend reversal or continuation.
ZigZag: Helps to eliminate market noise, allowing for clear identification of significant highs and lows, vital for trend analysis and reversal.
Supports and Resistances: Fundamental in determining price levels at which the market might stop or reverse, essential for any trading strategy.
Fibonacci: Utilized to find support and resistance levels based on mathematical proportions that naturally occur in markets, informing potential areas of interest.
Inducement: We observe these patterns to identify moments when price manipulations might be occurring, helping to avoid traps and enhance entries.
Sweep: Analyzed to understand how and where major market players are clearing accumulated orders, which can indicate significant price movements.
CHOCH (Change of Character): Used to detect a shift in price behavior, which may signal a reversal or trend change.
BOS (Break of Structure): Key for detecting when the price breaks through significant structures, suggesting changes in market direction.
Forecasting Length: Determines how far the price may reach into the future based on current analysis, crucial for planning long-term trades.
This image shows its use.
IF USE TP AND SL
IPDA Standard Deviations [DexterLab x TFO x toodegrees]> Introduction and Acknowledgements
The IPDA Standard Deviations tool encompasses the Time and price relationship as studied by @TraderDext3r .
I am not the creator of this Theory, and I do not hold the answers to all the questions you may have; I suggest you to study it from Dexter's tweets, videos, and material.
This tool was born from a collaboration between @TraderDext3r, @tradeforopp and I, with the objective of bringing a comprehensive IPDA Standard Deviations tool to Tradingview.
> Tool Description
This is purely a graphical aid for traders to be able to quickly determine Fractal IPDA Time Windows, and trace the potential Standard Deviations of the moves at their respective high and low extremes.
The disruptive value of this tool is that it allows traders to save Time by automatically adapting the Time Windows based on the current chart's Timeframe, as well as providing customizations to filter and focus on the appropriate Standard Deviations.
> IPDA Standard Deviations by TraderDext3r
The underlying idea is based on the Interbank Price Delivery Algorithm's lookback windows on the daily chart as taught by the Inner Circle Trader:
IPDA looks at the past three months of price action to determine how to deliver price in the future.
Additionally, the ICT concept of projecting specific manipulation moves prior to large displacement upwards/downwards is used to navigate and interpret the priorly mentioned displacement move. We pay attention to specific Standard Deviations based on the current environment and overall narrative.
Dexter being one of the most prominent Inner Circle Trader students, harnessed the fractal nature of price to derive fractal IPDA Lookback Time Windows for lower Timeframes, and studied the behaviour of price at specific Deviations.
For Example:
The -1 to -2 area can initiate an algorithmic retracement before continuation.
The -2 to -2.5 area can initiate an algorithmic retracement before continuation, or a Smart Money Reversal.
The -4 area should be seen as the ultimate objective, or the level at which the displacement will slow down.
Given that these ideas stem from ICT's concepts themselves, they are to be used hand in hand with all other ICT Concepts (PD Array Matrix, PO3, Institutional Price Levels, ...).
> Fractal IPDA Time Windows
The IPDA Lookbacks Types identified by Dexter are as follows:
Monthly – 1D Chart: one widow per Month, highlighting the past three Months.
Weekly – 4H to 8H Chart: one window per Week, highlighting the past three Weeks.
Daily – 15m to 1H Chart: one window per Day, highlighting the past three Days.
Intraday – 1m to 5m Chart: one window per 4 Hours highlighting the past 12 Hours.
Inside these three respective Time Windows, the extreme High and Low will be identified, as well as the prior opposing short term market structure point. These represent the anchors for the Standard Deviation Projections.
> Tool Settings
The User is able to plot any type of Standard Deviation they want by inputting them in the settings, in their own line of the text box. They will always be plotted from the Time Windows extremes.
As previously mentioned, the User is also able to define their own Timeframe intervals for the respective IPDA Lookback Types. The specific Timeframes on which the different Lookback Types are plotted are edge-inclusive. In case of an overlap, the higher Timeframe Lookback will be prioritized.
Finally the User is able to filter and remove Standard Deviations in two ways:
"Remove Once Invalidated" will automatically delete a Deviation once its outer anchor extreme is traded through.
Manual Toggles will allow to remove the Upward or Downward Deviation of each Time Window at the discretion of the User.
Major shoutout to Dexter and TFO for their Time, it was a pleasure to collaborate and create this tool with them.
GLGT!

TTF SMC ToolkitGreetings and welcome to another community indicator from TTF! This indicator is our attempt to build a suite of tools for use in Smart Money Concepts (SMC) and Price Action style trading strategies. If you aren't familiar with these models, we'd encourage you to do some independent research on them to find out how to properly use these models and the tools included in this indicator.
Important! To utilize all features of this indicator fully, please select "Bring to front" under the visual order menu.
All of the fundamental concepts of this toolkit revolve around smart money concepts and price action trading, here are some key concepts of this indicator's different features:
DR (defining range): This is a technique that uses the candle wicks (high and low of price) during a specific hour of a trading session to create a trading framework to help visualize order flow. When price breaks the high of the range, there is a very high statistical probability based on price action history, that the bottom of the range won't be traded past for the rest of that trading session. Vice versa for price breaking the low of the range.
IDR (implied defining range): Similar to DR above, this method uses the candle body (open and close of price) of price during a specific hour of a trading session to help create a trading framework to help visualize order flow.
Equilibrium: Any range can be objectively divided into a top and bottom half. The equilibrium represents the 50% mark between a range high and a range low. It is most often plotted with a fibonacci tool.
Fair Pricing Model: This is a hypothesis postulating that "big money" (a.k.a. "market movers", "institutional investors", etc.) seeks to buy in the discount area of any given price range, and sell in the premium area of that same range. See DR and IDR for examples of possible techniques to help identify and define the price range to apply to this model.
Non-discretionary Levels: This is essentially a fancy way of saying that the levels drawn by this indicator are strictly rules-based, and will always behave in the following manner:
1. For a given trading session, once the levels are drawn, they will remain constant throughout the rest of the trading session, no matter what price does afterwards.
2. The levels drawn will be drawn using the same rules every single day, without human bias or discretion.
Williams Fractals: This fractal pattern is based upon a specific candlestick pattern sequence. For a bullish Williams fractal, you will see X number of falling candles, followed by X number of rising candles. The candle at the fulcrum (bottom or top of the fractal structure) is where the fractal will print. a bearish fractal will be the inverse of this pattern. Note that this is a lagging indicator as it takes X candles after the fulcrum candle for the fractal pattern to complete. In most common cases, the value of X is 2 (2 falling candles, the fulcrum candle, and 2 rising candles) for a total of 5 candles to complete the fractal pattern. You can find more information in this article, which describes this type of fractal: www.investopedia.com
Fractal Wyckoff Accumulation/Distribution: The Wyckoff Method is used by investors and traders to determine market trends, select investments, and time the placement of trades. It can help them identify the times at which big players are accumulating (or distributing) positions in a security. Fractal Wyckoff accumulation/distribution refers to watching the process occur on a lower timeframe, from a higher timeframe. For more information on the Wycoff Theory, you can see this article: www.investopedia.com
Now that we've covered some terms and definitions, let's cover the 4 major components included in this indicator.
ICT NY Midnight/NY Open (08:30 NY time):
The first piece of the indicator being displayed here is the ICT midnight and 8:30am NY price lines. These lines can be used as non-discretionary levels, or as intra-day premium/discount as part of a fair-pricing model.
DR/IDR:
Initially developed by TheMas7er, DR stands for defining range, and it highlights a range during high volume periods of the day that can act as non-discretionary levels, with very high historical accuracy.
Williams Fractals
Williams Fractals denote fractal market structure, and can be used to mechanically create ranges and view potential liquidity pools in a similar manner to using pivot points.
Triple M:
This tool highlights wicks that represent fractal Wyckoff accumulation and distribution. This pattern can be used an a potential entry trigger when paired with other confluences.
And now that we've covered the core concepts/definitions and an overview of each major component of this indicator, it's time to bring everything together by giving an example of how these tools can be used to define a strategy.
Before NYSE open, turn on the price lines to get a sense of whether price is in the premium or discount of the daily fair-pricing model.
Once NYSE market opens, wait for DR/IDR to establish and break its range.
If the bias from DR/IDR aligns with the fair pricing model from the ICT price lines, you could look for a fractal Wyckoff entry during a retracement.
Disclaimer: This strategy is provided purely as an example and has not been tested by us. Please do your own due diligence by thoroughly backtesting and forward-testing on a demo account befor using any proposed strategy live market with real money!
Important! To utilize all features of this indicator fully, please select "Bring to front" under the visual order menu.

NDOG & Dynamic Event Horizon° (Experimental)The ICT concept of New Day Opening Gaps (NDOG) is simply an imbalance that may manifest at Daily Opening time. This gap in price is formed by the Close at 5PM EST and the open at 6PM EST.
According to ICT's studies, this gap in price holds a lot of significance when it comes to price action, acting as a magnet or a point of reference during the day (and following days/weeks).
This script applies the supporting concepts of New Week Opening Gaps (Event Horizon and OTE areas) to NDOGs, mimicking my NWOG & Dynamic Event Horizon° indicator. Equally to the latter, this script dynamically selects the most relevant NDOG Dealing Range and plots their EH and OTE levels automatically.
// Please refer to the NWOG indicator post linked above for more information about these concepts
Available Alerts:
– Cross Below Event Horizon
– Cross Above Event Horizon
– New NDOG Range Established
Important Remarks:
– This is purely an experiment, and has not been taught by ICT publicly in any way. Treat this material accordingly.
– Note that although these work on all timeframes, the lower in resolution one goes, the less gaps will be available due to data availability.
– This indicator works on charts that have the NDOG already present in chart (i.e. no crypto assets, unless one looks at CME crypto futures such as BTC1! and ETH1! ).
– The dollar index's NDOGs have a slightly different timestamp, however this has been taken care of and will allow to be plotted ONLY for the TVC:DXY ticker.
TrandingView struggles to display the indicator correctly for the default view, check out its accurate appearance here:

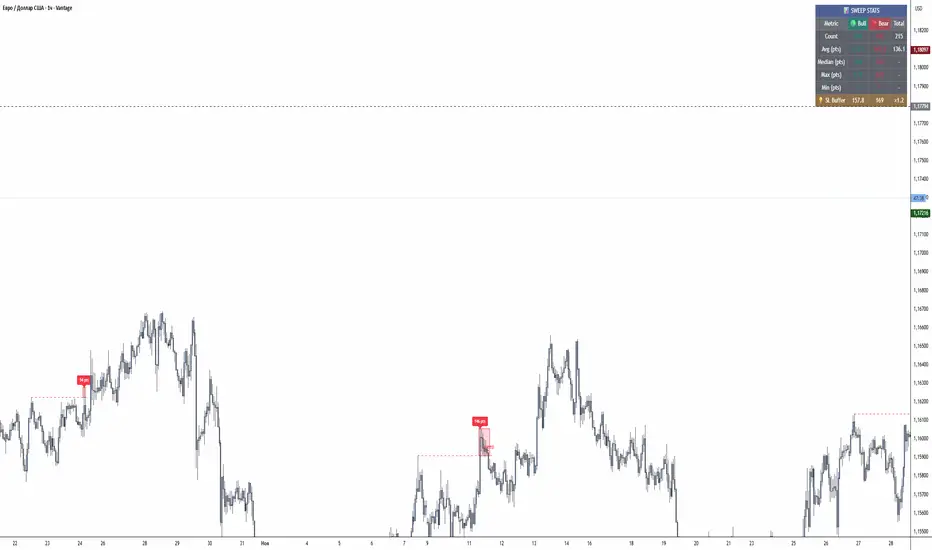
Sweep AnalyzerA comprehensive liquidity sweep detection indicator that identifies false breakouts (sweeps) of swing highs and lows, measures their depth, and provides statistical analysis to help optimize stop-loss placement.
🎯 Overview
This indicator is designed for traders who use Smart Money Concepts (SMC), ICT methodology, or price action strategies. It automatically detects when price “sweeps” (falsely breaks) key swing levels and returns back, which often indicates liquidity grabs by institutional traders.
The unique feature of this indicator is its ability to measure the depth of each sweep in points/pips and calculate statistics, helping you understand how far price typically goes beyond levels before reversing. This data is invaluable for setting optimal stop-loss distances.
⚙️ Features & Settings Explained
Settings Group
Cooldown Period (bars) — Minimum number of bars between sweep signals. Prevents multiple signals in the same area. Default: 10
Show Statistics Table — Toggle the statistics panel on/off
Table Position — Choose corner placement: Top Left, Top Right, Bottom Left, Bottom Right
Table Size — Small, Normal, or Large text size for the table
Pivot Settings
Pivot Left Bars — Number of bars to the left required to confirm a swing point. Higher values identify more significant levels. Default: 20
Pivot Right Bars — Number of bars to the right required to confirm a swing point. Default: 20
How it works: A swing high is confirmed when the high is higher than all bars within the left AND right lookback period. Same logic applies for swing lows (lowest of the range).
Sweep Detection
Sweep Lookback (bars ) — How far back to look for valid swing levels to sweep. Default: 100
Strict Mode (original logic) — When enabled, uses the original SFP (Swing Failure Pattern) detection which requires specific candle patterns. When disabled, uses enhanced detection that tracks multi-bar sweeps.
Enhanced Mode (Strict Mode OFF):
→ Detects sweeps that develop over multiple bars
→ Price can stay beyond the level for several candles
→ Tracks the deepest point reached during the sweep
→ More flexible and catches more setups
Strict Mode (ON):
→ Classic SFP detection
→ Requires price to sweep and close back in one move
→ More conservative, fewer but higher-quality signals
Sweep Filters
Max Bars in Sweep — Maximum bars price can stay beyond the level. If exceeded, it’s considered a breakout, not a sweep. Default: 10
Max Sweep Depth (ATR multiplier) — Maximum sweep depth as ATR multiple. Sweeps deeper than this are filtered out as breakouts. Default: 3.0
ATR Length — Period for ATR calculation used in filters. Default: 14
If price goes too deep beyond a level or stays there too long, it’s likely a real breakout, not a liquidity sweep. These filters prevent false signals during trending markets.
Sweep Confirmation
Confirmation Bars — How many consecutive bars price must close back beyond the level to confirm the sweep. Default: 2
Min Return Depth (ATR mult) — Minimum distance price must return beyond the level (as ATR multiple) to count as valid return. Default: 0.3
📊 Statistics Table
The table displays real-time statistics for all detected sweeps:
Count — Total number of sweeps detected (Bull/Bear/Total)
Avg (pts) — Average sweep depth in points. This is the key metric for SL placement
Median (pts) — Median sweep depth, useful when you have outliers
Max (pts) — Deepest sweep recorded
Min (pts) — Shallowest sweep recorded
SL Buffer — Suggested stop-loss distance (Average × 1.2)
⚠️ Important Notes
Point Calculation: The indicator automatically detects instrument type. For Forex with 5 decimals it displays in pipettes (multiply by 0.1 for pips). For Forex with 4 decimals it displays in pips. For other instruments it displays in points.
Historical Data: Statistics are calculated from all visible chart data. Scroll left to include more history for better averages.
Timeframe Matters: Sweep characteristics vary by timeframe. Run the indicator separately on each TF you trade.
Not Financial Advice: This indicator is a tool for analysis. Always combine with other confluence factors and proper risk management.
🔔 Alerts
Two alert conditions are available:
→ Bullish Sweep: Triggers when a bullish sweep is confirmed
→ Bearish Sweep: Triggers when a bearish sweep is confirmed
Set up alerts via TradingView’s alert menu for real-time notifications.
💡 Pro Tips
→ Start with defaults and adjust based on your instrument/timeframe
→ Increase Pivot bars (25-30) for higher timeframes to catch more significant levels
→ Decrease Max Bars in Sweep (5-7) for scalping to filter slow moves
→ Use Strict Mode if you want fewer but more reliable signals
→ Compare median vs average — if very different, you have outliers affecting your SL calculation
--------------------------------------------------------------------------------
Комплексный индикатор для определения свипов ликвидности (ложных пробоев) свинг-хаев и свинг-лоу. Измеряет глубину каждого свипа и предоставляет статистический анализ для оптимизации размещения стоп-лоссов.
🎯 Обзор
Индикатор разработан для трейдеров, использующих концепции Smart Money (SMC), методологию ICT или стратегии Price Action. Он автоматически определяет моменты, когда цена “свипает” (ложно пробивает) ключевые свинг-уровни и возвращается обратно, что часто указывает на сбор ликвидности институциональными игроками.
Уникальная особенность индикатора — измерение глубины каждого свипа в пунктах/пипсах и расчёт статистики. Это помогает понять, как далеко цена обычно заходит за уровень перед разворотом. Эти данные бесценны для установки оптимального расстояния стоп-лосса.
⚙️ Описание функций и настроек
Основные настройки (Settings)
Strict Mode — Включает строгий режим с оригинальной логикой SFP. При выключении используется расширенное определение многобаровых свипов.
Cooldown Period (bars) — Минимальное количество баров между сигналами свипа. Предотвращает множественные сигналы в одной области. По умолчанию: 10
Show Statistics Table — Включить/выключить панель статистики
Table Position — Выбор угла размещения: Top Left, Top Right, Bottom Left, Bottom Right
Table Size — Размер текста таблицы: Small, Normal, Large
Настройки пивотов (Pivot Settings)
Pivot Left Bars — Количество баров слева, необходимое для подтверждения свинг-точки. Большие значения определяют более значимые уровни. По умолчанию: 20
Pivot Right Bars — Количество баров справа, необходимое для подтверждения свинг-точки. По умолчанию: 20
Как работает: Свинг-хай подтверждается, когда максимум свечи выше всех баров в пределах левого И правого периода просмотра. Та же логика применяется для свинг-лоу (минимум диапазона).
Определение свипа (Sweep Detection)
Sweep Lookback (bars) — Как далеко назад искать валидные свинг-уровни для свипа. По умолчанию: 100
Расширенный режим (Strict Mode ВЫКЛ):
→ Определяет свипы, развивающиеся на нескольких барах
→ Цена может оставаться за уровнем несколько свечей
→ Отслеживает самую глубокую точку во время свипа
→ Более гибкий, ловит больше сетапов
Строгий режим (Strict Mode ВКЛ):
→ Классическое определение SFP
→ Требует свип и закрытие обратно за один бар
→ Более консервативный, меньше но более качественных сигналов
Фильтры свипа (Sweep Filters)
Max Bars in Sweep — Максимальное количество баров, которое цена может находиться за уровнем. При превышении считается пробоем, а не свипом. По умолчанию: 10
Max Sweep Depth (ATR multiplier) — Максимальная глубина свипа как множитель ATR. Свипы глубже этого значения фильтруются как пробои. По умолчанию: 3.0
ATR Length — Период для расчёта ATR, используемого в фильтрах. По умолчанию: 14
Если цена заходит слишком глубоко за уровень или остаётся там слишком долго, это скорее всего реальный пробой, а не свип ликвидности. Эти фильтры предотвращают ложные сигналы на трендовых рынках.
Подтверждение свипа (Sweep Confirmation)
Confirmation Bars — Сколько баров подряд цена должна закрываться обратно за уровнем для подтверждения свипа. По умолчанию: 2
Min Return Depth (ATR mult) — Минимальное расстояние, на которое цена должна вернуться за уровень (как множитель ATR), чтобы считаться валидным возвратом. По умолчанию: 0.3
📊 Таблица статистики
Таблица отображает статистику в реальном времени для всех обнаруженных свипов:
Count — Общее количество свипов (Bull/Bear/Total)
Avg (pts) — Средняя глубина свипа в пунктах. Ключевая метрика для размещения SL
Median (pts) — Медианная глубина свипа, полезна при наличии выбросов (аномальное значение, сильно отличающееся от остальных.)
Max (pts) — Самый глубокий свип
Min (pts) — Самый мелкий свип
SL Buffer — Рекомендуемое расстояние стоп-лосса (Среднее × 1.2)
⚠️ Важные замечания
Расчёт пунктов: Индикатор автоматически определяет тип инструмента. Для Forex с 5 знаками отображает в пипетках (умножьте на 0.1 для пипсов). Для Forex с 4 знаками отображает в пипсах. Для других инструментов отображает в пунктах.
Исторические данные : Статистика рассчитывается по всем видимым данным графика. Прокрутите влево, чтобы включить больше истории для лучших средних значений.
Таймфрейм важен: Характеристики свипов различаются на разных таймфреймах. Запускайте индикатор отдельно на каждом ТФ, который торгуете.
Не является финансовой рекомендацией: Этот индикатор — инструмент для анализа. Всегда комбинируйте с другими факторами подтверждения и правильным управлением рисками.
🔔 Алерты
Доступны два условия для алертов:
→ Bullish Sweep: Срабатывает при подтверждении бычьего свипа
→ Bearish Sweep: Срабатывает при подтверждении медвежьего свипа
💡 Советы
→ Начните с настроек по умолчанию и корректируйте под ваш инструмент/таймфрейм
→ Увеличьте Pivot bars (25-30) для старших таймфреймов, чтобы ловить более значимые уровни
→ Уменьшите Max Bars in Sweep (5-7) для скальпинга, чтобы фильтровать медленные движения
→ Используйте Strict Mode если хотите меньше, но более надёжных сигналов
→ Сравнивайте медиану и среднее — если сильно отличаются, у вас есть выбросы, влияющие на расчёт SL
BoS/CHoCH + FakeoutRMI • BoS / CHoCH + Fakeout Detector
This indicator identifies true market structure breaks based on Break of Structure (BoS) and Change of Character (CHoCH), combined with a precise Fakeout / Liquidity Sweep detector to filter false breakouts.
The logic is built on Smart Money Concepts (SMC) and ICT market structure, using close-confirmation only instead of wick-based signals.
Key Features
BoS & CHoCH Detection (Major Structure)
– Clear distinction between trend continuation (BoS) and trend reversal (CHoCH)
– Bullish and bearish structures are visually separated by color
Fakeout / Liquidity Sweep Detection
– Detects wick sweeps above highs and below lows
– Fakeouts are automatically removed once a valid structure break occurs
– No overlap between Fakeouts and BoS / CHoCH
Close-Only Confirmation (Institutional Logic)
– Structure is considered broken only after candle close
– Reduces noise and false signals caused by stop hunts
Split-Line Design (Clean Chart)
– Structure lines with centered text gap
– Extremely clean and readable, even on lower timeframes
Potential Next Break (Optional)
– Displays potential next major highs and lows
– Ideal for liquidity targeting and trade planning
Why This Indicator?
This tool is designed for traders who:
want non-repainting structure logic
focus on price action & market structure, not lagging indicators
need a clear distinction between fakeouts and real breaks
trade using SMC / ICT concepts
Perfect for scalping, day trading, and swing trading across Forex, Indices, Crypto, and Commodities.
Disclaimer
This indicator is an analysis tool, not an automated trading system.
For best results, combine it with Order Blocks, Fair Value Gaps (FVG), Liquidity Pools, and session bias.

KIMATIX Silver Bullet 2.0KIMATIX Silver Bullet 2.0 is a precision-based intraday trading tool built around the most reliable market behaviors during the ICT Silver Bullet windows.
The indicator automatically identifies high-probability price delivery zones by combining time-based session logic, displacement, fair value gaps, and liquidity dynamics — without clutter or subjective interpretation.
What the indicator does
Automatically marks the three core Silver Bullet windows (New York time)
Tracks session highs and lows to define contextual liquidity
Detects displacement moves using adaptive volatility logic
Highlights valid Silver Bullet Fair Value Gaps (FVGs) only when structural conditions are met
Filters weak setups by minimum size, age, and directional confirmation
Projects FVG zones forward to monitor clean retracements
Plots liquidity levels (highs & lows) with optional mitigation handling
All calculations are done fully automatically — no manual drawing, no guessing.
Designed for
Scalper and Intraday traders (especially 1–5 minute charts)
Futures, indices, forex, and crypto
Traders who want clear execution zones, not lagging signals
Anyone using liquidity-based or ICT-style frameworks
Key advantages
No signals, no repainting logic — context first
Strict filtering to reduce noise and over-marking
Clean visual layout focused on price delivery
Works seamlessly alongside higher-timeframe bias and volume tools
This indicator does not tell you when to trade —
it shows you where the market is most likely to react.
Important note
KIMATIX Silver Bullet 2.0 is a context and execution tool, not a standalone strategy.
Best results are achieved when combined with proper risk management and directional bias.
More Infos and Premium Indicators: kimatixtrading.com

HTF PO3 [Motoneiron]📌 HTF PO3
This indicator plots Higher Timeframe candles directly on a Lower Timeframe chart, allowing traders to clearly observe HTF structure while analyzing execution on LTF.
It provides a deeper understanding of PO3, AMD (Accumulation–Manipulation–Distribution) and HTF→LTF fractal behavior — all without switching charts.
HTF candles include:
Open
Close
High & Low extremes
Real-time remaining time until HTF candle close
You can display from 1 to 10 HTF candles simultaneously, both in automatic mode (where the indicator selects the correct HTF based on your LTF) and manual mode (you pick any HTF you want).
🕒 Automatic HTF Selection (Built-in Timeframe Mapping)
In Automatic Mode the script chooses the appropriate HTF based on the current chart timeframe using the following pairs:
1m → 5m
3m → 15m
5m → 30m
15m → 1H
30m → 2H
45m → 3H
1H → 4H
2H → 6H
3H → 12H
4H → 1D
6H → 1D
12H → 1W
Manual mode allows overriding this mapping and selecting any HTF you prefer.
✨ What this indicator helps you see
Thanks to precise rendering and optional offset, you can easily observe:
HTF Open levels (key ICT reference points)
Extremes forming inside the active HTF candle
Internal AMD structure building inside HTF
Intra-HTF PO3 development
How price behaves around significant HTF zones
This deepens your understanding of market structure, premium/discount arrays, and PO3 mechanics while staying on the lower timeframe.
⚙️ Key Features
Plot 1–10 HTF candles on any LTF
Automatic HTF mapping or fully manual selection
Customizable colors (body/wick)
Adjust candle width, horizontal offset
Time labels: weekday, date, time, month (depends on HTF)
Real-time countdown until HTF close
Optional shifting of labels & candles for visual clarity
Designed for PO3, AMD, ICT concepts, HTF structure breakdowns

SMC-Math by Thomas v1📌 SMC-Math by Thomas v1 — Description
SMC-Math by Thomas v1 is a complete Smart Money Concepts toolkit designed for traders who want a clean, mathematical, and structured view of market mechanics.
Rather than relying on abstract concepts or subjective drawings, this indicator focuses on rules-based detection of:
✔ Order Blocks (OB)
✔ Fair Value Gaps (FVG)
✔ Market Structure shifts (BoS / CHoCH)
✔ HTF trend confirmation
✔ Premium / Discount arrays
✔ Equal High & Equal Low Liquidity Zones (no hinting — expiry only)
This version is engineered for stability, clarity, and performance — with fully optimized array management, timestamp-based cleanup, and a clean visual presentation suitable for both discretionary and systematic trading.
📌 Key Features
🔹 1. Order Blocks (Bullish & Bearish)
Auto-detected using fractal swing highs/lows
Optional displacement + high volume filters
Midline display option
HTF trend alignment filter
Smart expiry + broken OB cleanup
Custom opacity, buffer, and extension controls
🔹 2. Fair Value Gaps (FVG)
Bullish and bearish gap detection
HTF confirmation-based dimming
No border for a clean ICT-style visuals
Auto remove when filled
Fully rule-based
🔹 3. Market Structure (BoS / CHoCH)
Based on fractal highs/lows
Automatic labeling (small, unobtrusive)
Direction validated by HTF option
Each structure level plotted with a projected line
Smooth, clean BOS/CHOCH flow
🔹 4. Premium / Discount Zones
Auto-calculated from most recent swing high & swing low
Box shading dynamically updates each bar
Helps identify optimal trade areas (OB → FVG → PD array)
🔹 5. Liquidity Zones (Equal Highs & Equal Lows)
This tool highlights where liquidity is likely resting:
Detects Equal Highs and Equal Lows using your tolerance or max difference
Auto-creates borderless shaded boxes
Adjustable box height and extension
NO hinting logic — the box remains for exactly cleanupDelay bars, then expires
Clean and predictable behavior, ideal for rule-based setups
This is especially useful for:
identifying buy-side and sell-side liquidity pools
anticipating runs on liquidity
targeting sweeps
🔹 6. HTF Status Panel
Shows higher-timeframe trend status on the live bar:
Bullish
Bearish
Or “HTF Not Required”
Useful for aligning entries with larger market flow.
📌 How to Use SMC-Math by Thomas v1
1️⃣ Identifying Direction
Start by reading:
HTF Trend Label
BOS & CHOCH reactions
Bullish: look for HL → HH structure + bullish OBs + bullish FVGs
Bearish: look for LH → LL structure + bearish OBs + bearish FVGs
This creates your directional bias.
2️⃣ Using Order Blocks
An OB is valid when:
It appears in line with structure
HTF alignment supports it (optional toggle)
Price returns after a displacement
OB is not “broken” (indicator handles this visually)
Use OBs as:
Rebalance targets
Entry areas
Stop placement logic
3️⃣ Fair Value Gaps
FVGs appear when price dislocates and leaves inefficiency.
Use them to:
Refine entries inside OBs
Project premium/discount zones
Identify continuation zones
The indicator auto-removes FVGs when filled.
4️⃣ Liquidity Zones
Liquidity zones identify resting orders at equal highs/lows.
This version uses simple expiry logic:
Box is created when EQH/EQL forms
It remains visible for 20 bars (default)
It disappears automatically after expiry
No hint/confirmation triggers deletion
Usage tips:
Expect price to run toward these zones
Use them as targets or continuation markers
Combine with OB/FVG for confluence
5️⃣ Premium / Discount Zones
Use PD arrays to gauge:
Premium = optimal shorting zones
Discount = optimal long zones
Not trade “in the middle” unless a clear BOS or CHoCH happens
📌 Recommended Workflow
HTF Bias → Check the HTF panel
Market Structure → Identify trend continuation or reversal
Liquidity → Mark where price is likely to target
FVG → Identify imbalance zones
OB → Confirm institutional origin points
PD Arrays → Determine optimal trade location
Execute with confluence
📌 Who Is This Indicator For?
✔ Traders using ICT / SMC logic
✔ Traders wanting rule-based, non-subjective markups
✔ Traders who want automated detection without repainting
✔ Anyone who uses OB, FVG, liquidity sweeps, and structure shifts

HTF LiquidityThe ICT Liquidity Sweeps Indicator is designed to track liquidity zones in the market areas where stop-losses and pending orders are typically clustered. This indicator marks buyside liquidity (resistance) and sellside liquidity (support) from HTF (H4, H1 and M15), helping traders identify areas where price is likely to manipulate liquidity before making a significant move.
This tool is based on Inner Circle Trader (ICT) Smart Money Concepts, which emphasize how institutional traders, or “Smart Money,” manipulate liquidity to fuel price movements. By identifying these zones, traders can anticipate liquidity sweeps and position themselves accordingly.
⚙️ How It Works
1️⃣ Detects Key Liquidity Zones
The script automatically identifies significant swing highs and swing lows in price action using a pivot-based method.
A swing high (buyside liquidity) is a peak where price struggles to break higher, forming a resistance level.
A swing low (sellside liquidity) is a valley where price struggles to go lower, creating a support level.
These liquidity points are prime targets for liquidity sweeps before a true trend direction is confirmed.
2️⃣ Draws Liquidity Lines
Once a swing high or low is identified, a horizontal line is drawn at that level.
The lines extend to the right, serving as future liquidity targets until they are broken.
The indicator allows customization in terms of color, line width, and maximum number of liquidity lines displayed at once.
3️⃣ Handles Liquidity Sweeps
When price breaks a liquidity level, the indicator reacts based on the chosen action setting:
Dotted/Dashed: The line remains visible but changes style to indicate a sweep.
Delete: The line is completely removed once price has interacted with it.
This feature ensures that traders can easily spot where liquidity has been taken and determine whether a reversal or continuation is likely.
4️⃣ Prevents Chart Clutter
To maintain a clean chart, the script limits the number of liquidity lines displayed at any given time.
When new liquidity zones are formed, the oldest lines are automatically removed, keeping the focus on the most relevant liquidity zones.

BT Delta AbsorptionBT Absorption detects aggressive counterflow volume—moments where one side
of the market (buyers or sellers) attacks aggressively, yet price fails to move
proportionally.
This is the classic definition of absorption:
"Large market orders are being absorbed by strong passive limit orders."
Absorption is one of the most reliable early signals for:
Reversals
Trap conditions
Failed breakouts
Liquidity grabs
Fake displacement moves
---
■ What BT Absorption Measures
1. Delta Imbalance
Identifies when buying or selling pressure becomes unusually one-sided.
2. Volatility Mismatch
Shows when large delta does NOT translate into meaningful price movement.
3. Absorption Strength Score
A normalized reading (often 0–100) showing the intensity of counterflow activity.
4. Wick & Structure Absorption
Wick-driven absorption helps identify:
Failed sweeps
Stop hunts
Rejection zones
Trapped traders
---
■ Why Absorption Matters
Absorption almost always precedes:
Reversals
Failed breakout moves
SMC/ICT-style displacement
Order block formation
Trend continuation after a trap
When aggressive traders cannot move price toward their desired direction,
the move typically reverses quickly—and with force.
---
■ Visual Elements
• Bull Absorption Marker
Often appears near lows—signals seller aggression failing to push price down.
• Bear Absorption Marker
Often appears near highs—signals buyer aggression failing to break higher.
• Absorption Score Heatmap (optional)
Shows intensity of absorption per candle.
• Threshold Levels
Identify when absorption becomes statistically significant.
---
■ How to Use BT Absorption in Trading
1. Reversal Detection
Look for absorption after:
Equal highs/lows
Sweeps
Stop runs
Breakout failures
This is often the earliest possible signal that a reversal is coming.
2. Filter Breakouts
A breakout without absorption is usually weak.
A breakout with absorption against it is likely a fakeout.
3. Confirm SMC/ICT Concepts
The indicator pairs perfectly with:
Fair Value Gaps
Order Blocks
Liquidity sweeps
Displacement legs
If your setup triggers and absorption confirms → high confidence.
4. Identify Trap Conditions
Absorption often marks:
Trapped breakout chasers
Trapped trend shorts
Imbalanced orderflow
These create ideal high-R trades.
5. Alert-Driven Market Monitoring
Use alerts for:
Bull Absorption
Bear Absorption
High-strength absorption
Absorption clusters
This allows traders to step away from charts while still catching
high-probability reversals.
---
■ High-Probability Absorption Setups
A) Sweep + Absorption
Swept level → absorption → enter opposite direction.
B) Failed Breakout Absorption
Breaks structure → delta fails → absorption prints → strong reversal.
C) Trend Continuation Absorption
Absorption against the correction often precedes continuation.
D) Absorption Clusters
Multiple absorption signals indicate a structural market shift.
---
■ Final Summary
BT Absorption provides:
Early reversal signals
Counterflow pressure detection
Confirmation for existing setups
Identification of liquidity traps
Alert-based monitoring across multiple markets
BT Absorption is the perfect complement to BT Spike:
• BT Spike = detects volatility ignition
• BT Absorption = detects failed aggression + reversals
Combined, they form a complete liquidity and orderflow toolkit.

OHLC ProjectionsOHLC Projections is an advanced analytical tool designed to forecast potential price ranges for the current session (Daily or Weekly) based on historical data. The indicator utilizes a statistical analysis of price behavior relative to the Open, calculating average values for "Manipulation" (movement against the closing direction) and "Distribution" (the main expansion in the closing direction).
Unlike standard moving averages, this tool creates a "roadmap" for the developing candle, helping traders identify potential session highs and lows before they form.
How It Works
The algorithm analyzes a user-defined lookback period (e.g., 60 candles) and calculates:
Manipulation (M): The average length of the wick formed opposite to the candle's closing direction (e.g., the bottom wick of a bullish candle).
Distribution (D): The average distance from the Open to the extreme point in the direction of the close.
Based on these metrics, the following levels are projected:
Open Line: The opening price of the period (Always Solid).
Manipulation Levels (+M / -M): The statistical range where price often "traps" traders before the true move begins. These are often ideal reversal points (Smart Money Reversal).
Distribution Levels (+D / -D): The statistical target (Take Profit) that price tends to reach after the manipulation phase is complete.
Key Features
Anchored Levels (Non-Repainting): Levels are calculated once at the start of a new session (e.g., at Midnight) and remain fixed throughout the day. They do not "float" or repaint with current price action.
History Management: A unique "Limit history to current day" feature keeps your chart clean. When enabled, the indicator automatically removes lines from previous days, leaving only the projections relevant to the current active session.
NY Midnight Support: Option to anchor daily calculations specifically to the New York Midnight Open (essential for ICT/SMC traders).
Dual Timeframe: Ability to display projections for two timeframes simultaneously (e.g., Daily and Weekly) on lower timeframe charts.
"Areas" Mode: Option to display zones (Boxes) instead of lines, based on two different lookback periods (short and long), allowing for the visualization of statistical confluence.
Premium/Discount Zones: Optional shading of zones above and below the opening price to easily identify expensive (Premium) and cheap (Discount) price areas.
Configuration & Visuals
The indicator is fully customizable:
Lookback Period: Adjust the number of historical candles used for the average calculation.
Visual Style: Full control over line colors and styles. The Open Line is always forced to Solid for easy distinction, while other levels can be set to dotted or dashed.
Statistics Table: An optional dashboard displaying the specific price values for all calculated levels.
Strategy Application
This tool is highly effective for Smart Money Concepts (SMC) and Inner Circle Trader (ICT) strategies.
Look for Short opportunities when price extends above the Open and hits the -M or +D levels.
Look for Long opportunities when price drops below the Open and tests the +M or -D levels.
Alerts
Built-in alerts allow you to be notified immediately when price crosses key Manipulation or Distribution levels, ensuring you never miss a reaction point.
