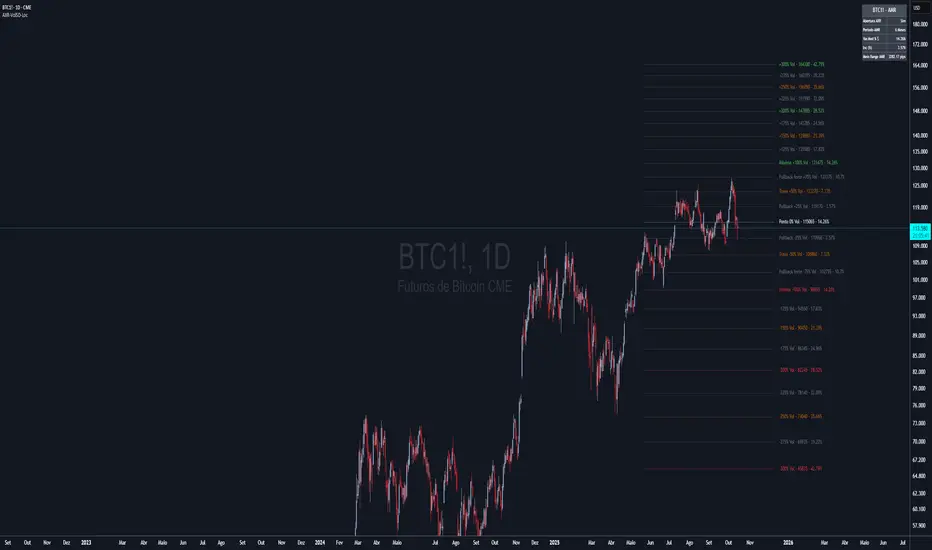
AXR-VolSD-Loc📈 AXR-VolSD-Loc — Volatility & Range Mapping Tool for Smart Traders
The AXR-VolSD-Loc indicator is a professional-grade tool designed for traders who rely on precise volatility analysis and structured range-based levels. It combines dynamic volatility bands with configurable price ranges such as ADR, AWR, AMR, and AQR — offering strategic clarity across all timeframes.
🔍 Key Features
Multi-Timeframe Range Calculation
Supports Daily (ADR), Weekly (AWR), Monthly (AMR), and Quarterly (AQR) ranges — each with independent period controls.
Standard Deviation Volatility Bands
Automatically or manually calculate standard deviation (%) to plot multiple upper/lower levels from a base price reference.
Fully Customizable Lines & Labels
Choose the number of bands, enable half-volatility levels, apply color gradients, customize line styles, widths, label positions, font sizes and offsets.
Flexible Anchor Logic
Set the base line for volatility from Hi/Lo/50%/0% of AXR, or input your own manual price — ideal for ICT model alignment.
Smart Visuals & Optimized Drawing
Clean line and label management using line.new() and label.new() with efficient updates only when required.
Data Table & Summary Panel
Floating table displays key metrics like high/low range, midpoint, volatility settings, and source references.
Built-In Alerts
Receive alerts when price approaches key volatility levels or AXR range extremes — ideal for anticipating institutional behavior.
🛠️ How to Use & Configure
1. Choose the Range Mode
In "AXR Mode & Period Settings", select your preferred range type:
Daily (ADR) – Short-term or intraday.
Weekly (AWR) – Medium swing positions.
Monthly (AMR) – Optimal for higher-timeframe structure.
Quarterly (AQR) – Best for macro-level zones.
Then define the number of days/weeks/months/quarters used to calculate each.
2. Define the Volatility Base Line
Under "Volatility Base Line Settings", configure the anchor:
Use 0% AXR for midpoint, or Hi/Lo/50% for edges.
Manual mode allows custom price input.
Adjust the line color, style, and thickness.
3. Configure Standard Deviation
In "Standard Deviation - Calculation & Levels", select the source:
Automatic AXR — calculates % based on AXR range.
Manual — allows custom % input.
Define how many levels above/below the base line.
Use the scale factor to adjust relative strength (e.g., 0.5 = 50% of AXR).
4. Adjust Visual Display
In "Display & Labels":
Enable or disable volatility lines.
Use color progression for intensity from blue to red.
Show or hide intermediate lines (half deviation).
Choose label alignment: right, center, or left.
Fine-tune label position with candle offset and text size.
5. Extend Lines and Define Visibility
You can choose to extend the lines left, right or both directions — or use a fixed number of bars when not extended.
This applies to both volatility lines and AXR levels.
6. Show AXR Hi/Lo/50%/0% Lines
In "AXR Levels":
Enable display of Hi, Lo, midpoint, and 50% levels.
Toggle display of AXR open levels (MO-based).
Customize style, color and width of each line.
7. Enable the Table (Optional)
Turn on the floating data table to see a quick summary:
Range high/low/midpoint.
Volatility multiplier.
Source (manual vs automatic).
Period length.
Useful for fast review during market sessions.
8. Alerts
Receive automated alerts when price approaches:
AXR Hi/Lo
0% midpoint level
Custom-defined deviation bands
✅ Use Cases
Define and monitor volatility zones around structured ranges.
Combine AMR or AQR with deviation bands for swing setups.
React to price imbalances at 50% or 0% AXR zones.
Integrate with order blocks, liquidity zones or ICT-based confluences.
Questions or suggestions? Contact us via TradingView message or in the comments.
Happy trading!
Cari dalam skrip untuk "ict"
Time LevelsTime Levels is a customizable TradingView indicator designed to mark critical intraday price levels based on specific time inputs. This tool helps traders identify significant Open/High/Low/Close (OHLC) levels, support & resistance (S&R) zones, and potential Judas Swing manipulation points—aligned with selected timeframes and adjusted to any time zone via UTC offset.
🔧 Key Features:
OHLC/OLHC Levels: Automatically draws horizontal lines at the candle’s open price for up to four specified time points. Ideal for marking session opens, closes, or key intraday levels.
Support & Resistance Zones: Highlights two time-based S&R levels that can help identify discount and premium pricing zones.
Judas Swing Detection: Marks potential liquidity grab zones (Judas Swings) at three user-defined times, assisting in identifying manipulation and smart money entry points.
Global Timezone Support: Includes a UTC offset input to align levels accurately with your trading session, regardless of your location.
Full Customization: Personalize the color, style (solid, dashed, dotted), and thickness of each line independently for OHLC, S&R, and Judas levels.
🛠️ Use Cases:
New York / London open price tracking
ICT-based SMC level marking
Predefined time-based liquidity level visualizations
Institutional-level price reactions (e.g., during specific market opens)
This indicator is best suited for intraday and short-term (especially ICT) traders looking to bring precision and consistency into their technical analysis framework.

Time Based Range# Time Based Range
**A fully customizable session-based range indicator for intraday and daily trading analysis**
## Overview
The Time Based Range indicator identifies and visualizes key price levels from any user-defined time session. Whether you're trading the London open, New York session, or any custom timeframe, this indicator helps you identify crucial support and resistance levels formed during specific trading periods.
## Key Features
### 🕒 **Flexible Session Configuration**
- Customize any time range (e.g., 05:00-13:00, 20:00-02:00)
- Select specific days of the week (Sunday=1 through Saturday=7)
- Works on any timeframe from 1-minute to daily charts
### 📊 **Three Display Modes**
**OHLC Mode:**
- Shows Open, High, Low, Close, and Midpoint lines
- Fully customizable line colors, styles, and widths
- Optional labels with custom text
- Toggle individual lines on/off
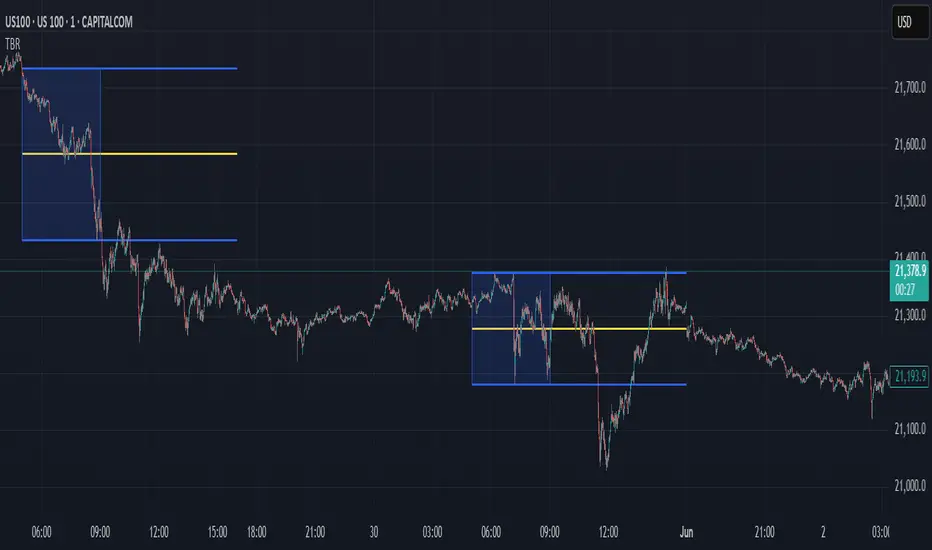
**Range Mode:**
- Displays High, Low, and Midpoint lines extending into the future
- Session background box for visual clarity
- Configurable extension length in hours
- Clean range-based analysis
**Mitigate Mode:**
- Horizontal pivot lines that extend until price "mitigates" (touches) them
- Session background box
- Lines automatically stop extending when price reaches the level
- Perfect for ICT-style analysis
### 🚨 **Advanced Alert System**
**Breakout Alerts:**
- Notifies when price breaks above session high or below session low
- Real-time notifications for range expansion
**Liquidity Sweep Alerts:**
- Detects when price briefly breaks a level but closes back inside the range
- Configurable lookback period for sweep detection
- Helps identify false breakouts and liquidity grabs
**Equilibrium Rejection Alerts:**
- Monitors price reaction at the session midpoint
- Detects strong rejections with wick formations
- Configurable sensitivity threshold
### 🎨 **Full Customization**
- Individual color settings for all lines and boxes
- Multiple line style options (Solid, Dashed, Dotted)
- Adjustable line widths and transparency
- Custom label text and positioning
- Session limit control (1-10 sessions displayed)
## Use Cases
### Day Trading
- Mark key levels from overnight sessions
- Identify London/New York opening ranges
- Track Asian session highs and lows
### Swing Trading
- Daily range analysis
- Multi-day level identification
- Key support/resistance from specific periods
### ICT/SMC Trading
- Liquidity pool identification
- Fair value gap analysis
- Market structure understanding
## Technical Specifications
- **Maximum Sessions:** 1-10 (user configurable)
- **Time Format:** 24-hour (HHMM-HHMM)
- **Day Selection:** Individual day toggles (1=Sunday through 7=Saturday)
- **Alert Types:** 4 different alert conditions
- **Drawing Objects:** Optimized with automatic cleanup
- **Performance:** Efficient array management prevents chart lag
## Best Practices
1. **Start Simple:** Begin with OHLC mode to understand session dynamics
2. **Use Alerts:** Enable notifications for key level interactions
3. **Combine Modes:** Switch between modes based on market conditions
4. **Optimize Settings:** Adjust colors and styles for your chart theme
5. **Multiple Timeframes:** Use different sessions for various trading strategies
## Compatibility
- Works on all TradingView chart types
- Compatible with all asset classes (Forex, Stocks, Crypto, Futures)
- Optimized for both light and dark themes
- Mobile-friendly display
---
*This indicator helps traders identify high-probability trading zones based on time-specific price action. Always combine with proper risk management and additional analysis methods.*
The Blueprint v.1The Blueprint v.1 is a comprehensive ICT-style session overlay tool designed for precision-based intraday traders. This indicator automatically highlights key institutional trading sessions with dynamic boxes and labels, while tracking the midnight open with customizable horizontal and vertical lines.
🔹 Features:
Auto-detection and marking of major FX sessions: Asia, London, New York, London Close, and Afternoon
Dynamic Midnight Open horizontal line that extends across the full trading day (until 5PM NY on Fridays)
Vertical line to mark Midnight Open candle
Customizable colors, widths, and styles for all midnight lines and session boxes
Smart alignment: session boxes begin at the center of the opening candle and dynamically expand
Supports time zone offset input for traders outside NY time
🔧 Perfect for ICT concepts like Killzones, Judas Swings, and Midnight Open anchors.

[TehThomas] - Fair Value GapsThis script is designed to automatically detect and visualize Fair Value Gaps (FVGs) on your chart in a clean, intuitive, and highly responsive way. It’s built with active traders in mind, offering both dynamic updates and customization options that help you stay focused on price action without being distracted by outdated or irrelevant information.
What Are Fair Value Gaps?
Fair Value Gaps are areas on a chart where there’s an inefficiency in price, typically formed when price moves aggressively in one direction, leaving a gap between the wicks of consecutive candles. These gaps represent imbalanced price action where not all buy or sell orders were efficiently matched. As a result, they often become magnet zones where price returns later to "fill" the imbalance before continuing in its intended direction. Many traders use them as points of interest for entries, re-entries, or anticipating reversals and consolidations.
This concept is frequently used in Smart Money and ICT-based trading models, where understanding how price seeks efficiency is crucial to anticipating future moves. When combined with concepts like liquidity, displacement, and market structure, FVGs become powerful tools for technical decision-making.
Script Features & Functionality
1. Live Updating Gaps (Dynamic Shrinking)
One of the core features of this script is its ability to track and dynamically shrink Fair Value Gaps as price trades into them. Instead of leaving a static zone on your chart, the gap will adjust in real-time, reflecting the portion that has been filled. This gives you a much more accurate picture of remaining imbalance and avoids misleading zones.
2. Automatic Cleanup After Fill
Once price fully fills an FVG, the script automatically removes it from the chart. This helps keep your workspace clean and focused only on relevant price zones. There’s no need to manually manage your gaps, everything is handled behind the scenes to reduce clutter and distraction.
3. Static Mode Option
While dynamic updating is the default, some traders may prefer to keep the original size of the gap visible even after partial fills. For that reason, the script includes a toggle to switch from live-updating (shrinking) mode to static mode. In static mode, FVGs stay fixed from the moment they are drawn, giving you a more traditional visual reference point.
4. Multi-Timeframe Support (MTF)
You can now view higher timeframe FVGs, such as those from the 1H or 4H chart, while analyzing lower timeframes like the 5-minute. This allows you to see key imbalances from broader market context without having to flip between charts. FVGs from higher timeframes will be drawn distinctly so you can differentiate them at a glance.
5. Cleaner Visualization
The script is designed with clarity in mind. All drawings are streamlined, and filled gaps are removed to maintain a minimal, distraction-free chart. This makes it easier to combine this tool with other indicators or price-action-based strategies without overloading your workspace.
6. Suitable for All Market Types
This script can be used on any asset that displays candlestick-based price action — including crypto, forex, indices, and stocks. Whether you're scalping low-timeframe setups or swing trading with a higher timeframe bias, FVGs remain a useful concept and this script adapts to your trading style.
Use Case Examples
On a 5-minute chart, display 1-hour FVGs to catch major imbalance zones during intraday trading.
Combine the FVGs with liquidity levels and inducement patterns to build ICT-style trade setups.
Use live-updating gaps to monitor in-progress fills and evaluate whether a zone still holds validity.
Set the script to static mode to perform backtesting or visual replay with historical setups.
Final Notes
Fair Value Gaps are not a standalone trading signal, but when used with market structure, liquidity, displacement, and order flow concepts, they provide high-probability trade locations that align with institutional-style trading models. This script simplifies the visualization of those zones so you can react faster, stay focused on clean setups, and eliminate unnecessary distractions.
Whether you’re trading high volatility breakouts or patiently waiting for retracements into unfilled imbalances, this tool is designed to support your edge with precision and flexibility.

CandelaCharts - Buyside & Sellside 📝 Overview
The Buyside & Sellside Liquidity Indicator is designed to identify and emphasize one of the foundational concepts within the ICT (Inner Circle Trader) trading methodology: liquidity levels.
This tool focuses on pinpointing key areas in the market where buy-side and sell-side liquidity is concentrated, providing traders with insights into potential price targets, reversal zones, and institutional order flow behavior.
By highlighting these liquidity zones, the indicator serves as a strategic aid in understanding market dynamics and enhancing decision-making in alignment with ICT principles.
📦 Features
Buyside & Sellside Liquidity
Invalidated Liquidity
Threshold
Styling
⚙️ Settings
Liquidity: Controls visibility of Bullish/Bearish Liquidity levels.
Invalidated: Displays the invalidated liquidity levels.
Levels: Controls the number of Liquidity levels that will be displayed.
Line Style: Customize the line style and width.
Threshold: Filter by swing points the Liquidity levels.
Labels: Control the Labels visibility.
⚡️ Showcase
Buyside & Sellside
Invalidated
🚨 Alerts
This script offers alert options for all signal types.
Bearish Signal
A bearish signal is generated when the price reaches a Buyside Liquidity level.
Bullish Signal
A bullish signal is generated when the price reaches a Sellside Liquidity level.
⚠️ Disclaimer
Trading involves significant risk, and many participants may incur losses. The content on this site is not intended as financial advice and should not be interpreted as such. Decisions to buy, sell, hold, or trade securities, commodities, or other financial instruments carry inherent risks and are best made with guidance from qualified financial professionals. Past performance is not indicative of future results.

Volume Intelligence Suite (VIS) v2📊 Volume Intelligence Suite – Smart Volume, Smart Trading
The Volume Intelligence Suite is a powerful, all-in-one TradingView indicator designed to give traders deeper insight into market activity by visualizing volume behavior with price action context. Whether you're a scalper, day trader, or swing trader, this tool helps uncover hidden momentum, institutional activity, and potential reversals with precision.
🔍 Key Features:
Dynamic Volume Zones – Highlights high and low volume areas to spot accumulation/distribution ranges.
Volume Spikes Detector – Automatically marks abnormal volume bars signaling potential breakout or trap setups.
Smart Delta Highlighting – Compares bullish vs bearish volume in real time to reveal buyer/seller strength shifts.
Session-Based Volume Profiling – Breaks volume into key trading sessions (e.g., London, New York) for clearer context.
Volume Heatmap Overlay – Optional heatmap to show intensity and velocity of volume flow per candle.
Custom Alerts – Built-in alerts for volume surges, divergences, and exhaustion signals.
Optimized for Kill Zone Analysis – Pairs perfectly with ICT-style session strategies and Waqar Asim’s trading methods.
🧠 Why Use Volume Intelligence?
Most traders overlook the story behind each candle. Volume Intelligence Suite helps you "see the why behind the move" — exposing key areas of interest where smart money may be active. Instead of reacting late, this tool puts you in position to anticipate.
Use it to:
Validate breakouts
Detect fakeouts and liquidity grabs
Confirm bias during kill zones
Analyze volume divergence with price swings
⚙️ Fully Customizable:
From volume thresholds to visual styles and session timings, everything is user-adjustable to fit your market, timeframe, and strategy.
✅ Best For:
ICT/Smart Money Concepts (SMC) traders
Breakout & reversal traders
Kill zone session scalpers
Institutional footprint followers

[Pandora's Chambers] BUY/SELL Blocks + Strength FCBased on the secret technique of ATTA,
Traditional price action analysis techniques, such as ICT (Inner Circle Trader), are often based on subjective interpretations and frequently miss the true structure of the market according to the Wyckoff method. The " BUY/SELL Blocks + Strength FC" indicator aims to correct this problem by automatically and accurately identifying buy/sell "blocks" according to Wyckoff principles, calculating volume strength, filtering breached blocks, and displaying precise support and resistance levels.
Indicator Highlights
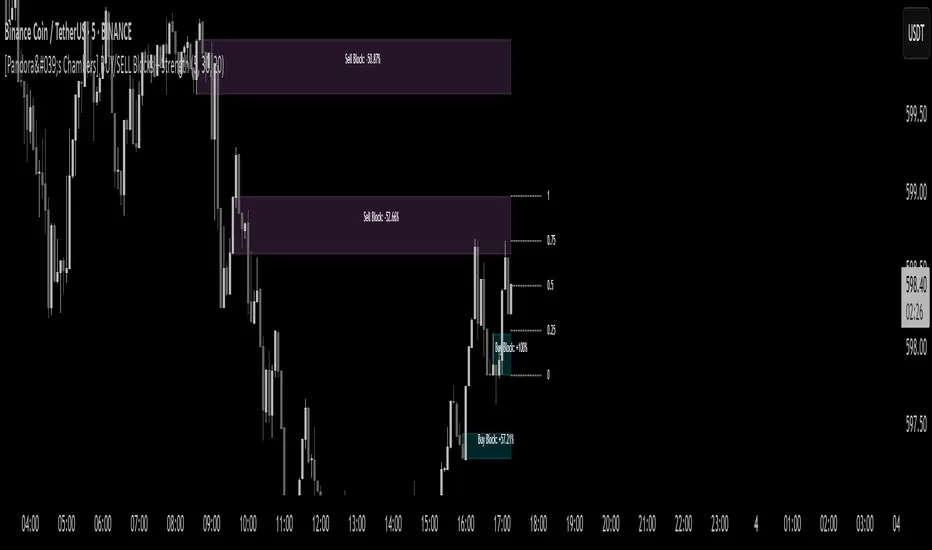
Buy/Sell Blocks Identification
Uses the ta.pivothigh and ta.pivotlow functions to locate upper and lower pivot points, and draws a "box" between the two points to represent the block.
Each block is automatically extended to the right of the chart (can be disabled in settings) for a fixed number of bars or until the end of the chart.
Colors are configurable: turquoise shades for buy blocks, and purple for sell blocks.
Volume Strength Calculation and Update
In each candle, positive volume (in a rising market) or negative volume (in a falling market) is added to the relevant block.
Displays in percentages which side (buyers/sellers) controls the block: a label on the block shows +XX% or -XX%.
Changes the background color of the box to gray when the net volume flips (e.g., a strong sell block receives a net positive).
Filtering Breached Blocks
Option to automatically filter and remove blocks where the price has closed above the top of the sell block or below the bottom of the buy block, in order to maintain a clean and focused chart.
"Adjusted" Fibonacci Grid
In the last calculated bars, the indicator identifies the nearest high support level (sup) and the nearest low resistance level (res) among all existing blocks.
Based on sup and res, a Fibonacci grid of 0%, 25%, 50%, 75%, and 100% is constructed, automatically updating as the chart progresses.
What is so new here?
Accuracy according to Wyckoff and not personal interpretation: In the Wyckoff method, market oscillations are built on supply and demand balances in precise price gaps. Here, each block is built directly on pivots from a number of bars back, and not on feelings of an "area" as is sometimes done in ICT techniques.
Quantitative measurement of control: The indicator does not settle for a visual identification of a block but calculates for each block the buy volume versus the sell volume, and clearly displays who is in control.
Automatic filtering to maintain relevance: Breached blocks are removed, so only the strong areas that have not yet been closed remain.
Full integration with modern price action: Understanding price movement is measured here objectively, leaving no room for subjective interpretations of "structure breaks" or "diagonal waves" that standard tools do not support.
Why is the existing price action not enough?
Inconsistency in defining supply and demand zones: Many techniques rely on manual marking of "buy zones" only, without fixed criteria (number of bars back, low highs, volume, etc.).
Scarcity of quantitative indicators: Without calculating net volume, it is difficult to know if a particular block is truly supported by the power of buyers or sellers.
Net invalidation of blocks that have been violated: Repeated breaches of support and resistance areas below/above their boundaries confuse the trader, while here they are automatically removed.
The " BUY/SELL Blocks + Strength FC" indicator comes to correct all these shortcomings, and provides the user with an objective, accurate, and quantitative framework for understanding the dynamics of the market and identifying volume-based support and resistance areas, according to the principles of the Wyckoff method.
TJR SEEK AND DESTROYTJR SEEK AND DESTROY – Intraday ICT Trading Tool
Built for day traders, TJR SEEK AND DESTROY combines Smart Money concepts like order blocks, fair value gaps, and liquidity sweeps with structure breaks and daily bias to pinpoint high-probability trades during US market hours (9:30–16:00). Ideal for scalping or intraday strategies on stocks, futures, or forex.
What Makes It Unique?
Unlike standalone ICT indicators, this script integrates:
Order Blocks with volume and range filters for precise support/resistance zones.
Fair Value Gaps (FVG) to spot pre-market price imbalances.
Break of Structure (BOS) and Liquidity Sweeps for trend and reversal signals.
A 1H MA-based Bias to align trades with the day’s direction.
BUY/SELL Labels triggered only when bias, BOS, and sweeps align, reducing noise.
How Does It Work?
Order Blocks: Marks zones with high volume (>1.5x 20-period SMA) and low range (<0.5x ATR20) as teal boxes—potential reversal points.
Fair Value Gap: Compares the prior day’s close to the current open (pre- or post-9:30), shown as a purple line and label (e.g., "FVG: 0.005").
Pivot Point: Calculates (prevHigh + prevLow + prevClose) / 3 from the prior day, plotted as an orange line for equilibrium.
Break of Structure: Detects crossovers of 5-bar highs/lows (gray lines), marked with red triangles.
Liquidity Sweeps: Tracks breaches of the prior day’s high/low (yellow lines), marked with yellow triangles.
Daily Bias: Uses 1H close vs. 20-period MA (blue line) for bullish (green background), bearish (red), or neutral (gray) context.
Signals: BUY (green label) when bias is bullish, price breaks up, and sweeps the prior high; SELL (red label) when bias is bearish, price breaks down, and sweeps the prior low.
How to Use It
Setup: Apply to 1M–15M charts for US session trading (9:30–16:00 EST).
Trading:
Wait for a BUY label after a yellow sweep triangle above the prior day’s high in a green (bullish) background.
Wait for a SELL label after a yellow sweep triangle below the prior day’s low in a red (bearish) background.
Use order blocks (teal boxes) as support/resistance for stop-loss or take-profit.
Markets: Best for SPY, ES futures, or forex pairs with US session volatility.
Underlying Concepts
Order Blocks: High-volume, low-range bars suggest institutional activity.
FVG: Gaps between close and open indicate imbalance to be filled.
BOS & Sweeps: Price breaking key levels signals momentum or stop-hunting.
Bias: 1H MA filters trades by broader trend.
Chart Setup
Displays order blocks (teal boxes), pivot (orange), open (purple), bias (colored background), BOS/sweeps (triangles), and signals (labels). Keep other indicators off for clarity.

ST -Dashboard Volume MTF , [Sese04]User Guide: ST - Dashboard Volume MTF
Introduction
This script displays a multi-timeframe (MTF) volume dashboard, tracking buy and sell volumes and the moving averages of volume. It is designed for traders using ICT (Inner Circle Trader) and SMC (Smart Money Concepts) to quickly visualize market dynamics across multiple timeframes.
Settings and Features
📌 User Inputs
Customizable settings allow traders to adjust the dashboard display and volume moving averages.
Volume Display per Timeframe
show_vol_1m: Show volume for 1-minute chart.
show_vol_5m: Show volume for 5-minute chart.
show_vol_15m: Show volume for 15-minute chart.
show_vol_1h: Show volume for 1-hour chart.
show_vol_4h: Show volume for 4-hour chart.
show_vol_1d: Show volume for 1-day chart.
Volume Moving Average Settings
ma_length_short: Length of the short-term moving average (default 5 periods).
ma_length_long: Length of the long-term moving average (default 14 periods).
Dashboard Customization
dashboard_position: Dashboard position (Bottom Right, Bottom Left, Top Right, Top Left).
text_color: Text color for the dashboard.
text_size: Text size (small, normal, large).
How the Script Works
🔹 1. Calculating Buy and Sell Volume
The calculate_buy_sell function separates buy and sell volume based on the candle's open and close price:
If the closing price is higher than the opening price → Buy volume 📈.
If the closing price is lower or equal to the opening price → Sell volume 📉.
🔹 2. Retrieving Volume Data Across Multiple Timeframes
The function get_volumes collects buy and sell volume data for different timeframes using request.security().
The available timeframes are: 1m, 5m, 15m, 1h, 4h, and 1d.
🔹 3. Calculating Volume Moving Averages
The script uses ta.sma() to compute moving averages for volume trends:
ma_vol_short: Short-term moving average (e.g., 5 periods).
ma_vol_long: Long-term moving average (e.g., 14 periods).
🔹 4. Creating and Displaying the Dashboard
A table (table.new()) is generated at the last bar (barstate.islast) to display the volume data:
A title “📊 Volume Dashboard (Buy vs Sell)” in purple.
Column headers:
TIMEFRAME (e.g., 1M, 5M, 15M, 1H, 4H, 1D).
BUY VOLUME (dark blue).
SELL VOLUME (dark red).
Buy and Sell Volume values are displayed in their respective cells for easy reading.
How to Use This Script on TradingView?
Adding the Script
Open TradingView.
Go to Pine Editor and paste the script.
Click "Add to Chart".
Configuring the Settings
Open the indicator settings.
Enable/disable the desired timeframes.
Adjust the moving average lengths if necessary.
Interpreting the Data
Increasing buy volume across timeframes may indicate bullish momentum.
Rising sell volume suggests a bearish reversal.
Crossovers of volume moving averages can help detect market shifts.
Conclusion
This script is a powerful tool for analyzing volume dynamics across multiple timeframes. It provides a quick overview of the balance between buyers and sellers, essential for ICT scalping and liquidity-based trading.
🚀 Pro Tip: Combine this dashboard with other SMC indicators (engulfing candles, pivot points) to refine your trading decisions.

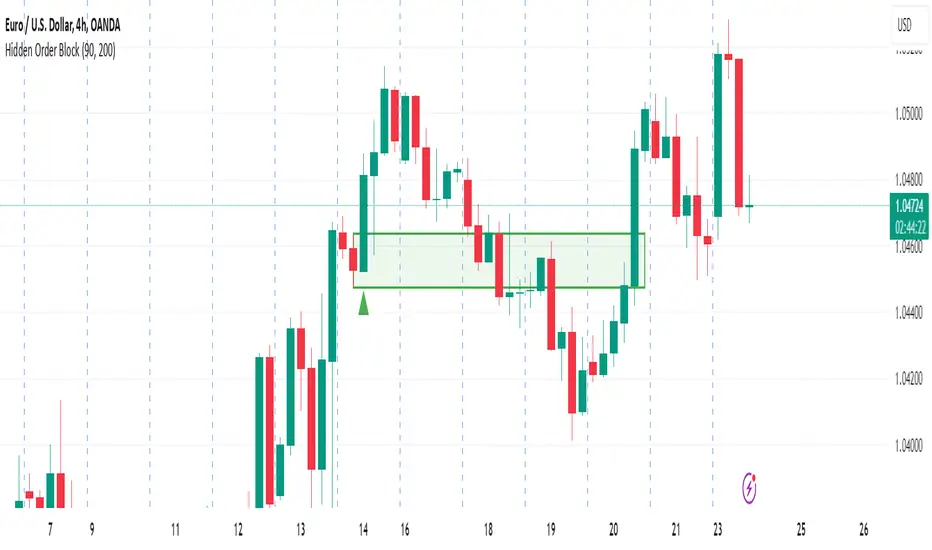
Hidden Order BlockThe Crystal Order Block Indicator is designed to help traders identify institutional order blocks with precision and reliability. By analyzing price action and volume behavior, this tool highlights high-probability zones where smart money has likely placed orders.
🔹 Key Features:
✅ Automated Order Block Detection – Identifies valid bullish & bearish order blocks based on price structure and volume dynamics.
✅ Unmitigated Order Block Filtering – Highlights fresh order blocks that haven’t been tapped, helping traders find high-probability trade setups.
✅ Smart Money Concepts (SMC) & ICT-Based Logic – Uses institutional trading principles to refine entry and exit points.
✅ Multi-Timeframe Compatibility – Works effectively on all timeframes, making it suitable for scalping, intraday, and swing trading.
✅ Customizable Alerts – Stay notified when a new order block forms, ensuring you never miss an opportunity.
✅ Risk Management Enhancement – Helps traders set precise stop-loss and take-profit levels based on institutional trading zones.
📌 How It Works:
The indicator scans price movements and detects areas where significant buying or selling pressure occurred, forming institutional order blocks. It then checks for mitigated vs. unmitigated order blocks, ensuring only the most relevant zones are displayed.
✔️ Bullish Order Blocks: Marked when a strong buying zone is detected, often acting as support.
✔️ Bearish Order Blocks: Identified in areas of strong selling pressure, often acting as resistance.
The indicator is optimized for Smart Money trading strategies, making it a valuable tool for traders who follow ICT, SMC, and VSA concepts.
🎯 How to Use It Effectively:
🔹 Entry Strategy: Wait for price to retest a fresh order block and confirm entry with additional confluences (e.g., volume spikes, price action signals).
🔹 Exit Strategy: Use order blocks as take-profit targets or stop-loss levels, improving risk-reward ratios.
🔹 Timeframe Recommendation: Best results on M30 and higher, but can be used on lower timeframes with additional confirmations.
🚀 What’s New in the Updated Version?
🔹 More Accurate Order Block Detection – Improved filtering for better precision.
🔹 Mitigation Tracking – Helps traders focus on fresh order blocks for higher success rates.
🔹 Better Visualization – Enhanced clarity for quick decision-making.
This indicator is a must-have for traders who want to trade like institutions and refine their trading strategy using smart money concepts.
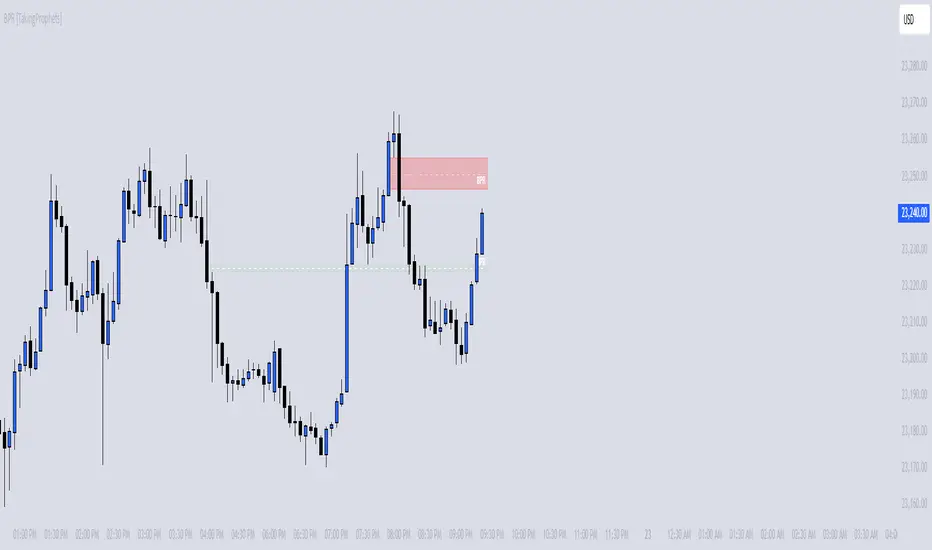
BPR [TakingProphets]The BPR (Balanced Price Range) Indicator by Taking Prophets is built for traders who follow ICT (Inner Circle Trader) concepts and smart money strategies. In ICT methodology, a Balanced Price Range (BPR) occurs when price rapidly moves in one direction, creating an imbalance that often gets revisited before price continues its trend. These areas represent inefficiencies in the market where liquidity was not properly distributed, making them key zones for potential retracements and trade setups.
How the Indicator Works:
🔹 Automatically Detects BPRs – No need to manually mark imbalances; the indicator highlights them for you.
🔹 Helps Identify Smart Money Footprints – Spot areas where price is likely to retrace and rebalance liquidity.
🔹 Customizable Sensitivity – Adjust detection parameters based on your preferred trading style.
🔹 Works Across All Markets – Apply it to Forex, Futures, Crypto, and Stocks on TradingView.
🔹 Clean and Intuitive Interface – Designed to be simple yet powerful for both new and experienced traders.
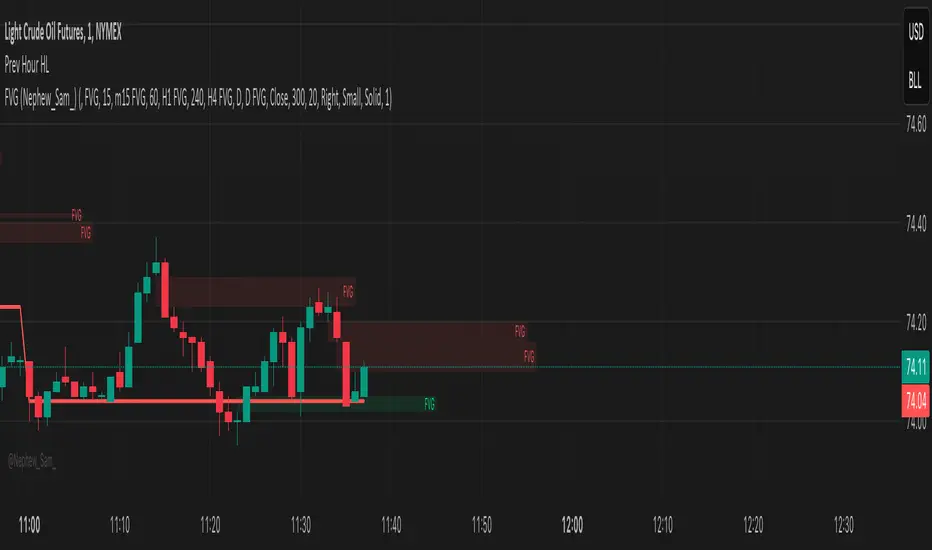
Previous Hour High and Low### **🔷 Previous Hour High & Low Indicator – Description**
#### 📌 **Overview**
The **Previous Hour High & Low Indicator** is designed to help traders identify key levels from the last completed hourly candle. These levels often act as **support and resistance zones**, helping traders make informed decisions about potential breakouts, reversals, and liquidity grabs.
#### 🎯 **How It Works**
- At the start of every new hour, the indicator **locks in** the **high and low** from the **previous fully completed hour**.
- It then **draws horizontal lines** on the chart, marking these levels.
- Works **only on intraday timeframes** (e.g., 1m, 5m, 15m, 30m), ensuring clean and relevant levels.
- Updates dynamically **every new hour** without repainting.
#### 🔑 **Why Is This Useful?**
✔ **Identifies Key Liquidity Zones** – The market often reacts to previous hour highs/lows, making them useful for stop hunts, liquidity grabs, and order block setups.
✔ **Works Well with ICT Concepts** – If you're trading **ICT kill zones**, these levels can help in finding optimal trade entries.
✔ **Helps with Breakout & Rejection Setups** – Traders can watch for price breaking or rejecting these levels for trade confirmation.
✔ **Useful for Scalping & Day Trading** – Works best for short-term traders looking for intraday movements.
#### ⚙ **Customization Options**
- The high and low levels are color-coded:
🔵 **Previous Hour High (Blue)** → Acts as potential resistance or breakout point.
🔴 **Previous Hour Low (Red)** → Acts as potential support or breakdown level.
#### 📊 **Best Timeframes to Use This On**
- **1-minute, 5-minute, 15-minute, 30-minute charts** → Most effective for intraday trading.
- Avoid using on **hourly or higher timeframes**, as these levels become less relevant.
---
🚀 **This indicator is perfect for traders looking to track short-term price reactions at key levels.** Let me know if you want to add alerts, zone shading, or any other enhancements! 🔥
LRLR [TakingProphets]LRLR (Low Resistance Liquidity Run) Indicator
This indicator identifies potential liquidity runs in areas of low resistance, based on ICT (Inner Circle Trader) concepts. It specifically looks for a series of unmitigated swing highs in a downtrend that form without any bearish fair value gaps (FVGs) between them.
What is an LRLR?
- A Low Resistance Liquidity Run occurs when price creates a series of lower highs without any bearish fair value gaps in between
- The absence of bearish FVGs indicates there is no significant resistance in the area
- These formations often become targets for smart money to collect liquidity above the swing highs
How to Use the Indicator:
1. The indicator will draw a diagonal line connecting a series of qualifying swing highs
2. A small "LRLR" label appears to mark the pattern
3. These areas often become targets for future price moves, as they represent zones of accumulated liquidity with minimal resistance
Key Points:
- Minimum of 4 consecutive lower swing highs
- No bearish fair value gaps can exist between these swing highs
- The diagonal line helps visualize the liquidity run formation
- Can be used for trade planning and identifying potential reversal zones
Settings:
- Show Labels: Toggle the "LRLR" label visibility
- LRLR Line Color: Customize the appearance of the diagonal line
Best Practices:
1. Use in conjunction with other ICT concepts and market structure analysis
2. Pay attention to how price reacts when returning to these levels
3. Consider these areas as potential targets for smart money liquidity grabs
4. Most effective when used on higher timeframes (4H and above)
Note: This is an educational tool and should be used as part of a complete trading strategy, not in isolation.

Time-Based VWAP (TVWAP)(TVWAP) Indicator
The Time-Based Volume Weighted Average Price (TVWAP) indicator is a customized version of VWAP designed for intraday trading sessions with defined start and end times. Unlike the traditional VWAP, which calculates the volume-weighted average price over an entire trading day, this indicator allows you to focus on specific time periods, such as ICT kill zones (e.g., London Open, New York Open, Power Hour). It helps crypto scalpers and advanced traders identify price deviations relative to volume during key trading windows.
Key Features:
Custom Time Interval:
You can set the exact start and end times for the VWAP calculation using input settings for hours and minutes (24-hour format).
Ideal for analyzing short, high-liquidity periods.
Dynamic Accumulation of Price and Volume:
The indicator resets at the beginning of the specified session and accumulates price-volume data until the end of the session.
Ensures that the TVWAP reflects the weighted average price specific to the chosen session.
Visual Representation:
The indicator plots the TVWAP line only during the specified time window, providing a clear visual reference for price action during that period.
Outside the session, the TVWAP line is hidden (na).
Use Cases:
ICT Scalp Trading:
Monitor price rebalances or potential liquidity sweeps near TVWAP during important trading sessions.
Mean Reversion Strategies:
Detect pullbacks toward the session’s average price for potential entry points.
Breakout Confirmation:
Confirm price direction relative to TVWAP during kill zones or high-volume times to determine if a breakout is supported by volume.
Inputs:
Start Hour/Minute: The time when the TVWAP calculation starts.
End Hour/Minute: The time when the TVWAP calculation ends.
Technical Explanation:
The indicator uses the timestamp function to create time markers for the session start and end.
During the session, the price-volume (close * volume) is accumulated along with the total volume.
TVWAP is calculated as:
TVWAP = (Sum of (Price × Volume)) ÷ (Sum of Volume)
Once the session ends, the TVWAP resets for the next trading period.
Customization Ideas:
Alerts: Add notifications when the price touches or deviates significantly from TVWAP.
Different Colors: Use different line colors based on upward or downward trends.
Multiple Sessions: Add support for multiple TVWAP lines for different time periods (e.g., London + New York).

Raiks 3am Model & NQ MacrosThis indicator marks the 2 am candle (which is where we start our trading session and look for entries), and the 3 am candle with a dynamic background color feature. If the 3 am candle is bullish the background will be green. If the 3 am candle is bearish, the background will be red.
The 2 am candle Is there to make it easier to backtest and forward test when the trading session begins for this 3 am model. E.g. if at 2:10 you see a big bearish imbalance, you can enter off the retest/fill of the imbalance and target the nearest lows/highs imbalances or key levels on the left of the chart before 2 am aka the asian session range.
The significance of the 3 a.m. candle is a key part of my 3 a.m. model. Looking at the 5-minute chart only, If the 3 a.m. candle is bullish, then our market bias for the rest of the day is also bullish, and starting from the 3 am candle (once it has closed), we should look for bullish entry setups—and vice versa.
For Nasdaq or S&P500 only: If no setups can be found between 3 am and 9 am New York time (UTC-5), then look for entry setups within the ICT NY Macro timezones using the ICT market maker sell model (if we are bearish and looking for sells) or the market maker buy model (if we are bullish and looking for buys).
PS: This Strategy only requires you to use the 5-minute chart, starting from the 2 am candle up to the end of the trading day for entries and exits. Optionally, you can scale down to a 1-minute chart to refine your entries even better.
Backtest this model and you'll be surprised at how powerful the 3 am candle Is at determining daily bias!
Have Fun using this indicator :)
Made with love by Raik aka Don Raul aka Neon

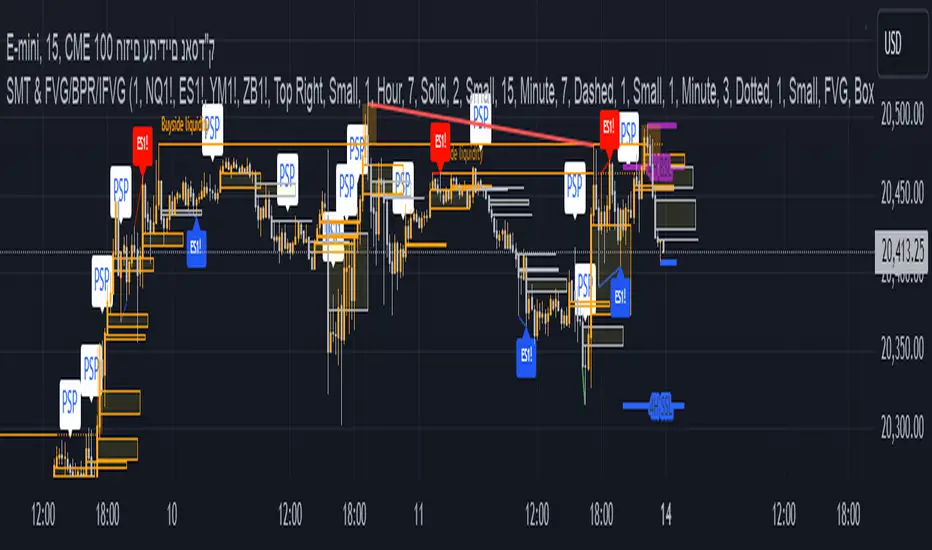
The Ultimate Indicator by ATK
The Ultimate Indicator By ATK
This all-in-one trading indicator integrates multiple advanced tools to provide ICT traders with deep insights into market structure, liquidity zones, Fair Value Gaps (FVG), and AI-powered signals. Whether you’re a scalper or a long-term trader, this indicator offers real-time analysis and helps identify potential trading opportunities in dynamic markets.
🔵 Key Features
🔹 2 options for checking SMT (Separation and Divergence) Detection:
First - Compares highs and lows of a primary symbol (e.g., NQ1!) with a user-defined comparison symbol (e.g., ES1!).
Automatically detects and visualizes discrepancies (red for highs, blue for lows) between the symbols.
Offers customizable comparison settings and alerts for divergence detection.
Second -
Real-time SMT comparison between two tickers - red/green lines.
🔹 Market Structure Change (MSS) & Break of Structure (BOS) Detection:
Identifies market structure shifts and breakouts, crucial for spotting potential reversals.
Customizable sensitivity and length settings to adapt to various market conditions and trading strategies. Use 3 different timeframes on the same chart.
🔹 Buy Side & Sell Side Liquidity Zones:
Highlights liquidity zones on both buy and sell sides, offering a clear view of market pressure points.
Configurable settings for detection length, margin, and alert conditions for liquidity sweeps like the 15-minute Buy Side Liquidity (BSL) and Sell Side Liquidity (SSL).
These lines from Swing Highs & Lows:
Automatically plots horizontal lines at the most recent swing highs and lows.
Lines are removed once the closing price breaches these levels, ensuring real-time updates and clean charting.
🔹 Fair Value Gap (FVG) Detection:
Detects FVG formations on 5-minute and 1-minute charts, making it ideal for scalpers capturing liquidity gaps.
Includes directional arrows and customizable alerts based on higher and lower timeframe FVG analysis, helping traders time their entry and exit points.
🔹IFVG (Inverse fair value gap) - yellow
🔹IFVG + SMT - Light blue
🔹IFVG + SMT + HTF FVG - green/red (1 min only)
🔹IFVG + SMT + BSL/SSL Swept - green/red (1 min only)
for example:
🔹 Capture and plot significant price levels at specific times throughout the trading day:
TDO (True Day Open): The price at which a market opens at 12:00 AM US.
TMSO (True Micro Session Open): The open price of the Q2 of the micro session.
RVT (Revolving True Open): The price recorded at 12:00 PM US.
AO (Asia True Open Price): The price captured at 7:30 PM US, specifically representing the opening price of the Asian session.
LO (London True Open Price): 1:30 AM US
AM (New York Session - Afternoon Market True Open Price): 7:30 AM US
PM (Post Market Open Price): 1:30 PM US.
For example TMSO:
🔹 AI-Powered Entry Detection:
The script helps identify entry points based on specific candle patterns, while also considering the exponential moving averages (EMAs) for trend confirmation.
🔶FFMS Strategy: (First Five Minute Strategy)
Check 5-min time frame if the price is between the high and low of the previous day. then, when NYO if there is retest on the High/Low on the 5-min chart after crossover or crossunder the 5 minute first candle high/low lines.
🔶PSP & PSP + FVG
🔹The Precision Swing Point (PSP). It helps you visually identify price decorrelation (type of SMT) among key futures contracts (NQ/ES or NQ/ES/YM/ZB) and set alerts for these significant market movements.
🔹The PSP HTF 15 Min + FVG LTF 1 Min
In this strategy the script is looking for PSP in HTF (15-Min) and capture the FVG in LTF (1-Min) only if its between High and Low of the PSP.
If there is a retracement in parallel micro session time, for example: Q1 with Q3 or Q2 with Q4, Q3 with Q1, etc…
if the retracement was happened and the price close above/below the high/low of the FVG from the LTF that captured according to the direction for long/short, it plots an arrow.
Update the script that checks the purple arrows and shows all of them each time there is a new PSP in a 15-minute timeframe and then FVG in 1 Min timeframe with the reference to the TDO/TMSO/Open session
for example:
Step 1: PSP 15Min LOW/HIGH Lines look for FVG by the conditions above - purple arrow
Step 2:FVG founded - purple arrow
SMT Fill on 15 min timeframe + IFVG 1 min - Detected option:
When Sym1 closed above/below FVG and Sym2 didn't it is SMT FILL (15 Min timeframe)
White arrows when captured SMT FIll + IFVG:
option to turn on alert on this strategy too.
🔹Detect liquidity swept on 15-min timeframe by $$ - green/red
🔹Detect liquidity to sweep zones on by diamonds - green/red
🔹Alerts for all Events and full scenarios.
Real-time notifications ensure traders can act quickly on potential trade setups.
🔵 Conclusion:
This Ultimate Indicator by ATK brings together critical elements of market analysis in one tool for ICT traders, offering real-time insights, alerts, and visual aids to enhance trading strategies. Whether you’re focused on short-term price action or long-term market trends, this indicator provides the tools necessary for informed decision-making and improved trading performance.
Macro Times [Blu_Ju]About ICT Macro Times:
The Inner Circle Trader (ICT) has taught that there are certain time sessions when the Interbank Price Delivery Algorithm (IPDA) is running a macro. The macro itself could be a repricing macro, a consolidation macro, etc. - this depends on where price currently is in relation to its draw. The times the macro is active do not change however, and are always the following (in New York local time):
8:50-9:10 (premarket macro)
9:50-10:10 (AM macro 1)
10:50-11:10 (AM macro 2)
11:50-12:10 (lunch macro)
13:10-13:40 (PM macro)
15:15-15:45 (final hour macro)
Because these times are fixed, traders can anticipate a setup is likely to form in or around these sessions. Setups may involve sweeps of liquidity (highs/lows), repricing to inefficiencies (e.g., fair value gaps), breaker setups, etc. (The specific setup involved is beyond the scope of this script; this script is concerned with visually marking the time sessions only.)
About this Script:
The scope of this script is to visually identify the macro active time sessions. This script draws vertical lines to mark the start and end of the macro time sessions. Optionally, the user can use a background color for the macro session with or without the vertical lines. The user can also toggle on or off any of the macro sessions, if he or she is only interested in certain ones. The user also has the freedom to change the times of the macro sessions if he or she is interested in a different time.
What makes this script unique is that it plots the macro time sessions after midnight for each day, before the real-time bar reaches the macro times. This is advantageous to the trader, as it gives the trader a visual cue that the macro times are approaching. When watching price it is easy to lose track of time, and the purpose of this script is to help the trader maintain where price is in relation to the macro time sessions in a simple, visual way.

OHLC Statistical Mapping [Pro+] (Joshuuu)Description:
Dive into the intricate world of candlestick analysis with the OHLC Statistical Mapping Pro+! This collaboration with Joshuuu offers a closer look into the historical data of specific candles within an analyst’s chosen timeframe, providing insights for future time and price delivery. Incorporate this interactive tool into your Tradingview templates and revolutionize your strategies with data. This advanced indicator goes beyond conventional OHLC representation, incorporating the principles of Inner Circle Trader (ICT) to explore accumulation, manipulation, and distribution candle-by-candle.
ICT traders identify manipulation as the wick opposing to the candle’s close. Analysts can observe manipulation legs seen as a movement to trap market participants in the "wrong" direction, to anticipate a candle's distribution.
When price distributes, it expands for higher or lower prices. Analysts can therefore note distribution levels for a draw on liquidity, retracement, or reversal.
These levels will provide important information about orderflow when price trades through them and the sequence in which the delivery occurs.
Additionally, to amplify the price mapping, this tool plots the average Time at which its manipulation and distribution phases should complete. This feature allows traders to utilize historical Timings in conjunction with the price levels of manipulation and distribution.
As with any historical data driven tool, analysts should not expect past behaviour to match future performance. This tool was created with a data driven edge to bring attention to when candles are likely to turn after their manipulations, or retrace after completing set distributions.
Key Features:
Average Range Precision: Visualize candlestick data through a sophisticated line and label-based format, facilitating the identification of your manipulation, distribution, and time pivots. Enhance your comprehension of market volatility by graphing the average range of your selected candle timeframe. This metric acts as a compass, steering you towards potential support and resistance areas.
Tailored Timeframe Selection: Tailor your analysis by choosing a specific time frame that aligns with your trading strategy, enabling a focused exploration of the candle’s manipulation, distribution, and time in which both levels are hit.
Real-time Information Flow: Monitor market developments with instantaneous updates on candlestick statistics. Each candle updates the script with latest OHLC information providing continuous historical data computations, even on timeframes sub 1 minute.
Historical Mapping:
Easily backtest previous mappings by enabling the historical mapping feature. This feature allows traders to revisit and analyze past market scenarios, offering a valuable tool for refining and validating trading strategies. Choose to show historical labels or remove them, giving ultimate flexibility for journaling.
User-Intuitive Interface: Navigate effortlessly through the tool's interface, designed to accommodate advanced traders with keen passion for data driven precision. Effortlessly customize the display settings to match your preferences, ensuring a seamless and personalized experience.
Usage Guidance:
Add OHLC Statistical Mapping Pro to your Tradingview chart.
Choose up to 5 timeframes for the mapping to plot on your chart, be sure to adjust your style and visual preferences to differentiate the timeframes’ levels.
Observe how calculated manipulation, distributions, and delivery times align together with predetermined analysis.
Leverage this information with other models and insights to create a stronger narrative for your analysis
These tools are available ONLY on the TradingView platform.
Terms and Conditions
Our charting tools are products provided for informational and educational purposes only and do not constitute financial, investment, or trading advice. Our charting tools are not designed to predict market movements or provide specific recommendations. Users should be aware that past performance is not indicative of future results and should not be relied upon for making financial decisions. By using our charting tools, the purchaser agrees that the seller and the creator are not responsible for any decisions made based on the information provided by these charting tools. The purchaser assumes full responsibility and liability for any actions taken and the consequences thereof, including any loss of money or investments that may occur as a result of using these products. Hence, by purchasing these charting tools, the customer accepts and acknowledges that the seller and the creator are not liable nor responsible for any unwanted outcome that arises from the development, the sale, or the use of these products. Finally, the purchaser indemnifies the seller from any and all liability. If the purchaser was invited through the Friends and Family Program, they acknowledge that the provided discount code only applies to the first initial purchase of the Toodegrees Premium Suite subscription. The purchaser is therefore responsible for cancelling – or requesting to cancel – their subscription in the event that they do not wish to continue using the product at full retail price. If the purchaser no longer wishes to use the products, they must unsubscribe from the membership service, if applicable. We hold no reimbursement, refund, or chargeback policy. Once these Terms and Conditions are accepted by the Customer, before purchase, no reimbursements, refunds or chargebacks will be provided under any circumstances.
By continuing to use these charting tools, the user acknowledges and agrees to the Terms and Conditions outlined in this legal disclaimer.
Skrip berbayar

Macro Matrix [Pro+] (DRxICT)Description:
Visualize the intricacies of the financial markets with Macro Matrix, a tool meticulously crafted with insights drawn from the teachings of Inner Circle Trader (ICT), and enhanced by ICT_Concepts.
A Macro is a short list of orders that the Interbank Price Delivery Algorithm (IPDA) will run to determine which liquidity to seek or which inefficiencies to rebalance. ICT traders are taught to focus on these Time windows to frame the clearest narrative and observe defining market behaviour. Traders can use the Macro Matrix to stay alerted about key market timings and price swings that arise during these times.
The Macro Matrix Pro+ brings the power of Macros to new heights thanks to ICT_Concepts’s studies of the market, by taking the price range defined by a Macro Time Window (i.e. 9:50-10:10 AM New York Time), and projecting it above and below the original range creating extensions, similar to DR models. Analysts can use these extensions to measure future price swings as targets, retracement levels, or key reversals.
In addition, analysts have the flexibility to choose different extensions over time. Extend projections until the next Macro, for the next 3 Macros, or even for a whole day. By considering and cross-referencing previous Macros, analysts can gain insights into their potential impact on the market and identify key market pivots.
When news events occur in specific macros on specific days of the week, these time based ranges can offer unique insights. This is particularly true when we consider the different impacts that various days of the week can have on market trends. By analyzing news events that fall within macro time ranges, analysts can gain a deeper understanding of the ranges that influence future market movements.
Key Features:
Day of the Week Filtering: refine your macro selection by implementing a day-of-the-week filter. This feature allows you to precisely tailor your chosen macros, enabling you to identify specific time-based opportunities within the week.
CME_MINI:ES1! Friday Macros only:
Macro Range: choose whether to base your macro range projections on the candle bodies or the wicks, offering you versatile control over your analysis and automate drawings.
CME_MINI:NQ1! Body vs. Wick difference:
Macro Extension: toggle between different extension methods to identify prior macro levels for future opportunities. Select to extend macro lines at intervals of 3, 6, 9 macros, or 1, 2, 3 days.
CME_MINI:NQ1! Different Extension periods:
Automatic Macro Coloring: choose to automatically color the macros based on the relationship of the open and the close or choose a single color to identify the macros and projections. Bullish macros will be colored blue and bearish macros will be colored red by default.
FOREXCOM:EURUSD Note how coloring helps determine narrative throughout the day:
Macro Open, Close, and Range Projections: identify key price levels of algorithmic timings to locate price inefficiencies, liquidity pools of interest, and equilibrium price points of fair value. Easily select these levels, as well as range projections up to 2.5 standard deviations.
CME_MINI:NQ1! Levels legend:
Alert Systems: customize alerts with flexible intervals preceding macro initiation in the market. Craft personalized alerts to stay informed and prepared for future market movements.
Usage Guidance:
Add Macro Matrix to your Tradingview chart.
Tailor your experience by toggling specific Time-based macros and style your perspective to be aligned with your analytical preference.
Observe where and when the market begins its macros, and how projections are utilized to influence macro or micro trends.
Leverage this invaluable information with other models and insights to create a stronger narrative for your analysis.
These tools are available ONLY on the TradingView platform.
Terms and Conditions
Our charting tools are products provided for informational and educational purposes only and do not constitute financial, investment, or trading advice. Our charting tools are not designed to predict market movements or provide specific recommendations. Users should be aware that past performance is not indicative of future results and should not be relied upon for making financial decisions. By using our charting tools, the purchaser agrees that the seller and the creator are not responsible for any decisions made based on the information provided by these charting tools. The purchaser assumes full responsibility and liability for any actions taken and the consequences thereof, including any loss of money or investments that may occur as a result of using these products. Hence, by purchasing these charting tools, the customer accepts and acknowledges that the seller and the creator are not liable nor responsible for any unwanted outcome that arises from the development, the sale, or the use of these products. Finally, the purchaser indemnifies the seller from any and all liability. If the purchaser was invited through the Friends and Family Program, they acknowledge that the provided discount code only applies to the first initial purchase of the Toodegrees Premium Suite subscription. The purchaser is therefore responsible for cancelling – or requesting to cancel – their subscription in the event that they do not wish to continue using the product at full retail price. If the purchaser no longer wishes to use the products, they must unsubscribe from the membership service, if applicable. We hold no reimbursement, refund, or chargeback policy. Once these Terms and Conditions are accepted by the Customer, before purchase, no reimbursements, refunds or chargebacks will be provided under any circumstances.
By continuing to use these charting tools, the user acknowledges and agrees to the Terms and Conditions outlined in this legal disclaimer.

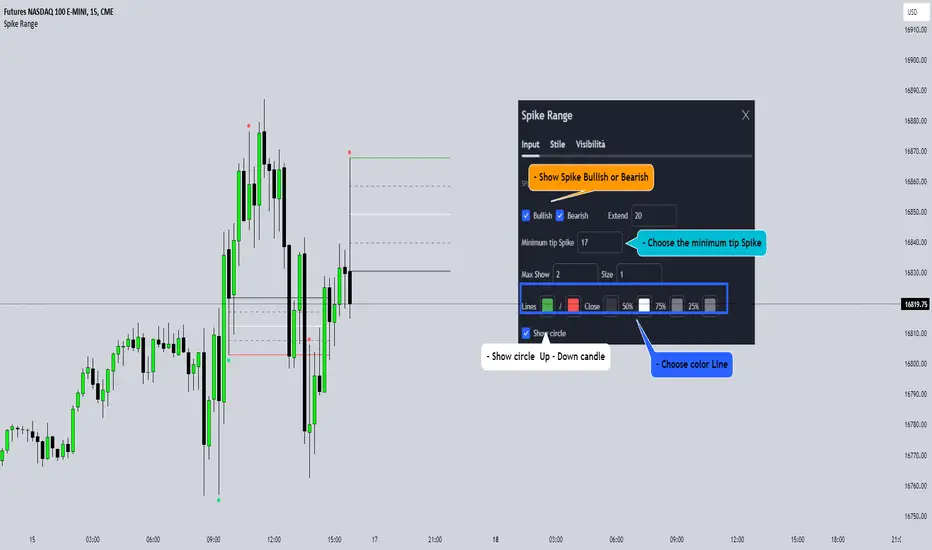
Spike RangeGuided by new ICT tutoring, I create this versatile Spike Range
This indicator shows a different way on how to display "Spikes or Shadows" based on their size,
the indicator divides the "Spike or Shadows" into levels 0.5 - 0.75 - 0.25 Fibonacci, giving the possibility of viewing the "Spike or Shadows" with a certain size and being able to use them as continuation or reversal zones
The user has the possibility to:
- Choose the size of the "Spike or Shadows"
- Choose to view "Spike or Shadows" levels
- Choose to show only bullish or only bearish "Spike or Shadows" levels
The indicator should be used as ICT shows in its concepts.
The indicator takes into account the "Spades or Shadows" that have a certain size (based on the minimum range set)
These Spikes can be rated as "FVG" so you can expect reactions on the levels it marks, considering a reversal or continuation based on the range being respected
If the Spike is Bullish and the Price closes by invalidating 50% of the range we can evaluate a possible entry up to the High of the Spike
Below is an example of how to use them:
Invalidades Range
Respect Range
Seek liquidityGuided by ICT tutoring, I create this versatile "Seek liquidity" indicator.
This indicator shows an easy way to view the Liquidity that has been Created - Eliminated - and what liquidity is left to eliminate.
Liquidity levels appear after the sessions are over, and the lines get stuck on the candle that eliminates them.
Timing session =
//---Asian
- 18:00-00:00
//---London
- 00:00-02:00
- 02:00-05:00
- 00:00-06:00
//---New York
- 06:00-12:00
- 09.30-12.00
//---Lunch
- 12:00-13:30
//---PM
- 1.30pm - 4.00pm
- 12:00-18:00
The user has the possibility to:
- Choose whether or not to view sessions
- Choose to show levels from previous sessions
- Choose to show today's session levels
- Choose whether to view the boxes
- Choose to view the division is open daily
The indicator should be used as ICT shows in its concepts, the indicator takes into consideration both the previous and today's Liquidity, and the session levels can be used for a reversal as in the example below:

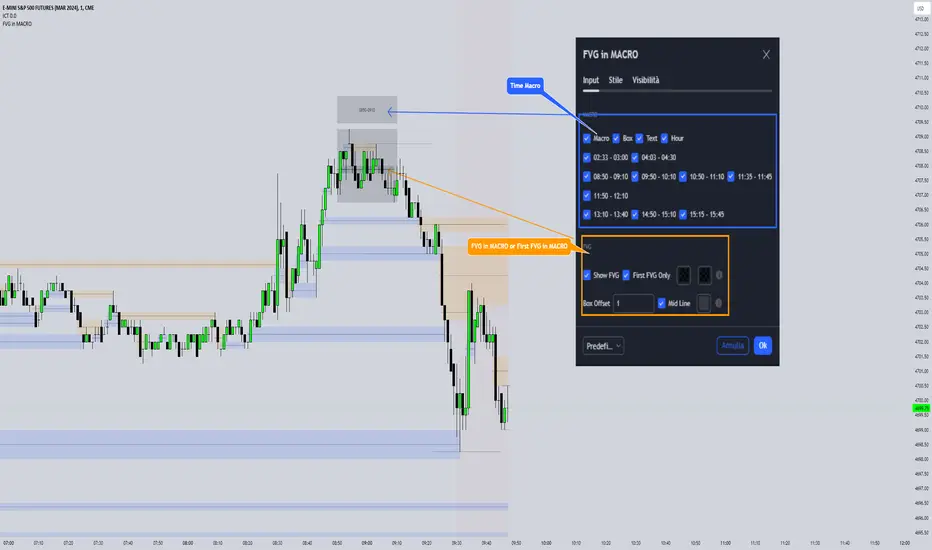
FVG in MACROGuided by ICT tutoring, I created this versatile indicator to scan the FVG in MACRO time.
This indicator combines the MACRO time with the Fair value GAP (FVG) in an alternative way, showing a simple way of viewing the FVG within the MACRO time, so you can have a clearer view of which direction the MACRO is influencing
''MACRO is a delivery time frame of the interbank price in which it undergoes a series of controls and is likely to move towards liquidity.''
The user has the possibility to:
- Choose the relevant MACRO time
- Choose whether to view all FVGs in the MACROS
- Choose to view only the First FVG at each MACRO
The indicator should be used as shown by the ICT in its concepts, during the MACRO time the price can consolidate or can head towards liquidity.
The probability that the direction is correct increases with respect for the FVG, in this way it is possible to evaluate the entry zone in the FVG and the Take profit zone for Liquidity
As in the following example: