ICT iFVG Detector and Alert [by ote618]Description
This script detects ICT - fair value gaps (FVG) formed by price gaps between Candle 1 and Candle 3, then monitors the next 5 candles for an inverse fair value gap (iFVG).
What It Detects
Bullish FVG: When Candle 1 high is below Candle 3 low (BISI)
Bearish FVG: When Candle 1 low is above Candle 3 high (SIBI)
Once an FVG is detected, the script checks the next 5 candles:
A Bullish FVG becomes a Bearish IFVG if price closes below Candle 1 high
A Bearish FVG becomes a Bullish IFVG if price closes above Candle 1 low
Only the first bar that validates the FVG triggers the transition to an IFVG.
Visual Output
A shaded rectangle is plotted to mark the original FVG zone (from Candle 1 to Candle 3)
Color-coded:
Red for Bearish IFVG (validated Bullish IG)
Green for Bullish IFVG (validated Bearish IG)
The rectangle extends from Candle 1 to the validating bar
Alerts
You can receive alerts when an FVG becomes an IFVG:
Configurable to fire only on selected timeframes (1m, 5m, 15m, 60m)
Alerts include the direction and the chart timeframe
Settings
Enable Alerts For Timeframe: Choose which timeframe(s) trigger alerts
This tool helps traders identify inverse FVGs (iFVG), a useful ICT concept.
Cari dalam skrip untuk "ict"

ICT Liquidity Sweep MAX RETRI (ALERT)Strategy Description: SMC + ICT Reversal Sniper | 5-Min | R2 TP
This strategy applies Smart Money Concepts (SMC) and ICT methodology to identify high-probability reversal trades using a clean, rule-based system designed for the 5-minute timeframe.
⸻
Core Logic:
• Liquidity Sweep: Identifies stop hunts beyond recent swing highs/lows using a configurable lookback window.
• Break of Structure (BOS): Validates a directional shift after the sweep.
• Fixed R2 Risk-Reward: Entry is followed by a 2:1 take-profit target. Stop loss is set at the sweep candle’s high/low.
• No Entry Between 8 PM–12 AM NY Time: Avoids the manipulation-prone and illiquid zone.
• Discreet SL Handling: SL hits close trades silently — no labels or visuals.
⸻
Entry Precision & Timing Notes:
• The strategy may occasionally fire before a confirmed liquidity sweep — this is expected. If a sweep occurs later, you may still re-enter toward equilibrium, with take profit also targeted at equilibrium.
• Alerts or trades that trigger near 9:30 AM NY often align with real direction, but this time can be volatile.
• For more reliable and lower-risk entries, focus on the 1:30 PM to 2:00 PM silver bullet window, which tends to produce cleaner setups with more favorable flow. 🖤

ICT FVG & Swing Detector Basic by Trader RiazICT FVG & Swing Detector Basic by Trader Riaz
Unlock Precision Trading with the Ultimate Fair Value Gap (FVG) and Swing Detection Tool!
Developed by Trader Riaz , the ICT FVG and Swing Detector Basic is a powerful Pine Script indicator designed to help traders identify key market structures with ease. Whether you're a day trader, swing trader, or scalper, this indicator provides actionable insights by detecting Bullish and Bearish Fair Value Gaps (FVGs) and Swing Highs/Lows on any timeframe. Perfect for trading forex, stocks, crypto, and more on TradingView!
Key Features:
1: Bullish and Bearish FVG Detection
- Automatically identifies Bullish FVGs (highlighted in green) and Bearish FVGs (highlighted in red) to spot potential reversal or continuation zones.
- Displays FVGs as shaded boxes with a dashed midline at 70% opacity, making it easy to see the midpoint of the gap for precise entries and exits.
- Labels are placed inside the FVG boxes at the extreme right for clear visibility.
2: Customizable FVG Display
- Control the number of Bullish and Bearish FVGs displayed on the chart with user-defined inputs (fvg_bull_count and fvg_bear_count).
- Toggle the visibility of Bullish and Bearish FVGs with simple checkboxes (show_bull_fvg and show_bear_fvg) to declutter your chart.
3: Swing High and Swing Low Detection
- Detects Swing Highs (blue lines) and Swing Lows (red lines) to identify key market turning points.
- Labels are positioned at the extreme right edge of the lines for better readability and alignment.
- Customize the number of Swing Highs and Lows displayed (swing_high_count and swing_low_count) to focus on the most recent market structures.
4: Fully Customizable Display
- Toggle visibility for Swing Highs and Lows (show_swing_high and show_swing_low) to suit your trading style.
- Adjust the colors of Swing High and Low lines (swing_high_color and swing_low_color) to match your chart preferences.
5: Clean and Efficient Design
- Built with Pine Script v6 for optimal performance on TradingView.
- Automatically removes older FVGs and Swing points when the user-defined count is exceeded, keeping your chart clean and focused.
- Labels are strategically placed to avoid clutter while providing clear information.
Why Use This Indicator?
Precision Trading: Identify high-probability setups with FVGs and Swing points, commonly used in Smart Money Concepts (SMC) and Institutional Trading strategies.
User-Friendly: Easy-to-use inputs allow traders of all levels to customize the indicator to their needs.
Versatile: Works on any market (Forex, Stocks, Crypto, Commodities) and timeframe (1M, 5M, 1H, 4H, Daily, etc.).
Developed by Trader Riaz: Backed by the expertise of Trader Riaz, a seasoned trader dedicated to creating tools that empower the TradingView community.
How to Use:
- Add the Custom FVG and Swing Detector to your chart on TradingView.
- Adjust the input settings to control the number of FVGs and Swing points displayed.
- Toggle visibility for Bullish/Bearish FVGs and Swing Highs/Lows as needed.
- Use the identified FVGs and Swing points to plan your trades, set stop-losses, and target key levels.
Ideal For:
- Traders using Smart Money Concepts (SMC), Price Action, or Market Structure strategies.
- Those looking to identify liquidity grabs, imbalances, and trend reversals.
- Beginners and advanced traders seeking a reliable tool to enhance their technical analysis.
Happy trading!

ICT First Presented FVG - NY Open [LuckyAlgo]
This indicator identifies the first Fair Value Gap (FVG) that occurs during the New York trading session, combined with NY session opening price levels. It's an essential tool for traders who follow ICT concepts and focus on the NY trading session.
ICT refers to this as the First Presented FVG, while other traders may call it the 9:30 FVG.
This indicator is best for the 1 minute timeframe, while 5 minute also works.
Detects and marks the first FVG of the NY session
Displays both bullish (green) and bearish (red) FVGs with customizable transparency
Shows the NY session opening price with clear labels
Includes optional vertical line at 9:30 AM NY open
Maintains clean chart visibility with adjustable maximum display days
Includes session date and time labels for easy reference
The indicator helps traders identify potential reversal zones and continuation opportunities by combining two powerful concepts: Fair Value Gaps and NY session opening price. This makes it particularly valuable for day traders and swing traders who want to capitalize on institutional order flow patterns during the most liquid trading session.
You can customize the indicator's appearance, including FVG box colors, time range display, and whether to show the NY open markers. This flexibility allows you to integrate it seamlessly with your existing trading setup.
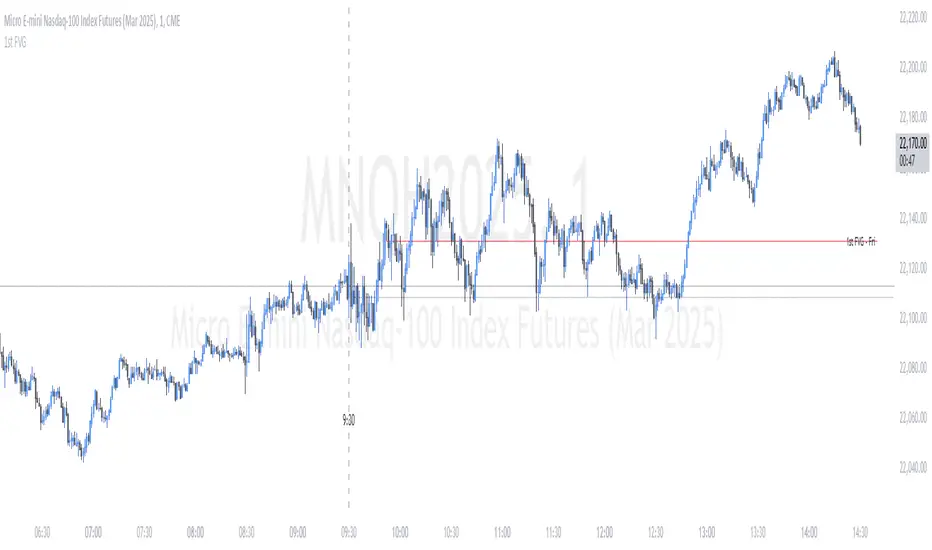
ICT 9:30am First FVGThis indicator is designed based on ICT (Inner Circle Trader)'s algorithmic price action theory, specifically targeting the first fair value gap (FVG) that forms immediately after the New York Stock Exchange opens at 9:30am. The FVG represents an imbalance in the price delivery where a significant price action gap occurs, which can play a crucial role in future price movements.
Features:
Identification of First FVG: Automatically identifies and plots the first fair value gap that forms post the 9:30am NY open.
Customizable Visualization: Choose between block or line styles for visual representation, with customizable colors and border styles.
Date Labeling: Optionally displays date labels for each identified gap to track patterns over time.
Imbalance Extension: Options to extend the imbalances to the current bar, helping to visualize their influence on ongoing price action.
Purpose:
The first fair value gap formed after the market opens is an important algorithmic price range in ICT's price action theory. This indicator simplifies the identification of these critical gaps and helps in understanding their impact on future price action.

ICT Balanced Price Range [TradingFinder] BPR | FVG + IFVG🔵 Introduction
The ICT Balanced Price Range (BPR) indicator is a valuable tool that helps traders identify key areas on price charts where a balance between buyers and sellers is established. These zones can serve as critical points for potential price reversals or continuations.
🟣 Bullish Balanced Price Range
A Bullish BPR forms when a buying pressure zone (Bullish FVG) overlaps with a Bullish Inversion FVG. This overlap indicates a high probability of price moving upwards, making it a crucial area for traders to consider.
🟣 Bearish Balanced Price Range
Similarly, a Bearish BPR is created when a selling pressure zone (Bearish FVG) overlaps with a Bearish Inversion FVG. This zone is often seen as a key area where the price is likely to move downward.
🔵 How to Use
🟣 Identifying the Balanced Price Range (BPR)
To identify the Balanced Price Range (BPR), you must first locate two Fair Value Gaps (FVGs) on the price chart. One FVG should be on the sell side, and the other on the buy side. When these two FVGs horizontally oppose each other, the area where they overlap is recognized as the Balanced Price Range (BPR).
This BPR zone is highly sensitive to price movements due to the combination of two FVGs, often leading to strong market reactions. As the price approaches this area, the likelihood of a significant market move increases, making it a prime target for professional traders.
🟣 Bullish Balanced Price Range (Bullish BPR)
To effectively trade using a Bullish BPR, begin by identifying a bullish market structure and searching for bullish Price Delivery Arrays (PD Arrays). Once the market structure shifts to bullish in a lower time frame, locate a Bullish FVG within the Discount Zone that overlaps with a Bearish FVG.
Mark this overlapping zone and wait for the price to test it before executing a buy trade. Alternatively, you can set a Buy Limit order with a stop loss below the recent swing low and target profits based on higher time frame liquidity draws.
🟣 Bearish Balanced Price Range (Bearish BPR)
For bearish trades, start by identifying a bearish market structure and look for bearish PD Arrays. After the market structure shifts to bearish in a lower time frame, identify a Bearish FVG within the Discount Zone that overlaps with a Bullish FVG. Mark this overlapping zone and execute a sell trade when the price tests it.
You can also use a Sell Limit order with a stop loss above the recent swing high and target profits according to higher time frame liquidity draws.
🔵 Settings
🟣 Global Settings
Show All Inversion FVG & IFVG : If disabled, only the most recent FVG & IFVG will be displayed.
FVG & IFVG Validity Period (Bar) : Determines the maximum duration (in number of candles) that the FVG and IFVG remain valid.
Switching Colors Theme Mode : Includes three modes: "Off", "Light", and "Dark". "Light" mode adjusts colors for light mode use, "Dark" mode adjusts colors for dark mode use, and "Off" disables color adjustments.
🟣 Display Settings
Show Bullish BPR : Toggles the display of demand-related boxes.
Show Bearish BPR : Toggles the display of supply-related boxes.
Mitigation Level BPR : Options include "Proximal", "Distal", or "50 % OB" modes, which you can choose based on your needs. The "50 % OB" line is the midpoint between distal and proximal.
Show Bullish IFVG : Toggles the display of demand-related boxes.
Show Bearish IFV G: Toggles the display of supply-related boxes.
Mitigation Level FVG and IFVG : Options include "Proximal", "Distal", or "50 % OB" modes, which you can choose based on your needs. The "50 % OB" line is the midpoint between distal and proximal.
🟣 Logic Settings
FVG Filter : This refines the number of identified FVG areas based on a specified algorithm to focus on higher quality signals and reduce noise.
Types of FVG filters :
Very Aggressive Filter : Adds a condition where, for an upward FVG, the last candle's highest price must exceed the middle candle's highest price, and for a downward FVG, the last candle's lowest price must be lower than the middle candle's lowest price. This minimally filters out FVGs.
Aggressive Filter : Builds on the Very Aggressive mode by ensuring the middle candle is not too small, filtering out more FVGs.
Defensive Filter : Adds criteria regarding the size and structure of the middle candle, requiring it to have a substantial body and specific polarity conditions, filtering out a significant number of FVGs.
Very Defensive Filte r: Further refines filtering by ensuring the first and third candles are not small-bodied doji candles, retaining only the highest quality signals.
🟣 Alert Settings
Alert Inversion FVG Mitigation : Enables alerts for Inversion FVG mitigation.
Message Frequency : Determines the frequency of alerts. Options include 'All' (every function call), 'Once Per Bar' (first call within the bar), and 'Once Per Bar Close' (final script execution of the real-time bar). Default is 'Once per Bar'.
Show Alert Time by Time Zone : Configures the time zone for alert messages. Default is 'UTC'.
Display More Info : Provides additional details in alert messages, including price range, date, hour, and minute. Set to 'Off' to exclude this information.
🔵 Conclusion
The ICT Balanced Price Range is a powerful and reliable tool for identifying key points on price charts. This strategy can be applied across various time frames and serves as a complementary tool alongside other indicators and technical analysis methods.
The most crucial aspect of utilizing this strategy effectively is correctly identifying FVGs and their overlapping areas, which comes with practice and experience.

ICT Single Candle Order Block (SCOB) [UAlgo]The "ICT Single Candle Order Block (SCOB) " designed for traders who utilize the concept of Order Blocks in their trading strategy. Order Blocks are significant price levels where institutions or smart money have placed their trades, leading to potential future price reactions when these levels are revisited. This indicator focuses on identifying and highlighting Single Candle Order Blocks (SCOBs), allowing traders to visually analyze key price levels on their charts.
🔶 What is Single Candle Order Block (SCOB) ?
A Single Candle Order Block (SCOB) is a specific type of Order Block that is identified based on a single candlestick pattern. These patterns indicate potential areas where significant buying or selling interest has occurred, often leading to a notable price reaction when revisited. In the context of this indicator, a bullish SCOB is identified when a specific bullish candlestick pattern is met, and a bearish SCOB is identified based on a bearish candlestick pattern.
Bullish SCOB: Detected when the open price of two bars ago is higher than its close, the close price of the previous bar is higher than its open, the current close price is higher than the open, the low of the previous bar is lower than the low of two bars ago, and the current close is higher than the high of the previous bar.
Bearish SCOB: Detected when the open price of two bars ago is lower than its close, the close price of the previous bar is lower than its open, the current close price is lower than the open, the high of the previous bar is higher than the high of two bars ago, and the current close is lower than the low of the previous bar.
🔶 Key Features
Show Single Candle Order Block (SCOB): Toggle the visibility of the Single Candle Order Blocks on the chart.
Mitigation Method: Choose between "Close" and "Wick" methods for determining whether a SCOB has been mitigated (price has interacted with the block).
Show Last X SCOBs: Control the number of most recent SCOBs displayed on the chart, allowing you to focus on the most relevant price levels.
Volatility Filter: Enable or disable the volatility filter, which uses the Average True Range (ATR) to filter out less significant SCOBs. When enabled, only SCOBs with an ATR above the mean value of the ATR are displayed.
Customizable Colors: Configure the colors for bullish and bearish SCOBs to enhance visual clarity. The indicator uses cooler RGB values to ensure the blocks are distinct and easily noticeable.
🔶 Disclaimer
The "ICT Single Candle Order Block (SCOB) " indicator is provided for educational and informational purposes only. Trading involves significant risk and may not be suitable for all investors.
Past performance is not indicative of future results. Users should use this indicator in conjunction with their own research and trading strategy.

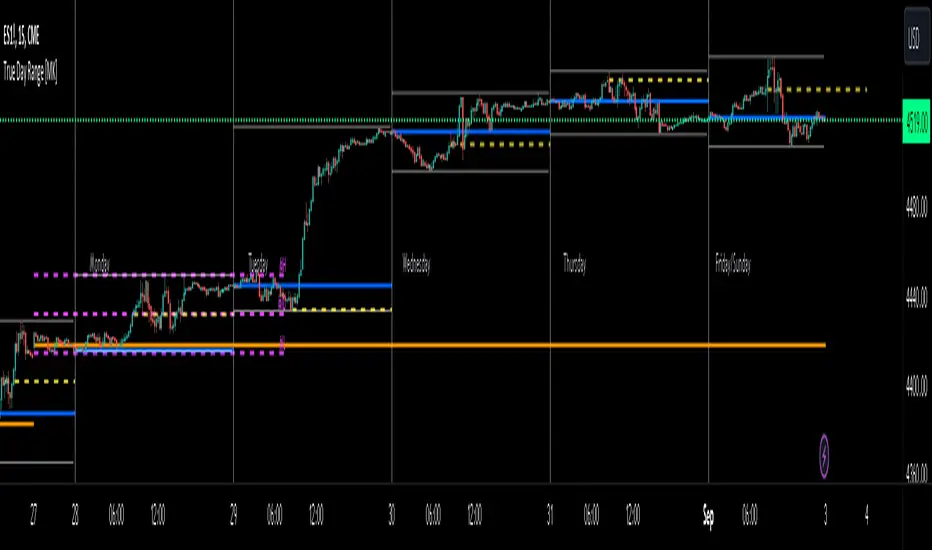
ICT True Day Range [MK]The indicator displays the following:
Vertical line day separator from 00:00 to 00:00 EST
High/Low lines for the days true range from 00:00 to EOD
Opening line from 00:00 EST to EOD
Opening line from 08:30 EST to EOD
Weekly Opening line from Sunday open at 18:00 EST to last bar in the week
Monday range high/low/mid line, which can be extended to EOW
Text displaying Days of the Week
All functions can be fully customized regarding color/style and line width.
Below shows image of indicator with day separator: (it didn't show on the main chart despite being enabled?)
All of the above are to be used to give the user all the tools necessary to analyze the following concepts which can be studied on ICTs you tube channel:
Weekly profile, eg, has the weekly manipulated below the weekly open to then rise the rest of the week?
Daily profile, eg, has the day manipulated below the daily open (00:00 EST) to then rise the rest of the day?
Daily liquidity grab, eg has the current day taken PDH/PDL at the start of the current day?
Daily targets, eg will the current day end up taking liquidity from the PDH/PDL?
Monday range, will Mondays high/low range act as the accumulation phase of the weekly AMD profile?
Tuesday/Wednesday/Thursday/Friday reversal, eg, does a day of the week line up with a HTF target and a high volatility news event which could see price reverse after the manipulation phase of the weekly AMD profile?
In strong trending markets, will the 0830 open line be used in the NY session as manipulation reference in the same manner as the 00:00 line is normally used?
The above examples of how the indicator 'could' be used are not the only ways to use the indicator.
The indicator is by no means a trading strategy on its own. Users should be fully aware of ICT concepts and have performed extensive back-testing before using the indicator with live accounts.
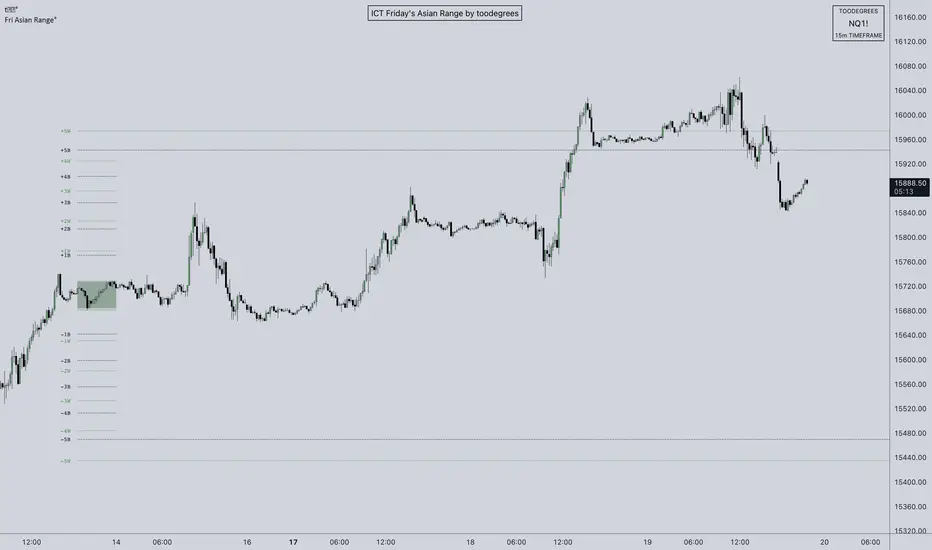
ICT Friday's Asian Range°This concept was engineered and taught by the Inner Circle Trader .
The goal of this script is to outline a potential draw on liquidity for the next trading week. It gives a parameter for ICT PD Arrays to be located above and below the marketplace and should be used in conjunction with the higher Timeframe Arrays as defined by ICT.
If there is a higher Timeframe array with a standard deviation confluence of the Friday Asian Range it is considered high probability for price to reach up/down to that level, and present a potential retracement or reversal.
The Asian Range is defined as the window of Time between 7PM to Midnight New York Time. In this case we will be only using the Friday's Asian Range which will take place on Thursday between these Times.
We have two ranges: a Body range made of the highest and lowest candle bodies, and a Wick range made by the highest and lowest candle wicks.
ICT teaches that we only want to apply this concept to the 5minute and 15minute chart.
THIS SCRIPT WILL NOT WORK ON ANY OTHER TIMEFRAME OUT OF THE BOX
Framework:
Visualization:
Example:
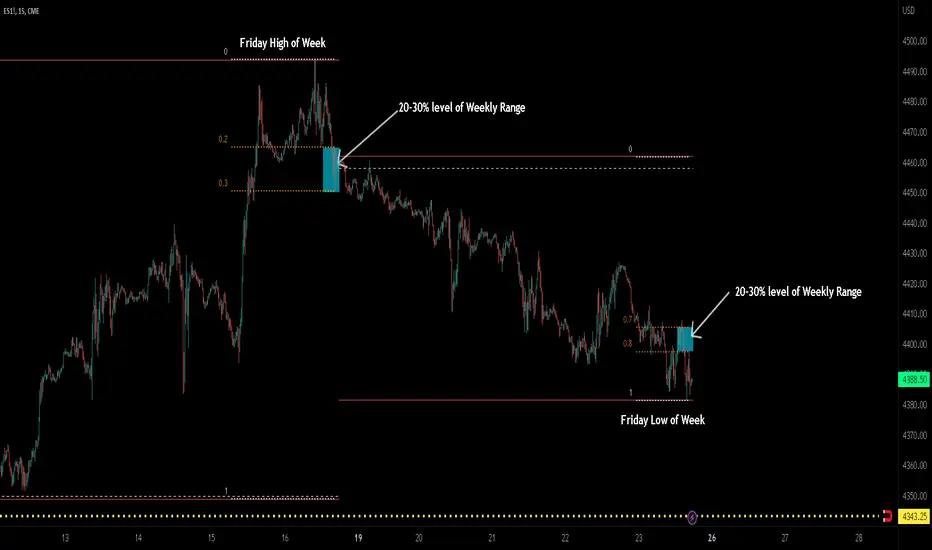
ICT TGIF_V2 [MK]The ICT T.G.I.F (Thank God Its Friday) works on the following strategy:
1. Friday makes the High/Low of the Week.
2. The Weekly High/Low range is used to calculate 20-30% levels. (see chart above)
3. Trades are taken in the Friday PM session (NY EST) with the idea that price may retrace to the 20-30% level.
The indicator plots the following levels:
1. Week High
2. Week Low
3. Week Open
3. 20-30% level in upper part of weekly range (only shows if Friday has made the high of the week)
4. 20-30% level in lower part of weekly range (only shows if Friday has made the low of the week)
It is possible to show all historical levels listed above for the purpose of back-testing the TGIF strategy.
Also it is possible to disable all the historical and current levels, in which case only the 20-30% levels will show when Friday has made the Week High/Low (the 20-30% level only shows from 1200-1600 on Friday to keep charts as clean as possible.
Users of this script, and any script for that matter, should always do proper back-testing before taking any trades.
Many thanks should be given to ICT (The Inner Circle Trader) for bringing this strategy to the trading community.
Below shows indicator with all levels turned ON
Below shows indicator with all levels turned OFF (this allows for cleaner charts)
ICT Opening Gaps [MK]
The indicator plots levels which can act as magnets to price. The levels are gap areas which are used within the ICT (The Inner Circle Trader) trading system.
The indicator plots 5 areas of interest:
1: Daily Volume Imbalances - Referencing the Daily chart, boxes are calculated from close to open between all candles. Candles which have only 'wicks' between the close and open prices are considered 'volume imbalances. The boxes can then be shown on LTFs to aid in decision making for intraday traders. Imbalances can be limited to a maximum amount shown and mitigated imbalances can be removed from the chart. All colors can be customised.
Volume Imbalance example:
2: NWOG - New Week Opening Gap - Plotted from Friday Close at 1659 to Sunday Opening at 1800 (EST). The current NWOG can be displayed on its own, or previous weeks can also be shown (ICT recommends the previous 4 weeks also). Boxes are plotted with a midline and all colors can be customised.
New Week Opening Gaps example:
3. NDOG - New Day Opening Gaps - Plotted from day close at 1659 (EST) to restart at 1800 (EST). All colors can be customised. These gaps can be very small so line widths of 3+ are recommended if the lines are to be seen on HTFs
New Day Opening Gap example:
4. New Opening Gap - Plotted from close at 1659 to Session open at 0930 (EST). These areas can possibly be closed/filled after opening at some time. The indicator will draw box to the right of price which shows if the Opening Gap is UP or DOWN. The box will change color to show up or down, or text alone can be used instead of the box. All colors can be customised.
New Opening Gap Box example:
5. 0930 Opening Line - Draws a horizontal line from the opening price at 0930 (EST) to the last bar on the chart. This is the level used to calculate the New Opening Gap. All colors can be customised.
0930 Opening Line example:

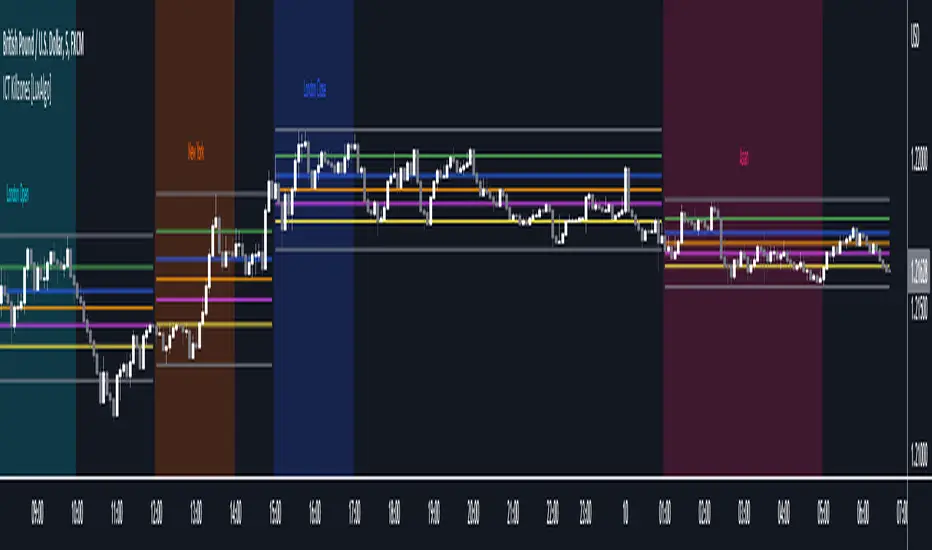
ICT Killzones [LuxAlgo]This script highlights ICT Killzones on the chart along with Fibonacci retracements constructed from each Killzone's price range, allowing traders to find more optimal entries.
Settings
Killzone Retracements
Show Retracements: Determines whether Fibonacci retracements are displayed on the chart.
Extend: Determines if the retracements are extended outside the Killzone.
Reverse: Switches the maximum and minimum levels for the calculation of the retracements.
Other settings allow disabling as well as changing the retracement value and color.
Usage
Killzones are introduced by forex trader ICT and represent different time intervals that aims at offering optimal trade entries. Killzones include:
New York Killzone (7:9 ET)
London Open Killzone (2:5 ET)
London Close Killzone (10:12 ET)
Asian Killzone (20:00 ET)
Note that using timeframes superior to 1h can highlight incorrect intervals
Fibonacci retracements on an active Killzone are subject to changes, if no Killzones are active then the associated Fibonacci retracements will stay at their current level.
Disabling specific Killzones while having extended retracements will allow them to extend further. In the image above the New York and Asian Killzones are disabled.
ICT Killzone by JeawThis is an indicator script for TradingView called "ICT Killzone". It is a useful tool for identifying the London and New York open and close sessions, as well as the Asian range on the chart. The appearance of the "killzones" can be customized by selecting colors and transparencies for each session. Boxes can also be displayed around each session and labels with additional information can be added. This script is compatible with intraday charts and time multipliers up to 60 minutes. It was created by Jeaw and is based on the ideas of the ICT (Institutional Cash Trades) methodology. This script can help traders avoid entering the market during high impact news events and periods of low liquidity. By identifying these potentially volatile times, traders can better manage their risk and improve their overall trading strategy.

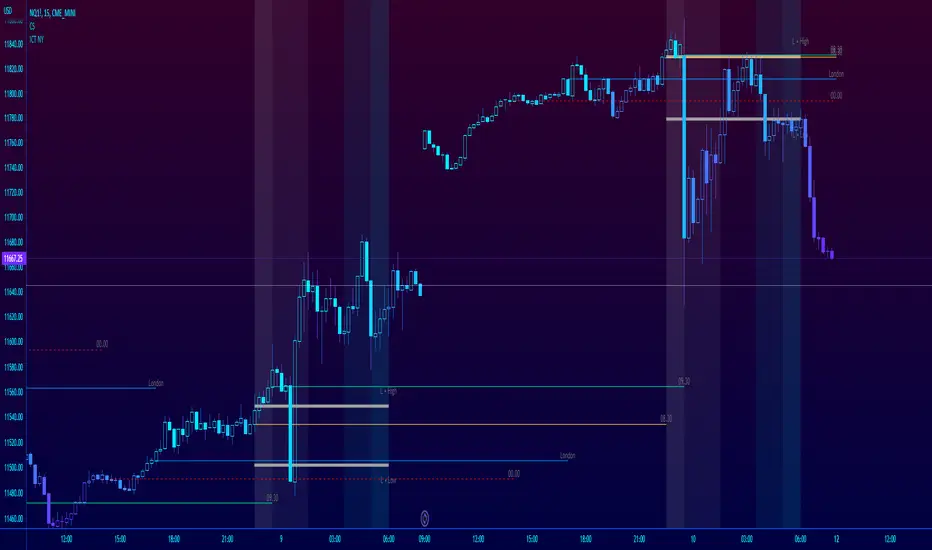
ICT NY Futures Indices Session Model - YT New York MentorshipThis indicator plots out the time periods and open lines as outlined in ICT's 2022 Mentorship and is designed specifically for the New York futures trading session.
Time zone is set to GMT-4 (NY) by default but can be changed for accommodate daylight saving in the menu.
Please note this indicator is to be used only on the 30min timeframe and below.
Here are its features:
The background color shows the morning session, in two parts (8.30am to 9.30am and 9.30am to 11.30am), then a two hour gap for lunch (ICT calls this "Dead time") and finally, the afternoon session, also to two (1.30pm to 3pm and 3pm to 4pm).
It not only shows the current killzones, but future zones as well.
These times are important; trades can be framed within these zones as taught in the mentorship.
Next are the open lines. These lines are automatically plotted and can be areas for price to react off of; they are the opening price of a candle at these times:
00.00 (New York Midnight, also known as "True Day Open")
8.30am (New York Equities pre-open)
9.30am (New York Equities open)
2.00am (London Stock Exchange open)
And lastly, London's trading session High and Low are projected forward onto the New York trading session.
These two price points are areas of liquidity that were pooled during London, but they can also often set the high or low of the day.
Please let me know if there are any bugs or if you have suggestions for the next update.
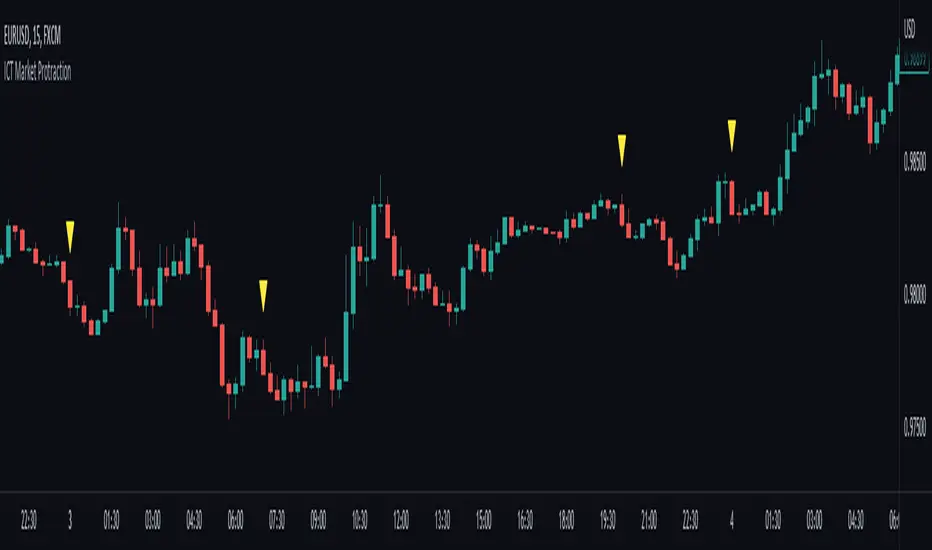
ICT Market Protraction (0:00, 7:00, 20:00 NY time highlight)Market protraction, as defined by ICT, is a time-specific reoccurring impulse move in forex markets. It is designed for market manipulation and will go in the opposite direction of the following trend.
My indicator will add a shape above/below the candle if it fits the time criteria.
I recommend to watch: ICT Mentorship Core Content - Month 1 - Impulse Price Swings & Market Protraction on Youtube
ICT Index Futures Session LinesICT Index Futures Session Lines
Description:
The script is based on one of ICT's concepts on trading Index Futures. The script lays out the daily range from an intraday basis.
Range:
00:00 - New York Midnight
08:30 – New York Open (News events come out)
12:00/13:00 - New York Lunch (No trade time period)
13:30 - (Algorithm)
16:30 - Close
* The open, high and low lines are plotted from 00:00 to 08:30
How To Use:
You will need to check the daily bias. Prior to 8:30 you are to look for previous swing points where liquidity may exist. During the open you want to see if a high or low is taken out, and then wait for an energetic break/displacement for a potential FVG/imbalance retracement entry.
Strategy is for LTF (1 to 15m)
Default time zone is set to America/New_York (UTC New York), so lines will be plotted correctly regardless of user’s local UTC chart setting.

ICT Fair Value Gap [LM]Hello traders,
I would like to present you ICT Fair Value Gap script. The idea is the same as in my other script to look form imbalances. I have improved the previous script from teaching of ICT and created this script to train the eye to see those gaps. Shrinking option also shows if the gap has been already filled and also in case gap is filled you can get alert in case you will set it up .
The script has two settings:
general settings - definition of volatility condition for middle candle
box settings - setting for boxes, box colors, shrinking
I hope you enjoy it,
Lukas

ICT 7/8/9am lines NY session + 7.30/8.30/9.30 linesThis script show the 7, 8, 9 AM NY session lines, together with the 7.30, 8.30 and 9.30AM lines, like ICT teaches in the 2024 Mentorship, lesson 2.
Feel free to use it!

ICT Entry V2 [TS_Indie]📌 Description – ICT Entry V2
The market structure, liquidity, FVG, and iFVG mechanisms remain the same as in Version 1.
However, the price action for order entries is different, with the positions of the FVG and iFVG swapped.
Pending orders and stop loss are placed at the iFVG.
⚙️ Core Logic & Working Mechanism
I won’t explain FVG in detail, as most traders are already familiar with it.
Let’s focus on the mechanism of iFVG instead.
The concept of iFVG is based on a supply-to-demand flip and a demand-to-supply flip within an FVG zone.
For an iFVG to be confirmed, the candle close must break through the FVG.
A wick alone does not count as a valid iFVG confirmation.
The confirmation of market structure swings uses a pivot length mechanism combined with price action.
It validates a swing by detecting a structure break formed by candles making new highs or new lows.
📈 Buy Setup
1.Liquidity sweep on the demand side, with price closing above the liquidity level.
2.A demand zone is formed as iFVG and FVG, where FVG is located above iFVG.
3.The gap between the upper box of iFVG and the lower box of FVG must be within the defined Min and Max range.
4.Market Structure must be in a Bullish trend.
5.Place a Pending Order at the upper box of iFVG and set Stop Loss at the lower box of iFVG (Entry and Stop Loss can be adjusted using Entry Zone and ATR-based Stop Loss).
📉 Sell Setup
1.Liquidity sweep on the supply side, with price closing below the liquidity level.
2.A supply zone is formed as iFVG and FVG, where FVG is located below iFVG.
3.The gap between the lower box of iFVG and the upper box of FVG must be within the defined Min and Max range.
4.Market Structure must be in a Bearish trend.
5.Place a Pending Order at the lower box of iFVG and set Stop Loss at the upper box of iFVG (Entry and Stop Loss can be adjusted using Entry Zone and ATR-based Stop Loss).
⚙️ Liquidity Sweep Conditions
➯ When a liquidity sweep occurs on the demand side, the system will start looking for Buy Setup conditions.
➯ When a liquidity sweep occurs on the supply side, the system will immediately switch to looking for Sell Setup conditions.
➯ The system will always prioritize the most recent liquidity sweep and search for setups based on that direction.
➯ The liquidity sweep condition will be invalidated when price closes back below (for demand sweep) or above (for supply sweep) the most recently swept liquidity level.
⭐ Pending Order Cancellation Conditions
A Pending Order will be canceled under the following conditions:
1.A new Price Action signal appears on either the Buy or Sell side.
2.When Time Session is enabled, the Pending Order is canceled once price exits the selected session.
🕹 Order Management Rule
When there is an active open position, the indicator restricts the creation of new Pending Orders to prevent overlapping positions.
⚠️ Disclaimer
This indicator is designed for educational and research purposes only. It does not guarantee profits and should not be considered financial advice. Trading in financial markets involves significant risk, including the potential loss of capital.
🥂 Community Sharing
If you find parameter settings that work well or produce strong statistical results, feel free to share them with the community so we can improve and develop this indicator together.

ICT CISD+FVG+OBThis script is a high-performance ICT suite designed for traders who want a professional, "noise-free" chart. It identifies core institutional patterns—Order Blocks, Fair Value Gaps, and Changes in State of Delivery (CISD)—across multiple timeframes.
The script features a proprietary Proximity Cleanup Engine that automatically deletes old or broken levels, keeping your workspace focused only on price action that is currently tradeable. It strictly follows directional delivery rules for CISD and includes a 50-candle "freshness" limit to ensure you never have to manually clear old data from your past bars.
Core Features
Intelligent CISD: Only triggers Bullish CISD on green candles and Bearish CISD on red candles.
Proximity Filter: Automatically wipes away any levels that are "miles away" from the current price.
Clean Workspace: Removes broken session highs/lows and mitigated zones instantly.
Full Customization: Toggle visibility and colors for every component via the settings menu.

ICT Entry V1 [TS_Indie]📌 Description – ICT Entry V1
This trading system is based on price action, combined with FVG, iFVG, and liquidity, and it uses the mechanism from the indicator “Smallest Swing ” to validate swings that become liquidity.
⚙️ Core Logic & Working Mechanism
I won’t explain FVG in detail, as most traders are already familiar with it.
Let’s focus on the mechanism of iFVG instead.
The concept of iFVG is based on a supply-to-demand flip and a demand-to-supply flip within an FVG zone.
For an iFVG to be confirmed, the candle close must break through the FVG.
A wick alone does not count as a valid iFVG confirmation.
The confirmation of market structure swings uses a pivot length mechanism combined with price action.
It validates a swing by detecting a structure break formed by candles making new highs or new lows.
📈 Buy Setup
1.Liquidity sweep on the demand side, with price closing above the liquidity level.
2.A demand zone is formed as FVG and iFVG, where iFVG is located above FVG.
3.The gap between the upper box of FVG and the lower box of iFVG must be within the defined Min and Max range.
4.Market Structure must be in a Bullish trend.
5.Place a Pending Order at the upper box of FVG and set Stop Loss at the lower box of FVG (Entry and Stop Loss can be adjusted using Entry Zone and ATR-based Stop Loss).
📉 Sell Setup
1.Liquidity sweep on the supply side, with price closing below the liquidity level.
2.A supply zone is formed as FVG and iFVG, where iFVG is located below FVG.
3.The gap between the lower box of FVG and the upper box of iFVG must be within the defined Min and Max range.
4.Market Structure must be in a Bearish trend.
5.Place a Pending Order at the lower box of FVG and set Stop Loss at the upper box of FVG (Entry and Stop Loss can be adjusted using Entry Zone and ATR-based Stop Loss).
⚙️ Liquidity Sweep Conditions
➯ When a liquidity sweep occurs on the demand side, the system will start looking for Buy Setup conditions.
➯ When a liquidity sweep occurs on the supply side, the system will immediately switch to looking for Sell Setup conditions.
➯ The system will always prioritize the most recent liquidity sweep and search for setups based on that direction.
➯ The liquidity sweep condition will be invalidated when price closes back below (for demand sweep) or above (for supply sweep) the most recently swept liquidity level.
⭐ Pending Order Cancellation Conditions
A Pending Order will be canceled under the following conditions:
1.A new Price Action signal appears on either the Buy or Sell side.
2.When Time Session is enabled, the Pending Order is canceled once price exits the selected session.
🕹 Order Management Rule
When there is an active open position, the indicator restricts the creation of new Pending Orders to prevent overlapping positions.
⚠️ Disclaimer
This indicator is designed for educational and research purposes only. It does not guarantee profits and should not be considered financial advice. Trading in financial markets involves significant risk, including the potential loss of capital.
🥂 Community Sharing
If you find parameter settings that work well or produce strong statistical results, feel free to share them with the community so we can improve and develop this indicator together.

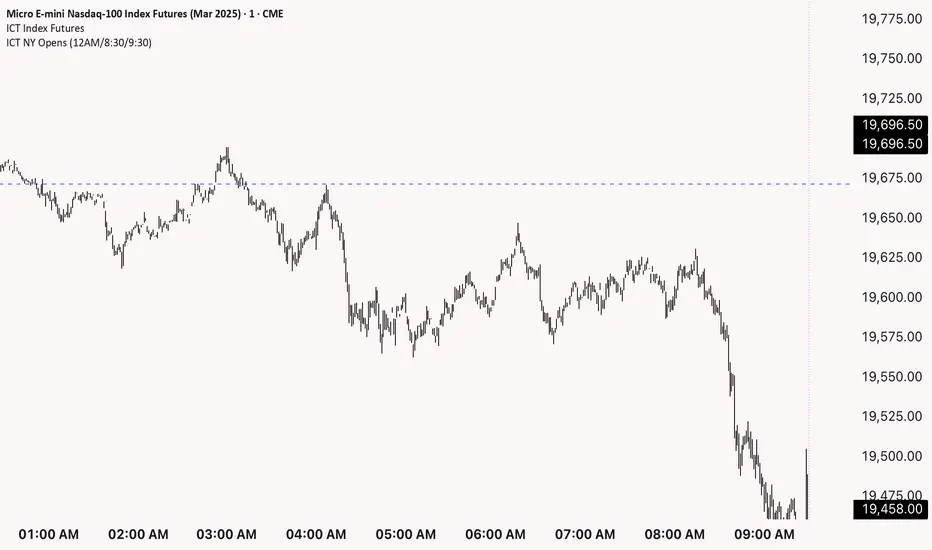
ICT NY Opens (12AM/8:30/9:30)This indicator plots three key New York session reference levels used by ICT traders and intraday scalpers: the Midnight Open (12:00 AM EST), the 8:30 AM EST level (common macro print window), and the 9:30 AM EST RTH open. Each line is drawn at that day’s opening price for the specified time and extends horizontally to 4:15 PM TDC so you always have clean, fixed anchors for the entire trading day.
ICT Setup 04 [TradingFinder] SFP Sweep Liquidity Fake CHoCH/BOS🔵 Introduction
In smart money and ICT based trading, liquidity is never random. Some of the most meaningful market moves begin with a liquidity sweep where price intentionally hunts a previous swing high or swing low to trigger stop loss orders and absorb volume.
This manipulation is often followed by a sharp reversal from a reaction zone, creating ideal conditions for a high probability entry. This indicator is built to detect exactly that. It identifies a valid swing point and defines a reaction zone where price is likely to react.
For short setups, the zone lies between the swing high and the maximum of the candle’s open or close. For long setups, it’s drawn from the swing low to the minimum of the open or close.
When price returns to this zone and forms a qualified confirmation candle typically a doji or a small bodied candle that closes inside the zone while sweeping the liquidity this is a potential sign of reversal.
The candle must show both the sweep and the inability to hold above or below the key level, signaling a fake breakout or failed move. By combining elements of liquidity hunt, reaction zone rejection, and candle based entry confirmation, this tool highlights sniper entry points used by smart money to trap retail traders and reverse the trend. It helps filter out noise and enhances timing, making it ideal for trading in alignment with institutional order flow.
Long Position :
Short Position :
🔵 How to Use
This indicator is designed to highlight precise moments where price sweeps liquidity and reacts within a high probability reversal zone. By identifying clean swing highs and lows and defining a smart reaction zone around them, it filters out weak fakeouts and focuses only on setups with strong institutional footprints.
The tool works best when combined with market structure analysis and is suitable for both scalping and intraday trading. Below is a breakdown of how to interpret the signals for long and short positions based on the visual setups provided.
🟣 Long Setup
In a long setup, the indicator first detects a valid swing low where liquidity has likely accumulated below. A reaction zone is then drawn between the swing low and the minimum of the open or close of the swing candle.
When price returns to this zone, it must sweep the previous low and form a precise confirmation candle, such as a doji or a small bodied candle, that closes inside the zone. This candle must also reject the lower level, showing failure to continue downward.
As shown in the chart, once the liquidity grab is complete and the confirmation candle forms, a clean long signal is issued, indicating a potential bullish reversal backed by smart money behavior.
🟣 Short Setup
In a short setup, the indicator identifies a swing high where buy-side liquidity is resting. It then constructs a reaction zone between the high and the maximum of the open or close of the swing candle. Price must return to this zone, sweep the swing high, and form a bearish confirmation candle inside the zone.
A classic example is a doji or rejection candle that traps breakout buyers and fails to hold above the previous high. In the provided chart, the price aggressively hunts the liquidity above the swing high, but the close within the reaction zone signals exhaustion, prompting a short signal with high reversal probability.
These setups represent moments where price action, liquidity behavior, and candle structure align to offer strong entries. By focusing on clean sweeps and reactive confirmations, the indicator helps traders stay on the side of smart money and avoid common breakout traps.
🔵 Settings
🟣 Logical settings
Swing period : You can set the swing detection period.
Max Swing Back Method : It is in two modes "All" and "Custom". If it is in "All" mode, it will check all swings, and if it is in "Custom" mode, it will check the swings to the extent you determine.
Max Swing Back : You can set the number of swings that will go back for checking.
Maximum Distance Between Swing and Signal :The maximum number of candles allowed between the swing point and the potential signal. The default value is 50, ensuring that only recent and relevant price reactions are considered valid.
🟣 Display settings
Displaying or not displaying swings and setting the color of labels and lines.
🟣 Alert Settings
Alert SFP : Enables alerts for Swing Failure Pattern.
Message Frequency : Determines the frequency of alerts. Options include 'All' (every function call), 'Once Per Bar' (first call within the bar), and 'Once Per Bar Close' (final script execution of the real-time bar). Default is 'Once per Bar'.
Show Alert Time by Time Zone : Configures the time zone for alert messages. Default is 'UTC'.
🔵 Conclusion
This indicator is built for traders who rely on liquidity driven setups and smart money principles. By combining swing structure analysis with precision reaction zones and strict entry confirmation, it isolates the exact moments where price sweeps liquidity and fails to continue. These are high value points where institutional activity often reveals itself, and retail traps unfold.
Unlike generic breakout tools, this script focuses on quality over quantity by requiring both a sweep of a swing high or low and a confirmed rejection candle that closes inside a predefined zone. With customizable swing depth, proximity filters, visual highlights, and alert functions, it offers a complete framework for identifying and acting on fake breakouts with confidence. Whether you trade forex, crypto, or indices, this tool enhances your ability to align with true order flow and take entries where liquidity is most likely to shift.
