ICOptimizerLibrary "ICOptimizer"
Library for IC-based parameter optimization
findOptimalParam(testParams, icValues, currentParam, smoothing)
Find optimal parameter from array of IC values
Parameters:
testParams (array) : Array of parameter values being tested
icValues (array) : Array of IC values for each parameter (same size as testParams)
currentParam (float) : Current parameter value (for smoothing)
smoothing (simple float) : Smoothing factor (0-1, e.g., 0.2 means 20% new, 80% old)
Returns: New parameter value, its IC, and array index
adaptiveParamWithStarvation(opt, testParams, icValues, smoothing, starvationThreshold, starvationJumpSize)
Adaptive parameter selection with starvation handling
Parameters:
opt (ICOptimizer) : ICOptimizer object
testParams (array) : Array of parameter values
icValues (array) : Array of IC values for each parameter
smoothing (simple float) : Normal smoothing factor
starvationThreshold (simple int) : Number of updates before triggering starvation mode
starvationJumpSize (simple float) : Jump size when in starvation (as fraction of range)
Returns: Updated parameter and IC
detectAndAdjustDomination(longCount, shortCount, currentLongLevel, currentShortLevel, dominationRatio, jumpSize, minLevel, maxLevel)
Detect signal imbalance and adjust parameters
Parameters:
longCount (int) : Number of long signals in period
shortCount (int) : Number of short signals in period
currentLongLevel (float) : Current long threshold
currentShortLevel (float) : Current short threshold
dominationRatio (simple int) : Ratio threshold (e.g., 4 = 4:1 imbalance)
jumpSize (simple float) : Size of adjustment
minLevel (simple float) : Minimum allowed level
maxLevel (simple float) : Maximum allowed level
Returns:
calcIC(signals, returns, lookback)
Parameters:
signals (float)
returns (float)
lookback (simple int)
classifyIC(currentIC, icWindow, goodPercentile, badPercentile)
Parameters:
currentIC (float)
icWindow (simple int)
goodPercentile (simple int)
badPercentile (simple int)
evaluateSignal(signal, forwardReturn)
Parameters:
signal (float)
forwardReturn (float)
updateOptimizerState(opt, signal, forwardReturn, currentIC, metaICPeriod)
Parameters:
opt (ICOptimizer)
signal (float)
forwardReturn (float)
currentIC (float)
metaICPeriod (simple int)
calcSuccessRate(successful, total)
Parameters:
successful (int)
total (int)
createICStatsTable(opt, paramName, normalSuccess, normalTotal)
Parameters:
opt (ICOptimizer)
paramName (string)
normalSuccess (int)
normalTotal (int)
initOptimizer(initialParam)
Parameters:
initialParam (float)
ICOptimizer
Fields:
currentParam (series float)
currentIC (series float)
metaIC (series float)
totalSignals (series int)
successfulSignals (series int)
goodICSignals (series int)
goodICSuccess (series int)
nonBadICSignals (series int)
nonBadICSuccess (series int)
goodICThreshold (series float)
badICThreshold (series float)
updateCounter (series int)
Cari dalam skrip untuk "imbalance"

IC optimiser libLibrary "IC optimiser lib"
Library for IC-based parameter optimization
findOptimalParam(testParams, icValues, currentParam, smoothing)
Find optimal parameter from array of IC values
Parameters:
testParams (array) : Array of parameter values being tested
icValues (array) : Array of IC values for each parameter (same size as testParams)
currentParam (float) : Current parameter value (for smoothing)
smoothing (simple float) : Smoothing factor (0-1, e.g., 0.2 means 20% new, 80% old)
Returns: New parameter value, its IC, and array index
adaptiveParamWithStarvation(opt, testParams, icValues, smoothing, starvationThreshold, starvationJumpSize)
Adaptive parameter selection with starvation handling
Parameters:
opt (ICOptimizer) : ICOptimizer object
testParams (array) : Array of parameter values
icValues (array) : Array of IC values for each parameter
smoothing (simple float) : Normal smoothing factor
starvationThreshold (simple int) : Number of updates before triggering starvation mode
starvationJumpSize (simple float) : Jump size when in starvation (as fraction of range)
Returns: Updated parameter and IC
detectAndAdjustDomination(longCount, shortCount, currentLongLevel, currentShortLevel, dominationRatio, jumpSize, minLevel, maxLevel)
Detect signal imbalance and adjust parameters
Parameters:
longCount (int) : Number of long signals in period
shortCount (int) : Number of short signals in period
currentLongLevel (float) : Current long threshold
currentShortLevel (float) : Current short threshold
dominationRatio (simple int) : Ratio threshold (e.g., 4 = 4:1 imbalance)
jumpSize (simple float) : Size of adjustment
minLevel (simple float) : Minimum allowed level
maxLevel (simple float) : Maximum allowed level
Returns:
calcIC(signals, returns, lookback)
Parameters:
signals (float)
returns (float)
lookback (simple int)
classifyIC(currentIC, icWindow, goodPercentile, badPercentile)
Parameters:
currentIC (float)
icWindow (simple int)
goodPercentile (simple int)
badPercentile (simple int)
evaluateSignal(signal, forwardReturn)
Parameters:
signal (float)
forwardReturn (float)
updateOptimizerState(opt, signal, forwardReturn, currentIC, metaICPeriod)
Parameters:
opt (ICOptimizer)
signal (float)
forwardReturn (float)
currentIC (float)
metaICPeriod (simple int)
calcSuccessRate(successful, total)
Parameters:
successful (int)
total (int)
createICStatsTable(opt, paramName, normalSuccess, normalTotal)
Parameters:
opt (ICOptimizer)
paramName (string)
normalSuccess (int)
normalTotal (int)
initOptimizer(initialParam)
Parameters:
initialParam (float)
ICOptimizer
Fields:
currentParam (series float)
currentIC (series float)
metaIC (series float)
totalSignals (series int)
successfulSignals (series int)
goodICSignals (series int)
goodICSuccess (series int)
nonBadICSignals (series int)
nonBadICSuccess (series int)
goodICThreshold (series float)
badICThreshold (series float)
updateCounter (series int)

Dynamic ~ CVDDynamic - CVD is a smart, time-adaptive version of the classic Cumulative Volume Delta (CVD) indicator, designed to help traders visualize market buying and selling pressure across all timeframes with minimal manual tweaking.
Overview
Cumulative Volume Delta tracks the difference between buying and selling volume during each bar. It reveals whether aggressive buyers or sellers dominate the market, offering deep insight into real-time market sentiment and underlying momentum.
This version of CVD automatically adjusts its EMA smoothing length based on your selected timeframe, ensuring optimal sensitivity and consistency across intraday, daily, weekly, and even monthly charts.
Features
Dynamic EMA Length — Automatically adapts smoothing parameters based on the chart timeframe:
1–59 min → 50
1–23 h → 21
Daily & Weekly → 100
Monthly → 10
CVD Visualization — Displays cumulative delta to show the ongoing buying/selling imbalance.
CVD‑EMA Curve — Offers a clear trend signal by comparing the CVD line with its EMA.
Adaptive Color Logic — EMA curve changes color dynamically:
Green when CVD > EMA (bullish pressure)
Gray when CVD < EMA (bearish pressure)
How to Use
Use Dynamic - CVD to gauge whether the market is accumulating (net buying) or distributing (net selling).
When CVD rises above its EMA, it often signals consistent buying pressure and potential bullish continuation.
When CVD stays below its EMA, it highlights sustained selling pressure and possible weakness.
The dynamic EMA makes it suitable for scalping, swing trading, and longer-term trend analysis—no need to manually adjust settings.
Best For
Traders looking to measure real buying/selling flow rather than price movement alone.
Market participants who want a plug‑and‑play CVD that stays accurate across all timeframes.
Anyone interested in volume‑based momentum confirmation tools.
Disclaimer
This script is provided for educational and analytical purposes only. It does not constitute financial advice or a recommendation to buy or sell any asset. Past performance is not indicative of future results. Always perform your own analysis and consult a licensed financial advisor before making investment decisions. The author is not responsible for any financial losses or trading outcomes arising from the use of this indicator.

Liquidations Aggregated (Lite)Liquidations Aggregated (Lite)
The Liquidations Aggregated (Lite) script provides a unified cross-exchange visualization of short and long liquidation volumes, allowing traders to identify high-impact market events and sentiment reversals driven by forced position closures. It aggregates normalized liquidation data from Binance, Bybit, and OKX into a single coherent output, offering a consolidated perspective of derivative market stress across major venues.
Core Concept
Liquidations are involuntary closures of leveraged positions when margin requirements are breached. They represent points of structural orderflow imbalance, often triggering localized volatility spikes and price pivots. This indicator isolates and aggregates those liquidation volumes by direction (short vs. long), allowing traders to map where leveraged traders are being forced out and whether current market movement is driven by short covering or long capitulation.
Underlying Methodology
Each connected exchange provides liquidation feeds via standardized symbols (e.g., BTCUSDT.P_LQBUY or BTCUSD.P_LQSELL).
The script differentiates between:
Short Liquidations → Buy Volume: Forced covering of shorts, representing upward pressure.
Long Liquidations → Sell Volume: Forced selling of longs, representing downward pressure.
Bybit’s inverse data is normalized to align directional logic with Binance and OKX. Data is drawn through the request.security() function per symbol and per exchange, with per-exchange scaling adjustments applied to compensate for differences in reported nominal sizes (USD vs. coin-margined). The script is meant to match the calculation methods of professional-grade data sources (e.g., Velodata, Coinalyze). The value is denominated in the base currency at all times.
Computation Logic
Liquidation volumes are fetched separately for USD- and USDT-margined pairs on each exchange.
Exchange-specific magnitude adjustments are applied to account for nominal denomination differences.
Normalized liquidation buy and sell volumes are summed into two global aggregates:
combinedBuyVolumeLiquidationsShort → aggregated buy volume from forced short positions closes (Short Liquidations)
combinedSellVolumeLiquidationsLong → aggregated sell pressure from forced long position closes (Long Liquidations)
Final series are plotted as mirrored column charts around a zero baseline for direct comparison.
How to Use
Apply the script to any crypto perpetual futures symbol (e.g., BTCUSDT, ETHUSDT).
Observe teal bars (Buy Volume from Short Liquidations) for short squeezes and red bars (Sell Volume from Long Liquidations) for long wipes.
Strong teal spikes during downtrends often indicate aggressive short liquidations leading to short-term bounces.
Strong red spikes during uptrends often mark long unwinds that can trigger sharp retracements.
Sustained asymmetry in either direction suggests systemic imbalance across leveraged positioning.

Illuminati Zone🟣 Illuminati Zone — Hidden Power of the 11 PM NZ Candle
The Illuminati Zone reveals the hidden footprints of liquidity and market imbalance formed by the 11 PM New Zealand 15-minute candle — a time when global liquidity transitions between major sessions.
This candle often defines key intraday supply and demand boundaries, serving as a magnet for price and a pivot point for high-probability reversals or breakouts.
🧠 How it works
Automatically detects and marks the 11 PM NZ 15-minute candle each day.
Draws a translucent zone box between its high and low.
Extends two reference lines at +1 × range and –1 × range above and below the zone — ideal for spotting overextensions or liquidity sweeps.
Supports custom lookback, colors, and visual options.
💡 How to use it
Watch how price interacts with the zone — rejection often signals smart-money activity.
Use +1 and –1 levels as overextended zones for potential reversals or breakout retests.
Combine with your own confluence tools or volume analysis for precision entries.
⚙️ Customization Options
Target hour (NZ time)
Days back to display
Zone and line colors
Transparency and visual preferences
🔮 Pro Tip: Pair it with a volume or imbalance indicator for surgical-level precision in identifying where smart money positions are built or released.

Volume Delta [BigBeluga]🔵 OVERVIEW
The Volume Delta indicator visualizes the dominance between buying and selling volume within a given period. It calculates the percentage of bullish (buy) versus bearish (sell) volume, then color-codes the candles and provides a real-time dashboard comparing delta values across multiple currency pairs. This makes it a powerful tool for monitoring order-flow strength and intermarket relationships in real time.
🔵 CONCEPTS
Each bar’s buy volume is counted when the close is higher than the open.
Each bar’s sell volume is counted when the close is lower than the open.
volumeBuy = 0.
volumeSell = 0.
for i = 0 to period
if close > open
volumeBuy += volume
else
volumeSell += volume
The indicator sums both over a chosen period to calculate the ratio of buy-to-sell pressure.
Delta (%) = (Buy Volume ÷ (Buy Volume + Sell Volume)) × 100.
Gradient colors highlight whether buying or selling pressure dominates.
🔵 FEATURES
Calculates real-time Volume Delta for the selected chart or for multiple assets.
Colors candles dynamically based on the delta intensity (green = buy pressure, red = sell pressure).
Displays a dashboard table showing volume delta % for up to five instruments.
The dashboard features visual progress bars for quick intermarket comparison.
An optional Delta Bar Panel shows the ratio of Buy/Sell volumes near the latest bar.
A floating label shows the exact Buy/Sell percentages.
Works across all symbols and timeframes for multi-asset delta tracking.
🔵 HOW TO USE
When Buy % > Sell % , it often signals bullish momentum or strong accumulation—but can also indicate over-excitement and a possible market top.
Market Tops
When Sell % > Buy % , it typically reflects bearish pressure or distribution—but may also occur near a market bottom where selling exhaustion forms.
Market Bottom
Use the Dashboard to compare volume flow across correlated assets (e.g., major Forex pairs or sector groups).
Combine readings with trend or volatility filters to confirm whether the imbalance aligns with broader directional conviction.
Treat the Delta Bar visualization as a real-time sentiment gauge—showing which side (buyers or sellers) dominates the current session.
🔵 CONCLUSION
Volume Delta transforms volume analysis into an intuitive directional signal.
By quantifying buy/sell pressure and displaying it as a percentage or color gradient, it provides traders with a clearer picture of real-time volume imbalance — whether within one market or across multiple correlated instruments.

Devil Marks - Multi TimeframeA handy completely new script that shows Devil Marks for several time frames on the current time frame.
Devil Marks are where candles have no wick at one end of the candlestick. These levels are seen as areas that price needs to go back to at some point to re-balance the imbalance. These levels can add confluence to a trade idea.
A table is included that shows the closest devil mark for each time frame.
Devil Marks should show until that level is mitigated by price trading at that level.

Cumulative Volume Delta Profile and Heatmap [BackQuant]Cumulative Volume Delta Profile and Heatmap
A multi-view CVD workstation that measures buying vs selling pressure, renders a price-aligned CVD profile with Point of Control, paints an optional heatmap of delta intensity, and detects classical CVD divergences using pivot logic. Built for reading who is in control, where participation clustered, and when effort is failing to produce result.
What is CVD
Cumulative Volume Delta accumulates the difference between aggressive buys and aggressive sells over time. When CVD rises, buyers are lifting the offer more than sellers are hitting the bid. When CVD falls, the opposite is true. Plotting CVD alongside price helps you judge whether price moves are supported by real participation or are running on fumes.
Core Features
Visual Analysis Components
CVD Columns - Plot of cumulative delta, colored by side, for quick read of participation bias.
CVD Profile - Price-aligned histogram of CVD accumulation using user-set bins. Shows where net initiative clustered.
Split Buy and Sell CVD - Optional two-sided profile that separates positive and negative CVD into distinct wings.
POC - Point of Control - The price level with the highest absolute CVD accumulation, labeled and line-marked.
Heatmap - Semi-transparent blocks behind price that encode CVD intensity across the last N bars.
Divergence Engine - Pivot-based detection of Bearish and Bullish CVD divergences with optional lines and labels.
Stats Panel - Top level metrics: Total CVD, Buy and Sell totals with percentages, Delta Ratio, and current POC price.
How it works
Delta source and sampling
You select an Anchor Timeframe that defines the higher time aggregation for reading the trend of CVD.
The script pulls lower timeframe volume delta and aggregates it to the anchor window. You can let it auto-select the lower timeframe or force a custom one.
CVD is then accumulated bar by bar to form a running total. This plot shows the direction and persistence of initiative.
Profile construction
The recent price range is split into Profile Granularity bins.
As price traverses a bin, the current delta contribution is added to that bin.
If Split Buy and Sell CVD is enabled, positive CVD goes to the right wing and negative CVD to the left wing.
Widths are scaled by each side’s maximum so you can compare distribution shape at a glance.
The Point of Control is the bin with the highest absolute CVD. This marks where initiative concentrated the most.
Heatmap
For each bin, the script computes intensity as absolute CVD relative to the maximum bin value.
Color is derived from the side in control in that bin and shaded by intensity.
Heatmap Length sets how far back the panels extend, highlighting recurring participation zones.
Divergence model
You define pivot sensitivity with Pivot Left and Right .
Bearish divergence triggers when price confirms a higher high while CVD fails to make a higher high within a configurable Delta Tolerance .
Bullish divergence triggers when price confirms a lower low while CVD fails to make a lower low.
On trigger, optional link lines and labels are drawn at the pivots for immediate context.
Key Settings
Delta Source
Anchor Timeframe - Higher TF for the CVD narrative.
Custom Lower TF and Lower Timeframe - Force the sampling TF if desired.
Pivot Logic
Pivot Left and Right - Bars to each side for swing confirmation.
Delta Tolerance - Small allowance to avoid near-miss false positives.
CVD Profile
Show CVD Profile - Toggle profile rendering.
Split Buy and Sell CVD - Two-sided profile for clearer side attribution.
Show Heatmap - Project intensity panels behind price.
Show POC and POC Color - Mark the dominant CVD node.
Profile Granularity - Number of bins across the visible price range.
Profile Offset and Profile Width - Position and scale the profile.
Profile Position - Right, Left, or Current bar alignment.
Visuals
Bullish Div Color and Bearish Div Color - Colors for divergence artifacts.
Show Divergence Lines and Labels - Visualize pivots and annotations.
Plot CVD - Column plot of total CVD.
Show Statistics and Position - Toggle and place the summary table.
Reading the display
CVD columns
Rising CVD confirms buyers are in control. Falling CVD confirms sellers.
Flat or choppy CVD during wide price moves hints at passive or exhausted participation.
CVD profile wings
Thick right wing near a price zone implies heavy buy initiative accumulated there.
Thick left wing implies heavy sell initiative.
POC marks the strongest initiative node. Expect reactions on first touch and rotations around this level when the tape is balanced.
Heatmap
Brighter blocks indicate stronger historical net initiative at that price.
Stacked bright bands form CVD high volume nodes. These often behave like magnets or shelves for future trade.
Divergences
Bearish - Price prints a higher high while CVD fails to do so. Effort is not producing result. Potential fade or pause.
Bullish - Price prints a lower low while CVD fails to do so. Capitulation lacks initiative. Potential bounce or reversal.
Stats panel
Total CVD - Net initiative over the window.
Buy and Sell volume with percentages - Side composition.
Delta Ratio - Buy over Sell. Values above 1 favor buyers, below 1 favor sellers.
POC Price - Current control node for plan and risk.
Workflows
Trend following
Choose an Anchor Timeframe that matches your holding period.
Trade in the direction of CVD slope while price holds above a bullish POC or below a bearish POC.
Use pullbacks to CVD nodes on your profile as entry locations.
Trend weakens when price makes new highs but CVD stalls, or new lows while CVD recovers.
Mean reversion
Look for divergences at or near prior CVD nodes, especially the POC.
Fade tests into thick wings when the side that dominated there now fails to push CVD further.
Target rotations back toward the POC or the opposite wing edge.
Liquidity and execution map
Treat strong wings and heatmap bands as probable passive interest zones.
Expect pauses, partial fills, or flips at these shelves.
Stops make sense beyond the far edge of the active wing supporting your idea.
Alerts included
CVD Bearish Divergence and CVD Bullish Divergence.
Price Cross Above POC and Price Cross Below POC.
Extreme Buy Imbalance and Extreme Sell Imbalance from Delta Ratio.
CVD Turn Bullish and CVD Turn Bearish when net CVD crosses zero.
Price Near POC proximity alert.
Best practices
Use a higher Anchor Timeframe to stabilize the CVD story and a sensible Profile Granularity so wings are readable without clutter.
Keep Split mode on when you want to separate initiative attribution. Turn it off when you prefer a single net profile.
Tune Pivot Left and Right by instrument to avoid overfitting. Larger values find swing divergences. Smaller values find micro fades.
If volume is thin or synthetic for the symbol, CVD will be less reliable. The script will warn if volume is zero.
Trading applications
Context - Confirm or question breakouts with CVD slope.
Location - Build entries at CVD nodes and POC.
Timing - Use divergence and POC crosses for triggers.
Risk - Place stops beyond the opposite wing or outside the POC shelf.
Important notes and limits
This is a price and volume based study. It does not access off-book or venue-level order flow.
CVD profiles are built from the data available on your chart and the chosen lower timeframe sampling.
Like all volume tools, readings can distort during roll periods, holidays, or feed anomalies. Validate on your instrument.
Technical notes
Delta is aggregated from a lower timeframe into an Anchor Timeframe narrative.
Profile bins update in real time. Splitting by side scales each wing independently so both are readable in the same panel.
Divergences are confirmed using standard pivot definitions with user-set tolerances.
All profile drawing uses fixed X offsets so panels and POC do not swim when you scroll.
Quick start
Anchor Timeframe = Daily for intraday context.
Split Buy and Sell CVD = On.
Profile Granularity = 100 to 200, Profile Position = Right, Width to taste.
Pivot Left and Right around 8 to 12 to start, then adapt.
Turn on Heatmap for a fast map of interest bands.
Bottom line
CVD tells you who is doing the lifting. The profile shows where they did it. Divergences tell you when effort stops paying. Put them together and you get a clear read on control, location, and timing for both trend and mean reversion.

cd_indiCATor_CxGeneral:
This indicator is the redesigned, simplified, and feature-enhanced version of the previously shared indicators:
cd_cisd_market_Cx, cd_HTF_Bias_Cx, cd_sweep&cisd_Cx, cd_SMT_Sweep_CISD_Cx, and cd_RSI_divergence_Cx.
Within the holistic setup, the indicator tracks:
• HTF bias
• Market structure (trend) in the current timeframe
• Divergence between selected pairs (SMT)
• Divergence between price and RSI values
• Whether the price is in an important area (FVG, iFVG, and Volume Imbalance)
• Whether the price is at a key level
• Whether the price is within a user-defined special timeframe
The main condition and trigger of the setup is an HTF sweep with CISD confirmation on the aligned timeframe.
When the main condition occurs, the indicator provides the user with a real-time market status summary, enriched with other data.
________________________________________
What’s new?
-In the SMT module:
• Triad SMT analysis (e.g.: NQ1!, ES1!, and YM1!)
• Dyad SMT analysis (e.g.: EURUSD, GBPUSD)
• Alternative pair definition and divergence analysis for non-correlated assets
o For crypto assets (xxxUSDT <--> xxxUSDT.P) (e.g.: SOLUSDT.P, SOLUSDT)
o For stocks, divergence analysis by comparing the asset with its value in another currency
(BIST:xxx <--> BIST:xxx / EURTRY), (BAT:xxx <--> BAT:xxx / EURUSD)
-Special timeframe definition
-Configurable multi-option alarm center
-Alternative summary presentation (check list / status table / stickers)
________________________________________
Details and usage:
The user needs to configure four main sections:
• Pair and correlated pairs
• Timeframes (Auto / Manual)
• Alarm center
• Visual arrangement and selections
Pair Selections:
The user should adjust trading pairs according to their trade preferences.
Examples:
• Triad: NQ1!-ES1!-YM1!, BTC-ETH-Total3
• Dyad: NAS100-US500, XAUUSD-XAGUSD, XRPUSDT-XLMUSDT
Single pairs:
-Crypto Assets:
If crypto assets are not in the triad or dyad list, they are automatically matched as:
Perpetual <--> Spot (e.g.: DOGEUSDT.P <--> DOGEUSDT)
If the asset is already defined in a dyad list (e.g., DOGE – SHIB), the dyad definition takes priority.
________________________________________
-Stocks:
If stocks are defined in the dyad list (e.g.: BIST:THYAO <--> BIST:PGSUS), the dyad definition takes priority.
If not defined, the stock is compared with its value in the selected currency.
For example, in the Turkish Stock Exchange:
BIST:FENER stock, if EUR is chosen from the menu, is compared as BIST:FENER / OANDA:EURTRY.
Here, “OANDA” and the stock market currency (TRY) are automatically applied for the exchange rate.
For NYSE:XOM, its pair will be NYSE:XOM / EURUSD.
________________________________________
Timeframes:
By default, the menu is set to “Auto.” In this mode, aligned timeframes are automatically selected.
Aligned timeframes (LTF-HTF):
1m-15m, 3m-30m, 5m-1h, 15m-4h, 1h-D, 4h-W, D-M
Example: if monitoring the chart on 5m:
• 1h sweep + 5m CISD confirmation
• D sweep + 1h CISD confirmation (bias)
• 5m market structure
• 1h SMT and 1h RSI divergence analysis
For manual selections, the user must define the timeframes for Sweep and HTF bias.
FVG, iFVG, and Volume Imbalance timeframes must be manually set in both modes.
________________________________________
Alarm Center:
The user can choose according to preferred criteria.
Each row has options.
“Yes” → included in alarm condition.
“No” → not included in alarm condition.
If special timeframe criteria are added to the alarm, the hour range must also be entered in the same row, and the “Special Zone” tab (default: -4) should be checked.
Key level timeframes and plot options must be set manually.
Example alarm setup:
Alongside the main Sweep + CISD condition, if we also want HTF bias + Trend alignment + key level (W, D) and special timeframe (09:00–11:00), we should set up the menu as follows:
________________________________________
Visual Arrangement and Selections:
Users can control visibility with checkboxes according to their preferences.
In the Table & Sticker tab, table options and labels can be controlled.
• Summary Table has two options: Check list and Status Table
• From the HTF bias section, real-time bias and HTF sweep zone (optional) are displayed
• The RSI divergence section only shows divergence analysis results
• The SMT 2 sub-section only functions when triad is selected
Labels are shown on the bar where the sweep + CISD condition occurs, displaying the current situation.
With the Check box option, all criteria’s real-time status is shown (True/False).
Status Table provides a real-time summary table.
Although the menu may look crowded, most settings only need to be adjusted once during initial use.
________________________________________
What’s next?
• Suggestions from users
• Standard deviation projection
• Mitigation/order blocks (cd special mtg)
• PSP /TPD
________________________________________
Final note:
Every additional criterion in the alarm settings will affect alarm frequency.
Multiple conditions occurring at the same time is not, by itself, sufficient to enter a trade—you should always apply your own judgment.
Looking forward to your feedback and suggestions.
Happy trading! 🎉

unFair Value Gap Detector [theUltimator5]The unFair Value Gap Detector (uFVG) highlights imbalance zones that form when trend strength is weak but directional pressure spikes—a condition often followed by price reversion back into that level. Unlike the classic 3-candle ICT FVG, this tool is designed to help you have an unFair edge in gap retracement detection by plotting high probability gap reversion opportunities on the current timeframe and the next FIVE (yes five) higher timeframes.
What you’ll see:
Gap line per event: A single, no-nonsense line at the level price most often returns to.
Auto multi-timeframe view: uFVG ladders up through five higher timeframes and shows their levels too—each with its own color.
Smart de-clutter: Near-duplicate lines across timeframes are filtered so your chart stays readable.
Note: This indicator is intentionally minimalistic visually to minimize chart clutter, while still being an extremely powerful tool
Optional visuals:
Light background tint during quiet, coiling conditions.
Soft fill from price to the active line for quick context.
Compact labels that note the price and which timeframe printed it.
Why it is unique and effective (the “unfair” edge):
Early, practical context: Spots levels near when the imbalance forms—useful before the crowd catches on.
Clarity over noise: One line per event. No boxes, no sprawling zones, fewer “maybe” areas.
Timeframe confluence: When multiple timeframes cluster around the same price, you’ve got a stronger focal point.
Simple risk framing: If price slices through the line decisively, that idea’s done. Next.
How to use it:
Mean-reversion play: Look for price to tag the line, take profits into it, or fade a first reaction.
Continuation play: After the line is “mitigated,” reassess in the original direction.
Prioritize by timeframe: Higher-timeframe lines tend to carry more weight.
Respect clusters: Multiple lines stacked near one price often mark important pivots.
Customization
Colors: Separate colors for current and higher-timeframe lines.
Toggles: Turn on/off background highlights, line-to-price fill, and labels.
Minimal fuss: The rest is auto—timeframes, line lifecycle, and de-duplication are handled for you.

Helper Lib by tristanlee85Library "helpers"
This library offers various functions and types based on the algorithmic
concepts as authored by ICT.
kv(key, value)
Returns a string of the key/value set, suitable for debug logging
Parameters:
key (string)
value (string)
Returns: A string formatted as "{key}: {value}"
kv(key, value)
Parameters:
key (string)
value (int)
kv(key, value)
Parameters:
key (string)
value (float)
kv(key, value)
Parameters:
key (string)
value (bool)
method enable(this, enable)
Enable/Disable debug logging
Namespace types: Debugger
Parameters:
this (Debugger)
enable (bool) : Set to `true` by default.
method group(this, label)
Creates a group label for nested debug() invocations
Namespace types: Debugger
Parameters:
this (Debugger)
label (string)
method groupEnd(this, label)
Ends the specified debug group
Namespace types: Debugger
Parameters:
this (Debugger)
label (string)
method log(this, s, arg1, arg2, arg3, arg4, arg5)
Logs the param values if debug mode is enabled
Namespace types: Debugger
Parameters:
this (Debugger)
s (string) : Title of the log message
arg1 (string)
arg2 (string)
arg3 (string)
arg4 (string)
arg5 (string)
method logIf(this, expr, s, arg1, arg2, arg3, arg4, arg5)
Same behavior as debug() except will only log if the passed expression is true
Namespace types: Debugger
Parameters:
this (Debugger)
expr (bool) : Boolean expression to determine if debug logs should be logged
s (string) : Title of the log message
arg1 (string)
arg2 (string)
arg3 (string)
arg4 (string)
arg5 (string)
style_getLineStyleFromType(opt)
Returns the corresponding line style constant for the given LineStyleType
Parameters:
opt (series LineStyleType) : The selected line style type
Returns: The Pine Script line style constant
style_getTextSizeFromType(opt)
Returns the corresponding text size constant for the given TextSizeType
Parameters:
opt (series TextSizeType) : The selected text size type
Returns: The Pine Script text size constant
style_getTextHAlignFromType(t)
Returns the corresponding horizontal text align constant for the given HAlignType
Parameters:
t (series HAlignType) : The selected text align type
Returns: The Pine Script text align constant
style_getTextVAlignFromType(t)
Returns the corresponding vertical text align constant for the given VAlignType
Parameters:
t (series VAlignType) : The selected text align type
Returns: The Pine Script text align constant
format_sentimentType(sentiment, pd)
Used to produce a string with the sentiment and PD array type (e.g., "+FVG")
Parameters:
sentiment (series SentimentType) : The sentiment value (e.g., SentimentType.BULLISH)
pd (series PDArrayType) : The price data array (e.g., PDArrayType.FVG)
Returns: A formatted string with the sentiment and PD array (e.g., "+FVG")
format_timeToString(timestamp)
Formats a UNIX timestamp into a date and time string based on predefined formats
Parameters:
timestamp (int) : The UNIX timestamp to format
Returns: A formatted string as "MM-dd (E) - HH:mm"
method init(this)
Initializes the session and validates the configuration. This MUST be called immediately after creating a new instance.
Namespace types: Session
Parameters:
this (Session) : The Session object reference
Returns: The Session object (chainable) or throws a runtime error if invalid
method isActive(this, _time)
Determines if the session is active based on the current bar time
Namespace types: Session
Parameters:
this (Session) : The Session object reference
_time (int)
Returns: `true` if the session is currently active; `false` otherwise
method draw(this)
Draws the line and optional label
Namespace types: LineLabel
Parameters:
this (LineLabel) : The LineLabel object reference
Returns: The LineLabel object (chainable)
method extend(this, x)
Extends the line and label right to the specified bar index
Namespace types: LineLabel
Parameters:
this (LineLabel) : The LineLabel object reference
x (int) : The bar index to extend to
Returns: The LineLabel object (chainable)
method destroy(this)
Removes the line and label from the chart
Namespace types: LineLabel
Parameters:
this (LineLabel) : The LineLabel object reference
isFVG(includeVI, barIdx)
Checks if the previous bars form a Fair Value Gap (FVG)
Parameters:
includeVI (bool) : If true, includes Volume Imbalance in the FVG calculation
barIdx (int) : The index of the bar to check from (default is 0 for the current bar)
Returns: A Gap object if a FVG is detected; otherwise, `na`
isVolumeImbalance(barIdx)
Checks if the previous bars form a Volume Imbalance (VI)
Parameters:
barIdx (int) : The index of the bar to check from (default is 0 for the current bar)
Returns: A Gap object if a VI is detected; otherwise, `na`
isLiquidityVoid(barIdx)
Checks if the previous bars form a Liquidity Void (LV)
Parameters:
barIdx (int) : The index of the bar to check from (default is 0 for the current bar)
Returns: A Gap object if an LV is detected; otherwise, `na`
isSwingPoint(barIdx)
Checks if the previous bars form a swing point
Parameters:
barIdx (int) : The index of the bar to check from (default is 0 for the current bar)
Returns: A SwingPoint object if a swing point is detected; otherwise, `na`
Debugger
A debug logging utility with group support
Fields:
enabled (series bool)
_debugGroupStack (array)
Session
Defines a trading session with a name and time range. When creating a new instance of this type, you MUST call init() immediately.
Fields:
name (series string) : A display-friendly name (e.g., "NY AM")
session (series string) : A string defining the session time range (e.g., "1300-1400")
enabled (series bool) : Optional flag for custom logic; defaults to false
start (series int) : UNIX time representing the session start (set via isActive())
end (series int) : UNIX time representing the session end (set via isActive())
_t (series int)
_start_HH (series float)
_start_mm (series float)
_end_HH (series float)
_end_mm (series float)
Gap
Represents a price inefficiency (gap) with details on sentiment and price levels
Fields:
type (series SentimentType) : The sentiment of the gap (e.g., SentimentType.BULLISH)
name (series string) : A display-friendly name (e.g., "+FVG")
startTime (series int) : UNIX time value for the gap's start
endTime (series int) : UNIX time value for the gap's end
startIndex (series int) : Bar index where the gap starts
endIndex (series int) : Bar index where the gap ends
gapLow (series float) : The lowest price level of the gap
gapHigh (series float) : The highest price level of the gap
ce (series float) : The consequent encroachment level of the gap
SwingPoint
Represents a swing point with details on type and price level
Fields:
type (series SwingPointType) : The type of swing point (e.g., SwingPointType.HIGH)
time (series int) : UNIX time value for the swing point
barIdx (series int) : Bar index where the swing point occurs
price (series float) : The price level of the swing point which is either the high or low of the middle bar
LineLabel
Combines a line and box type to produce a line with a label that is properly aligned
Fields:
x (series int) : The X-axis starting point as a bar index
y (series float) : The Y-axis starting point as the price level
color (series color) : Both the line and text color
width (series int) : Thickness of the line
label (series string) : Text to display
showLabel (series bool) : Boolean to conditionally show/hide the label (default is false)
lineStyle (series LineStyleType) : The style of the line
textSize (series TextSizeType)
_b (series box)
_l (series line)

IFVG ExtendedThis indicator identifies and visualizes "Imbalance Fair Value Gaps" (IFVGs) on a price chart. It highlights these gaps, tracks their evolution, and signals when they are "filled" or "invalidated" by price action. The script is quite advanced, using custom types, arrays, and dynamic drawing.
1. Types and Variables
Custom Types:
lab: Stores label information (x, y, direction).
fvg: Stores Fair Value Gap data, including its boundaries, direction, state, labels, and other properties.
Arrays:
Four arrays track bullish and bearish FVGs, and their "invalidated" (filled) versions.
Signals:
Boolean variables to store if a bullish or bearish signal is triggered.
2. User Inputs and Parameters
Display Settings:
How many recent FVGs to show, signal preference (close or wick), ATR multiplier for gap size filtering, and colors for bullish/bearish/midline.
3. Chart Data
Price Data:
Open, high, low, close, and ATR (Average True Range) are stored for use in calculations.
4. Functions
label_maker:
Draws an up or down arrow label at a given point, colored for bullish or bearish.
fvg_manage:
Checks if any FVGs in the array have been "invalidated" (i.e., price has crossed their boundary). If so, moves them to the invalidated array.
inv_manage:
Manages invalidated FVGs, checking if a signal should be fired (i.e., price has reacted to the gap). Also removes old FVGs.
send_it:
Draws the FVGs and their labels on the chart, using boxes and lines for visualization.
5. Main Logic and Visualization
FVG Detection:
On each bar, checks for new bullish or bearish FVGs based on price action and ATR filter.
Adds new FVGs to the appropriate array.
FVG Management:
Updates the arrays, moves invalidated FVGs, and checks for signals.
Drawing:
On the last bar, clears all previous drawings and redraws the current FVGs and their labels.
6. Alerts
Alert Conditions:
Sets up alerts for when a bullish or bearish IFVG signal is triggered, so users can be notified.
Summary
In short:
This script automatically finds and tracks "Imbalance Fair Value Gaps" on your chart, highlights them, and alerts you when price interacts with them in a significant way. It uses advanced Pine Script features to manage and visualize these zones dynamically, helping traders spot potential reversal or continuation points based on gap theory

Impulse Alert - Supply (Sell) [Fixed]🟥 Supply Zone (Sell) – Institutional Order Block Detector
This custom indicator automatically detects valid Supply Zones (Sell Zones) based on Smart Money Concepts and institutional trading behavior.
🔍 How It Works:
Identifies strong bearish impulsive moves after price forms a potential Order Block
Valid supply zones are plotted after:
A valid rally–base–drop or drop–base–drop structure
A shift in structure or clear imbalance is detected
The zone is created from the last bullish candle before a strong bearish engulfing move
Zones remain on chart until price revisits and reacts
📊 Use Case:
Ideal for traders using Smart Money Concepts (SMC), Supply & Demand, or ICT-inspired strategies
Perfect for scalping, day trading, or swing setups
Designed for confluence with HTF bias and LTF execution
⚙️ Features:
Supply Zone auto-plotting
Customizable zone color and opacity
Alerts when price returns to the zone (retest entry opportunity)
🧠 Tip for Best Use:
Use in confluence with:
HTF Supply zones (manual or other indicator)
Market Structure breaks
Fair Value Gaps or Imbalance zones
Strong impulsive moves from HTF to LTF
🔁 Future Additions (Coming Soon):
Demand Zone detection
Zone strength rating system
Refined zone filters (volume, candle size, etc.)
Alerts for mitigation or invalidation
📌 Created by: Rohit Jadhav | Real-time market trader | YT/Insta - @GrowthByTrading
💬 Feedback? Drop a comment or connect via profile for updates and tutorials!

Apex Edge - VantageApex Edge – Vantage
Quarter-Wick Reversal System | Price Action Based | Non-Repainting | Visual Confirmation Tool
Overview:
Apex Edge – Vantage is a precision price action indicator built to assist traders in identifying high-probability reversal entries — not based on indicators, but on how candles behave at their extremes.
This tool implements a clean, repeatable framework that reflects how I personally trade:
Spot a candle that closes with strong directional intent,
Then wait for a controlled pullback into the outer quarter,
And strike — only if price respects that line.
There’s no magic here — just raw, tactical logic visualized clearly on your chart. It's not designed to predict the market — it's built to respond when price offers you Vantage.
Core Logic:
Dot Detection – Final Quarter Close Candles
A green dot prints below a bullish candle if it closes within the top 25% of its wick-to-wick range.
A red dot prints above a bearish candle if it closes within the bottom 25% of its range.
These dots signify candles that made a strong, deliberate move in one direction — where price was pushed to an extreme and held that extreme into the close. These candles often signal institutional intent or momentum imbalance.
Entry Confirmation – Controlled Wick Rebalance
On the very next candle only, price must wick into the prior dot candle's outer quarter — but must not pass beyond it.
For buy entries, the wick must enter the bottom 25% of the previous green dot candle, but not dip below it.
For sell entries, the wick must reach into the top 25% of the red dot candle, but not exceed it.
This wick into the quarter is seen as a controlled rebalancing — a tactical reaction back into the origin zone before potential continuation.
Arrow Printing – Visual Entry Signal
Once the entry criteria are confirmed, an arrow is printed after the candle closes.
This arrow continues to print on each new candle as long as price does not violate the original entry zone — giving visual confirmation that the trade thesis is still valid.
If price breaks above/below the quarter range, the arrow disappears.
This ongoing confirmation is useful for staying in trades, managing risk, or spotting failed setups early.
Automatic Stop Loss Level
A horizontal Stop Loss line is drawn from the extreme wick of the original dot candle.
For buy entries, SL is placed below the green dot candle's low.
For sell entries, SL is placed above the red dot candle's high.
This provides immediate risk context — perfect for traders using limit orders or looking to scale in.
Coding Logic:
This script uses plotshape() and plot() functions for all visual elements.
Dot candles are identified using quarter-range logic via:
pinescript
Copy
Edit
close >= high - (high - low) * 0.25 // for bullish
close <= low + (high - low) * 0.25 // for bearish
Entry validation logic triggers only on the next candle, using:
pinescript
Copy
Edit
low >= quarterLine and low <= high // for buy entries
high <= quarterLine and high >= low // for sell entries
Arrows and SL lines are plotted only on closed candles, ensuring non-repainting behavior.
alertcondition() is used for real-time alerts on valid buy/sell triggers.
How I Personally Use It:
I wait for a dot to print — this shows directional conviction.
On the next candle, I watch for a tap into the outer quarter.
If the wick meets the criteria and the candle closes, I’ll execute manually at the close of that candle.
As long as the arrow remains on the chart, I know the setup hasn’t been invalidated.
I combine this with market structure, session timing, and liquidity context to build confluence around each trade.
Alerts Included:
Buy Entry Alert: When a green arrow prints (entry confirmed)
Sell Entry Alert: When a red arrow prints (entry confirmed)
These fire once per confirmed signal, allowing you to react in real-time or automate if desired.
Who This Is For:
Manual traders who want clean price-based entries
Anyone who uses market structure, SMC, or liquidity concepts
Traders looking to replace indicators with pure candle logic
Discretionary or semi-systematic traders who want visual tools to guide their decisions
Final Word
Apex Edge – Vantage doesn’t predict price — it shows you where price is offering you control.
This is a surgical tool designed to help you act only when the market gives you a measurable edge — and to stay in the trade as long as that edge holds.
If you're ready to stop chasing trades and start striking from a position of Vantage, then this tool belongs on your chart.

Z-Score Volume with CVD Clustering Script Title:
Z-Score Volume with CVD Clustering & NY VWAP
📘 Description:
This indicator combines statistical volume analysis with order flow confirmation to detect high-probability trade zones and volume-based divergences.
📌 Components:
Z-Score of Volume: Identifies statistically significant volume surges or drops relative to a moving average baseline.
Cumulative Volume Delta (CVD): Gauges net buying vs. selling pressure using high-frequency bid/ask delta.
K-Means Clustering: Applies clustering logic to classify each bar into:
Cluster 2 – Strong Bullish: Z-Score and CVD both strong
Cluster 1 – Divergence / Bull Trap: Z-Score high, but weak CVD
Cluster 0 – Neutral / Noise: No clear alignment
Anchored VWAP (NY Session Open): Confirms market structure and institutional trend bias from 9:30 AM ET forward.
🎯 Suggested Applications:
✅ 1. Trend Continuation Entries (Add-ons):
Look to add to positions when:
Cluster 2 signal occurs
Price is above the NY session VWAP
Price structure has broken out of prior day high/low or range
⚠️ 2. Divergence Detection (Fade Traps):
Cluster 1 signals a bearish divergence (e.g., high volume but weak CVD).
Especially useful when price is failing to stay above VWAP.
Useful for early exits or reversal setups.
📊 3. Volume Profile Confirmation:
Combine with fixed or session-based volume profile tools.
Use Z-Score clusters to confirm volume spikes into low-volume nodes (LVNs) or during imbalance transitions.
📍 4. VWAP Structure Confirmation:
Anchored VWAP acts as a dynamic reference point.
Helps confirm acceptance vs. rejection zones at key institutional levels.
📈 Visuals & Alerts:
Color-coded volume bars show intensity of Z-Score & CVD confluence
CVD Line plots real-time delta bias with green/red coloring
Cluster-based shape markers highlight key bars for actionable signals
Optional: Add alerts for Cluster 2 above VWAP or Cluster 1 below VWAP
⚙️ Customization Options:
Adjustable Z-Score length
Custom anchor timeframe for CVD (e.g., 1D or sessions)
Adjustable max lookback depth
Toggle VWAP inclusion
Extendable to include additional filters: RSI, structure break alerts, etc.
🔧 Ideal Use Cases:
NY session intraday traders (ES, NQ, CL, 6E, FX pairs)
Breakout traders wanting order flow confirmation
Mean reversion traders spotting fake moves
Volume-based scalpers looking for edge on short-term order imbalance

Delta Spike Detector [GSK-VIZAG-AP-INDIA]📌 Delta Spike Detector – Volume Imbalance Ratio
By GSK-VIZAG-AP-INDIA
📘 Overview
This indicator highlights aggressive buying or selling activity by analyzing the imbalance between estimated Buy and Sell volume per candle. It flags moments when one side dominates the other significantly — defined by user-selectable volume ratio thresholds (10x, 15x, 20x, 25x).
📊 How It Works
Buy/Sell Volume Estimation
Approximates buyer and seller participation using candle structure:
Buy Volume = Proximity of close to low
Sell Volume = Proximity of close to high
Delta & Delta Ratio
Delta = Buy Volume − Sell Volume
Delta Ratio = Ratio of dominant volume side to the weaker side
When this ratio exceeds a threshold, it’s classified as a spike.
Spike Labels
Labels are plotted on the chart:
10x B, 15x B, 20x B, 25x B → Buy Spike Labels (below candles)
10x S, 15x S, 20x S, 25x S → Sell Spike Labels (above candles)
The color of each label reflects the spike strength.
⚙️ User Inputs
Enable/Disable Buy or Sell Spikes
Set custom delta ratio thresholds (default: 10x, 15x, 20x, 25x)
🎯 Use Cases
Spotting sudden aggressive activity (e.g. smart money moves, traps, breakouts)
Identifying short-term market exhaustion or momentum bursts
Complementing other trend or volume-based tools
⚠️ Important Notes
The script uses approximated Buy/Sell Volume based on price position, not actual order flow.
This is not a buy/sell signal generator. It should be used in context with other confirmation indicators or market structure.
✍️ Credits
Developed by GSK-VIZAG-AP-INDIA
For educational and research use only.

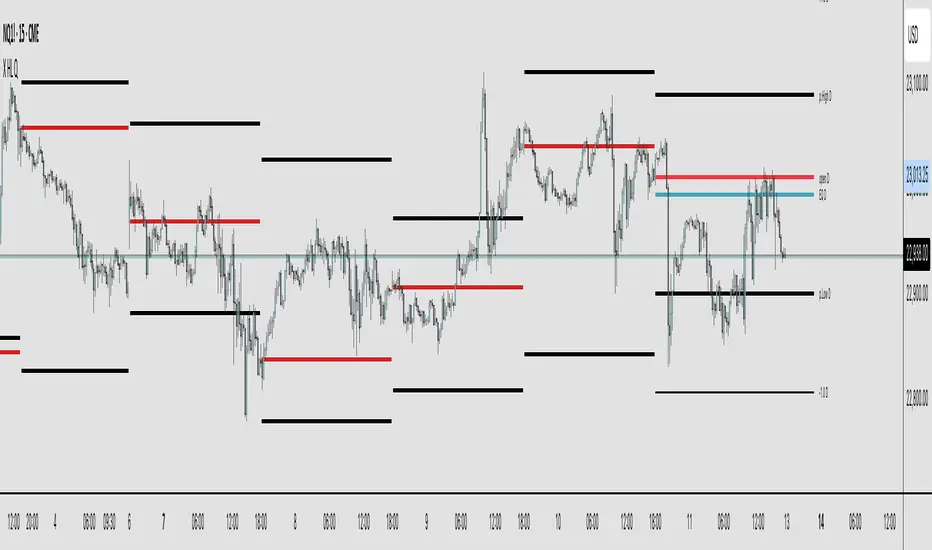
X HL QA market structure tool designed to frame price action within a defined context of prior session dynamics. It accomplishes this by anchoring a set of reference levels to the high, low, and open prices of a user-specified higher timeframe (e.g., 4H, 1D, etc.) and projecting those levels onto the current chart for ongoing analysis.
At its core, the indicator establishes a reference range—derived from the previous completed instance of the selected timeframe—and overlays this on the current timeframe. This range serves as a foundational structure for price interpretation in the current session.
Building upon this framework, the script constructs a set of symmetrical quadrants (or deviation zones) both inside and outside of the prior range. These include:
The midpoint (EQ) of the prior range
Levels at ±0.25x, ±0.75x, ±1.0x, ±1.5x, and ±2.0x the range height
These levels act as contextual zones that traders can use to interpret price behavior—whether it's consolidating within the prior range, approaching fair value (EQ), or expanding into directional continuation or reversal zones beyond the range.
The script operates in both real-time and historical contexts. On live bars, it dynamically updates the key levels to provide an evolving view of current price positioning. Simultaneously, it supports the display of historical levels for past sessions, enabling robust backtesting and comparative analysis of price behavior relative to previous quadrant structures.
Ultimately, this tool serves as a positional map, helping traders assess where price is trading relative to significant levels from the prior session, offering insights into potential support/resistance, overextension, or mean reversion scenarios.
Key Technical Features
Multi-Timeframe Support:
request.security() is used to pull data from a user-defined higher timeframe regardless of the current chart interval.
Visual Flexibility:
Toggle between "line" and "channel" mode.
Line color, width, and visibility are all user-controlled.
Anchoring Options:
Deviation levels can be calculated from either the previous period's open or its EQ (midpoint), giving flexibility depending on analytical preference.
Efficient Labeling:
Labels are only rendered on the last bar and are automatically cleared and redrawn to prevent duplication.
Label style, size, text color, and background color are all user-configurable.
Trading Application
This indicator is especially suited for:
1. Mean Reversion Strategies
When price moves beyond +1.0 or +1.5 deviations from the EQ or open, it may signal overextension and a potential snap back to the midpoint or range.
2. Breakout Confirmation
Sustained price action beyond ±1.0 levels may indicate trend strength or continuation beyond historical balance zones.
3. Contextual Range Awareness
EQ and Open provide structure from which traders can judge whether price is in a state of balance or imbalance.
Labels offer at-a-glance interpretation of key levels across any chosen timeframe.
4. Fractal and Multi-Session Analysis
Analysts can layer daily, weekly, and monthly versions of this indicator to observe confluence or divergence of higher timeframe structure.
IU Liquidity Flow TrackerDESCRIPTION
The IU Liquidity Flow Tracker is a powerful market analysis tool designed to visualize hidden buying and selling activity by analyzing price action, volume behavior, market pressure, and depth. It provides a composite view of liquidity dynamics to help traders identify accumulation, distribution, and neutral phases with high clarity.
This indicator is ideal for traders who want to gauge the flow of market participants and make informed entry/exit decisions based on the underlying liquidity structure.
USER INPUTS:
* Flow Analysis Period: Length used for analyzing price spread and volume flow.
* Pressure Sensitivity: Adjusts the sensitivity of threshold detection for flow classification.
* Flow Smoothing: Controls the smoothing applied to raw flow data.
* Market Depth Analysis: Sets the depth range for rejection and wick analysis.
* Colors: Customize colors for accumulation, distribution, neutral zones, and pressure visualization.
INDICATOR LOGIC:
The IU Liquidity Flow Tracker uses a multi-factor model to evaluate market behavior:
1. Liquidity Pressure: Combines price spread, price efficiency, and volume imbalance.
2. Flow Direction: Weighted momentum using short, medium, and long-term price changes adjusted for volume.
3. Market Depth: Wick-based rejection scoring to estimate buying/selling aggressiveness at price extremes.
4. Composite Flow Index: Blended value of flow direction, pressure, and depth—smoothed for clarity.
5. Dynamic Thresholds: Automatically adjusts based on volatility to classify the market into:
* Accumulation: Strong buying signals.
* Distribution: Strong selling signals.
* Neutral: No significant flow dominance.
6. Entry Signals: Long/Short signals are generated when flow state shifts, supported by momentum, volume surge, and depth strength.
WHY IT IS UNIQUE:
Unlike typical indicators that rely solely on price or volume, this tool combines spread behavior, volume polarity, momentum weighting, and price rejection zones into a single visual interface. It dynamically adjusts sensitivity based on market volatility, helping avoid false signals during sideways or low-volume periods.
It is not based on any traditional indicator (RSI, MACD, etc.), making it ideal for traders looking for an original and data-driven market read.
HOW USER CAN BENEFIT FROM IT:
* Understand Market Context: Know whether the market is being accumulated, distributed, or ranging.
* Improve Entries/Exits: Use flow transitions combined with volume confirmation for high-probability setups.
* Spot Institutional Activity: Detect subtle shifts in liquidity that precede major price moves.
* Reduce Whipsaws: Dynamic thresholds and multi-factor confirmation help filter noise.
* Use with Any Style: Whether you're a swing trader, day trader, or scalper, this tool adapts to different timeframes and strategies.
DISCLAIMER:
This indicator is created for educational and informational purposes only. It does not constitute financial advice or a recommendation to buy or sell any asset. All trading involves risk, and users should conduct their own analysis or consult with a qualified financial advisor before making any trading decisions. The creator is not responsible for any losses incurred through the use of this tool. Use at your own discretion.

GEEKSDOBYTE IFVG w/ Buy/Sell Signals1. Inputs & Configuration
Swing Lookback (swingLen)
Controls how many bars on each side are checked to mark a swing high or swing low (default = 5).
Booleans to Toggle Plotting
showSwings – Show small triangle markers at swing highs/lows
showFVG – Show Fair Value Gap zones
showSignals – Show “BUY”/“SELL” labels when price inverts an FVG
showDDLine – Show a yellow “DD” line at the close of the inversion bar
showCE – Show an orange dashed “CE” line at the midpoint of the gap area
2. Swing High / Low Detection
isSwingHigh = ta.pivothigh(high, swingLen, swingLen)
Marks a bar as a swing high if its high is higher than the highs of the previous swingLen bars and the next swingLen bars.
isSwingLow = ta.pivotlow(low, swingLen, swingLen)
Marks a bar as a swing low if its low is lower than the lows of the previous and next swingLen bars.
Plotting
If showSwings is true, small red downward triangles appear above swing highs, and green upward triangles below swing lows.
3. Fair Value Gap (3‐Bar) Identification
A Fair Value Gap (FVG) is defined here using a simple three‐bar logic (sometimes called an “inefficiency” in price):
Bullish FVG (bullFVG)
Checks if, two bars ago, the low of that bar (low ) is strictly greater than the current bar’s high (high).
In other words:
bullFVG = low > high
Bearish FVG (bearFVG)
Checks if, two bars ago, the high of that bar (high ) is strictly less than the current bar’s low (low).
In other words:
bearFVG = high < low
When either condition is true, it identifies a three‐bar “gap” or unfilled imbalance in the market.
4. Drawing FVG Zones
If showFVG is enabled, each time a bullish or bearish FVG is detected:
Bullish FVG Zone
Draws a semi‐transparent green box from the bar two bars ago (where the gap began) at low up to the current bar’s high.
Bearish FVG Zone
Draws a semi‐transparent red box from the bar two bars ago at high down to the current bar’s low.
These colored boxes visually highlight the “fair value imbalance” area on the chart.
5. Inversion (Fill) Detection & Entry Signals
An inversion is defined as the price “closing through” that previously drawn FVG:
Bullish Inversion (bullInversion)
Occurs when a bullish FVG was identified on bar-2 (bullFVG), and on the current bar the close is greater than that old bar-2 low:
bullInversion = bullFVG and close > low
Bearish Inversion (bearInversion)
Occurs when a bearish FVG was identified on bar-2 (bearFVG), and on the current bar the close is lower than that old bar-2 high:
bearInversion = bearFVG and close < high
When an inversion is true, the indicator optionally draws two lines and a label (depending on input toggles):
Draw “DD” Line (yellow, solid)
Plots a horizontal yellow line from the current bar’s close price extending five bars forward (bar_index + 5). This is often referred to as a “Demand/Daily Demand” line, marking where price inverted the gap.
Draw “CE” Line (orange, dashed)
Calculates the midpoint (ce) of the original FVG zone.
For a bullish inversion:
ce = (low + high) / 2
For a bearish inversion:
ce = (high + low) / 2
Plots a horizontal dashed orange line at that midpoint for five bars forward.
Plot Label (“BUY” / “SELL”)
If showSignals is true, a green “BUY” label is placed at the low of the current bar when a bullish inversion occurs.
Likewise, a red “SELL” label at the high of the current bar when a bearish inversion happens.
6. Putting It All Together
Swing Markers (Optional):
Visually confirm recent swing highs and swing lows with small triangles.
FVG Zones (Optional):
Highlight areas where price left a 3-bar gap (bullish in green, bearish in red).
Inversion Confirmation:
Wait for price to close beyond the old FVG boundary.
Once that happens, draw the yellow “DD” line at the close, the orange dashed “CE” line at the zone’s midpoint, and place a “BUY” or “SELL” label exactly on that bar.
User Controls:
All of the above elements can be individually toggled on/off (showSwings, showFVG, showSignals, showDDLine, showCE).
In Practice
A bullish FVG forms whenever a strong drop leaves a gap in liquidity (three bars ago low > current high).
When price later “fills” that gap by closing above the old low, the script signals a potential long entry (BUY), draws a demand line at the closing price, and marks the midpoint of that gap.
Conversely, a bearish FVG marks a potential short zone (three bars ago high < current low). When price closes below that gap’s high, it signals a SELL, with similar lines drawn.
By combining these elements, the indicator helps users visually identify inefficiencies (FVGs), confirm when price inverts/fills them, and place straightforward buy/sell labels alongside reference lines for trade management.

Demand Index (Hybrid Sibbet) by TradeQUODemand Index (Hybrid Sibbet) by TradeQUO \
\Overview\
The Demand Index (DI) was introduced by James Sibbet in the early 1990s to gauge “real” buying versus selling pressure by combining price‐change information with volume intensity. Unlike pure price‐based oscillators (e.g. RSI or MACD), the DI highlights moves backed by above‐average volume—helping traders distinguish genuine demand/supply from false breakouts or low‐liquidity noise.
\Calculation\
\
\ \Step 1: Weighted Price (P)\
For each bar t, compute a weighted price:
```
Pₜ = Hₜ + Lₜ + 2·Cₜ
```
where Hₜ=High, Lₜ=Low, Cₜ=Close of bar t.
Also compute Pₜ₋₁ for the prior bar.
\ \Step 2: Raw Range (R)\
Calculate the two‐bar range:
```
Rₜ = max(Hₜ, Hₜ₋₁) – min(Lₜ, Lₜ₋₁)
```
This Rₜ is used indirectly in the exponential dampener below.
\ \Step 3: Normalize Volume (VolNorm)\
Compute an EMA of volume over n₁ bars (e.g. n₁=13):
```
EMA_Volₜ = EMA(Volume, n₁)ₜ
```
Then
```
VolNormₜ = Volumeₜ / EMA_Volₜ
```
If EMA\_Volₜ ≈ 0, set VolNormₜ to a small default (e.g. 0.0001) to avoid division‐by‐zero.
\ \Step 4: BuyPower vs. SellPower\
Calculate “raw” BuyPowerₜ and SellPowerₜ depending on whether Pₜ > Pₜ₋₁ (bullish) or Pₜ < Pₜ₋₁ (bearish). Use an exponential dampener factor Dₜ to moderate extreme moves when true range is small. Specifically:
• If Pₜ > Pₜ₋₁,
```
BuyPowerₜ = (VolNormₜ) / exp
```
otherwise
```
BuyPowerₜ = VolNormₜ.
```
• If Pₜ < Pₜ₋₁,
```
SellPowerₜ = (VolNormₜ) / exp
```
otherwise
```
SellPowerₜ = VolNormₜ.
```
Here, H₀ and L₀ are the very first bar’s High/Low—used to calibrate the scale of the dampening. If the denominator of the exponential is near zero, substitute a small epsilon (e.g. 1e-10).
\ \Step 5: Smooth Buy/Sell Power\
Apply a short EMA (n₂ bars, typically n₂=2) to each:
```
EMA_Buyₜ = EMA(BuyPower, n₂)ₜ
EMA_Sellₜ = EMA(SellPower, n₂)ₜ
```
\ \Step 6: Raw Demand Index (DI\_raw)\
```
DI_rawₜ = EMA_Buyₜ – EMA_Sellₜ
```
A positive DI\_raw indicates that buying force (normalized by volume) exceeds selling force; a negative value indicates the opposite.
\ \Step 7: Optional EMA Smoothing on DI (DI)\
To reduce choppiness, compute an EMA over DI\_raw (n₃ bars, e.g. n₃ = 1–5):
```
DIₜ = EMA(DI_raw, n₃)ₜ.
```
If n₃ = 1, DI = DI\_raw (no further smoothing).
\
\Interpretation\
\
\ \Crossing Zero Line\
• DI\_raw (or DI) crossing from below to above zero signals that cumulative buying pressure (over the chosen smoothing window) has overcome selling pressure—potential Long signal.
• Crossing from above to below zero signals dominant selling pressure—potential Short signal.
\ \DI\_raw vs. DI (EMA)\
• When DI\_raw > DI (the EMA of DI\_raw), bullish momentum is accelerating.
• When DI\_raw < DI, bullish momentum is weakening (or bearish acceleration).
\ \Divergences\
• If price makes new highs while DI fails to make higher highs (DI\_raw or DI declining), this hints at weakening buying power (“bearish divergence”), possibly preceding a reversal.
• If price makes new lows while DI fails to make lower lows (“bullish divergence”), this may signal waning selling pressure and a potential bounce.
\ \Volume Confirmation\
• A strong price move without a corresponding rise in DI often indicates low‐volume “fake” moves.
• Conversely, a modest price move with a large DI spike suggests true institutional participation—often a more reliable breakout.
\
\Usage Notes & Warnings\
\
\ \Never Use DI in Isolation\
It is a \filter\ and \confirmation\ tool—combine with price‐action (trendlines, support/resistance, candlestick patterns) and risk management (stop‐losses) before executing trades.
\ \Parameter Selection\
• \Vol EMA length (n₁)\: Commonly 13–20 bars. Shorter → more responsive to volume spikes, but noisier.
• \Buy/Sell EMA length (n₂)\: Typically 2 bars for fast smoothing.
• \DI smoothing (n₃)\: Usually 1 (no smoothing) or 3–5 for moderate smoothing. Long DI\_EMA (e.g. 20–50) gives a slower signal.
\ \Market Adaptation\
Works well in liquid futures, indices, and heavily traded stocks. In thinly traded or highly erratic markets, adjust n₁ upward (e.g., 20–30) to reduce noise.
---
\In Summary\
The Demand Index (James Sibbet) uses a three‐stage smoothing (volume → Buy/Sell Power → DI) to reveal true demand/supply imbalance. By combining normalized volume with price change, Sibbet’s DI helps traders identify momentum backed by real participation—filtering out “empty” moves and spotting early divergences. Always confirm DI signals with price action and sound risk controls before trading.

ICT Intraday FrameworkAutomating The Basics Of ICT Intraday Concepts:
NWOG/NDOG
-from 4:14pm to 9:29am a line will be drawn from 4:14pm close to anticipate ndog/nwog
-once 9:30am or later NDOG/NWOG is drawn with High, Mid, and Low prices
-has option to extend High, Mid, and Low price lines until start of new day at 2/3pm
First Presented Imbalance
-draws fp imb from 9:30-10am
-has option to extend High, Mid, and Low price lines until start of new day at 2/3pm
Custom Macro Window
-draw box around high and low of macro
-first presented imbalance of macro window
Future concepts im planning to add:
Asia BSL/SSL Highlight

Volume Range Profile with Fair Value (Zeiierman)█ Overview
The Volume Range Profile with Fair Value (Zeiierman) is a precision-built volume-mapping tool designed to help traders visualize where institutional-level activity is occurring within the price range — and how that volume behavior shifts over time.
Unlike traditional volume profiles that rely on fixed session boundaries or static anchors, this tool dynamically calculates and displays volume zones across both the upper and lower ends of a price range, revealing point-of-control (POC) levels, directional volume flow, and a fair value drift line that updates live with each candle.
You’re not just looking at volume anymore. You’re dissecting who’s in control — and at what price.
⚪ In simple terms:
Upper Zone = The upper portion of the price range, showing concentrated volume activity — typically where selling or distribution may occur
Lower Zone = The lower portion of the price range, highlighting areas of high volume — often associated with buying or accumulation
POC Bin = The bin (price level) with the highest traded volume in the zone — considered the most accepted price by the market
Fair Value Trend = A dynamic trend line tracking the average POC price over time — visualizing the evolving fair value
Zone Labels = Display real-time breakdown of buy/sell volume within each zone and inside the POC — revealing who’s in control
█ How It Works
⚪ Volume Zones
Upper Zone: Anchored at the highest high in the lookback period
Lower Zone: Anchored at the lowest low in the lookback period
Width is user-defined via % of range
Each zone is divided into a series of volume bins
⚪ Volume Bins (Histograms)
Each zone is split into N bins that show how much volume occurred at each level:
Taller = More volume
The POC bin (Point of Control) is highlighted
Labels show % of volume in the POC relative to the whole zone
⚪ Buy vs Sell Breakdown
Each volume bin is split by:
Buy Volume = Close ≥ Open
Sell Volume = Close < Open
The script accumulates these and displays total Buy/Sell volume per zone.
⚪ Fair Value Drift Line
A POC trend is plotted over time:
Represents where volume was most active across each range
Color changes dynamically — green for rising, red for falling
Serves as a real-time fair value anchor across changing market structure
█ How to Use
⚪ Identify Key Control Zones
Use Upper/Lower Zone structures to understand where supply and demand is building.
Zones automatically adapt to recent highs/lows and re-center volume accordingly.
⚪ Follow Institutional Activity
Watch for POC clustering near price tops or bottoms.
Large volumes near extremes may indicate accumulation or distribution.
⚪ Spot Fair Value Drift
The fair value trend line (average POC price) gives insight into market equilibrium.
One strategy can be to trade a re-test of the fair value trend, trades are taken in the direction of the current trend.
█ Understanding Buy & Sell Volume Labels (Zone Totals)
These labels show the total buy and sell volume accumulated within each zone over the selected lookback period:
Buy Vol (green label) → Total volume where candles closed bullish
Sell Vol (red label) → Total volume where candles closed bearish
Together, they tell you which side dominated:
Higher Buy Vol → Bullish accumulation zone
Higher Sell Vol → Bearish distribution zone
This gives a quick visual insight into who controlled the zone, helping you spot areas of demand or supply imbalance.
█ Understanding POC Volume Labels
The POC (Point of Control) represents the price level where the most volume occurred within the zone. These labels break down that volume into:
Buy % – How much of the volume was buying (price closed up)
Sell % – How much was selling (price closed down)
Total % – How much of the entire zone’s volume happened at the POC
Use it to spot strong demand or supply zones:
High Buy % + High Total % → Strong buying interest = likely support
High Sell % + High Total % → Strong selling pressure = likely resistance
It gives a deeper look into who was in control at the most important price level.
█ Why It’s Useful
Track where fair value is truly forming
Detect aggressive volume accumulation or dumping
Visually split buyer/seller control at the most relevant price levels
Adapt volume structures to current trend direction
█ Settings Explained
Lookback Period: Number of bars to scan for highs/lows. Higher = smoother zones, Lower = reactive.
Zone Width (% of Range): Controls how much of the range is used to define each zone. Higher = broader zones.
Bins per Zone: Number of volume slices per zone. Higher = more detail, but heavier on resources.
-----------------
Disclaimer
The content provided in my scripts, indicators, ideas, algorithms, and systems is for educational and informational purposes only. It does not constitute financial advice, investment recommendations, or a solicitation to buy or sell any financial instruments. I will not accept liability for any loss or damage, including without limitation any loss of profit, which may arise directly or indirectly from the use of or reliance on such information.
All investments involve risk, and the past performance of a security, industry, sector, market, financial product, trading strategy, backtest, or individual's trading does not guarantee future results or returns. Investors are fully responsible for any investment decisions they make. Such decisions should be based solely on an evaluation of their financial circumstances, investment objectives, risk tolerance, and liquidity needs.

Money Flow Pulse💸 In markets where volatility is cheap and structure is noisy, what matters most isn’t just the move — it’s the effort behind it. Money Flow Pulse (MFP) offers a compact, color-coded readout of real-time conviction by scoring volume-weighted price action on a five-tier scale. It doesn’t try to predict reversals or validate trends. Instead, it reveals the quality of the move in progress: is it fading , driving , exhausting , or hollow ?
🎨 MFP draws from the traditional Money Flow Index (MFI), a volume-enhanced momentum oscillator, but transforms it into a modular “pressure readout” that fits seamlessly into any structural overlay. Rather than oscillating between extremes with little interpretive guidance, MFP discretizes the flow into clean, color-coded regimes ranging from strong inflow (+2) to strong outflow (–2). The result is a responsive diagnostic layer that complements, rather than competes with, tools like ATR and/or On-Balance Volume.
5️⃣ MFP uses a normalized MFI value smoothed over 13 periods and classified into a 5-tier readout of Volume-Driven Conviction :
🍆 Exhaustion Inflow — usually a top or blowoff; not strength, but overdrive (+2)
🥝 Active Inflow — supportive of trend continuation (+1)
🍋 Neutral — chop, coil, or fakeouts (0)
🍑 Selling Intent — weakening structure, possible fade setups (-1)
🍆 Exhaustion Outflow — often signals forced selling or accumulation traps (-2)
🎭 These tiers are not arbitrary. Each one is tuned to reflect real capital behavior across timeframes. For instance, while +1 may support continuation, +2 often precedes exhaustion — especially on the lower timeframes. Similarly, a –1 reading during a pullback suggests sell-side pressure is building, but a shift to –2 may mean capitulation is already underway. The difference between the two can define whether a move is tradable continuation or strategic exhaustion .
🌊 The MFI ROC (Rate of Change) feature can be toggled to become a volatility-aware pulse monitor beneath the derived MFI tier. Instead of scoring direction or structure, ROC reveals how fast conviction is changing — not just where it’s headed, but how hard it's accelerating or decaying. It measures the raw Δ between the current and previous MFI values, exposing bursts of energy, fading pressure, or transitional churn .
🎢 Visually, ROC appears as a low-opacity area fill, anchored to a shared lemon-yellow zero line. When the green swell rises, buying pressure is accelerating; when the red drops, flow is actively deteriorating. A subtle bump may signal early interest — while a steep wave hints at an emotional overreaction. The ROC value itself provides numeric insight alongside the raw MFI score. A reading of +3.50 implies strong upside momentum in the flow — often supporting trend ignition. A score of –6.00 suggests rapid deceleration or full exhaustion — often preceding reversals or failed breakouts.
・ MFI shows you where the flow is
・ ROC tells you how it’s behaving
😎 This blend reveals not just structure or intent — but also urgency . And in flow-based trading, urgency often precedes outcome.
🧩 Divergence isn’t delay — it’s disagreement . One of the most revealing features of MFP is how it exposes momentum dissonance — situations where price and flow part ways. These divergences often front-run pivots , traps , or velocity stalls . Unlike RSI-style divergence, which whispers of exhaustion, MFI divergence signals a breakdown in conviction. The structure may extend — but the effort isn’t there.
・ Price ▲ MFI ▼ → Effortless Markup : Often signals distribution or a grind into liquidity. Without rising MFI, the rally lacks true flow participation — a warning of fragility.
・ Price ▼ MFI ▲ → Absorption or Early Accumulation : Price breaks down, but money keeps flowing in — a hidden bid. Watch for MFI tier shifts or ROC bursts to confirm a reversal.
🏄♂️ These moments don’t require signal overlays or setup hunting. MFP narrates the imbalance. When price breaks structure but flow does not — or vice versa — you’re not seeing trend, you’re seeing disagreement, and that's where edge begins.
💤 MFP is especially effective on intraday charts where volume dislocations matter most. On the 1H or 15m chart, it helps distinguish between breakouts with conviction versus those lacking flow. On higher timeframes, its resolution softens — it becomes more of a drift indicator than a trigger device. That’s by design: MFP prioritizes pulse, not position. It’s not the fire, it’s the heat.
📎 Use MFP in confluence with structural overlays to validate price behavior. A ribbon expansion with rising MFP is real. A compression breakout without +1 flow is "fishy". Watch how MFP behaves near key zones like anchored VWAP, MAs or accumulation pivots. When MFP rises into a +2 and fails to sustain, the reversal isn’t just technical — it’s flow-based.
🪟 MFP doesn’t speak loudly, but it never whispers without reason. It’s the pulse check before action — the breath of the move before the breakout. While it stays visually minimal on the chart, the true power is in the often overlooked Data Window, where traders can read and interpret the score in real time. Once internalized, these values give structure-aware traders a framework for conviction, continuation, or caution.
🛜 MFP doesn’t chase momentum — it confirms conviction. And in markets defined by noise, that signal isn’t just helpful — it’s foundational.
