Average Directional Index with MACombining the Average Directional Index (ADX) with a 14-period Exponential Moving Average (EMA) can provide traders with a comprehensive approach to identify both the strength of a trend (through ADX) and the trend's direction (using EMA). Let's break down each component and then discuss how they can be combined:
Average Directional Index (ADX):
The ADX is a technical indicator that measures the strength or momentum of a trend, regardless of its direction. The ADX is derived from two other indicators:
Positive Directional Index (+DI): Measures the strength of upward price movement.
Negative Directional Index (-DI): Measures the strength of downward price movement.
14-period Exponential Moving Average (EMA):
The 14-period EMA is a trend-following indicator that gives more weight to recent price data compared to simple moving averages (SMAs). The EMA is calculated by taking the average of the last 14 closing prices, giving more importance to the most recent prices.
Combining ADX and EMA:
When combining ADX with a 14-period EMA:
ADX as a Filter:
Traders might use the ADX to filter out trades when the trend's strength is weak (e.g., ADX below 25) to avoid trading in sideways or choppy markets.
EMA for Trend Direction:
Traders can use the 14-period EMA to determine the trend direction.
A price above the 14-period EMA might indicate an uptrend, while a price below the EMA might suggest a downtrend.
Example Strategy:
Here's a simplified trading strategy combining ADX and EMA:
Trend Identification:
Buy when the price is above the 14-period EMA and the ADX indicates a strong uptrend (e.g., ADX > 25).
Sell or go short when the price is below the 14-period EMA and the ADX indicates a strong downtrend (e.g., ADX > 25).
Avoid Choppy Markets:
Avoid trading when the ADX is below a certain threshold (e.g., ADX < 25) to filter out sideways or range-bound markets.
Combining ADX and a 14-period EMA can provide traders with a balanced approach to identify both the strength and direction of a trend. However, it's essential to remember that no indicator or strategy can guarantee profits, and it's crucial to use risk management techniques and other tools to make informed trading decisions. Consider back testing this strategy on historical data and adjusting the parameters based on their trading style and risk tolerance.
Cari dalam skrip untuk "index"

Altered Money Flow Index by CoffeeShopCrypto**Use the comments section below to request access to the script**
Market Trends need to be confirmed each and every time.
Over the years the Money Flow Index has been a tool to find where the money is flowing
either long or short in market movements.
Long confirmation and false short
Confirming a long entry:
1. Wait for price to close above a previous swing high.
2. Look to see if the MFI is in UPCOLOR and above ZERO.
Confriming a short entry:
1. Wait for price to close below a previous swing low.
2. Look to see if the MFI is in DOWNCOLOR and below ZERO.
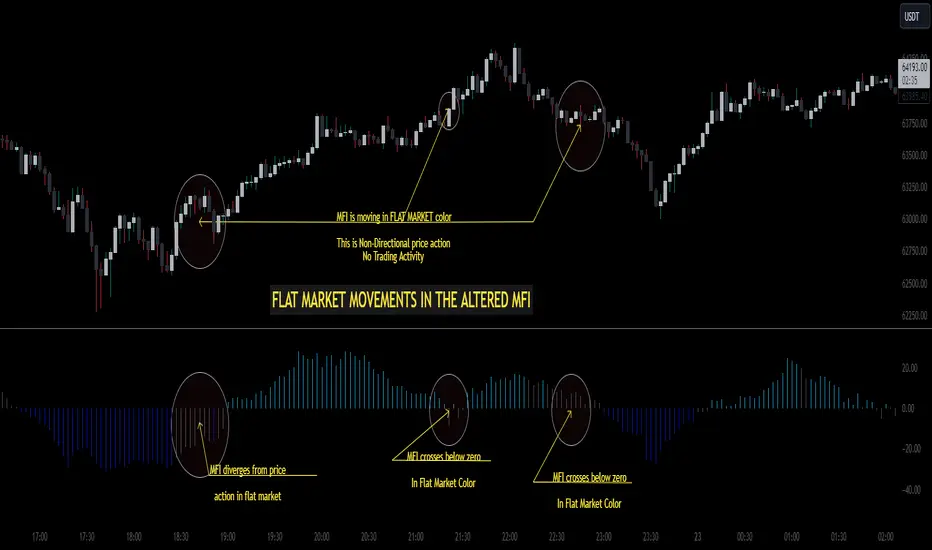
NON-Confirmed market: (Flat Market)
Anytime you believe you have a confirmation via price action, check the MFI to see if it is in FLAT MARKET color.
If this is true, do not enter until it is out of FLAT MARKET color.
Flat Market ALtered MFI
A Flat Market Altered MFI reading can do a few things for you.
It can help to confirm the following:
1. price action is moving sideways.
2. a pullback or market stall that was deep enough where dis-intrest in the market occured.
3. a sudden loss of momentum in the short term trend of closing prices.
Utilizing the Altered Money Flow Index indicator by CoffeeShopCrypto offers traders a nuanced approach to identifying market trends, including periods of flat market conditions. Alongside its directional bias indicating bullish or bearish activity based on whether values are above or below zero, respectively, the script incorporates a distinctive feature to recognize flat markets. When neither bullish nor bearish momentum dominates, the indicator designates a flat market, denoted by a distinct color. This feature enhances traders' ability to discern not only bullish and bearish phases but also periods of market consolidation or indecision.
In addition to its ability to recognize bullish and bearish trends, the Altered Money Flow Index indicator by CoffeeShopCrypto incorporates a unique feature to signify potential pullbacks or pauses in market momentum. This is particularly evident when the MFI crosses below zero while displaying a flat market color. Such occurrences suggest that although the short-term movement may appear bearish, it's likely a temporary pullback rather than a sustained trend reversal. Similarly, when the MFI crosses above zero amidst a flat market color, it indicates a potential pause in bullish momentum, urging traders to exercise caution and await confirmation of a sustained uptrend. By incorporating these nuanced observations, traders can effectively discern between short-term fluctuations and significant trend changes, enabling them to make more judicious trading decisions and avoid premature entries or exits.
Alongside its directional bias indicating bullish or bearish activity based on whether values are above or below zero, respectively, the script integrates the Relative Strength Index (RSI) to further refine market analysis. When the Altered MFI and RSI are both above zero, it suggests a strong bullish trend, indicating significant buying pressure. Conversely, when both indicators are below zero, it indicates a strong bearish trend, signifying heightened selling pressure. By observing the confluence between the Altered MFI and RSI, traders can gain valuable confirmation of bullish or bearish money flow in the market, enabling them to make more informed trading decisions.
Alligator + Fractals + Divergent & Squat Bars + Signal AlertsThe indicator includes Williams Alligator, Williams Fractals, Divergent Bars, Market Facilitation Index, Highest and Lowest Bars, maximum and minimum peak of Awesome Oscillator, and signal alerts based on Bill Williams' Profitunity strategy.
MFI and Awesome Oscillator
According to the Market Facilitation Index Oscillator, the Squat bar is colored blue, all other bars are colored according to the Awesome Oscillator color, except for the Fake bars, colored with a lighter AO color. In the indicator settings, you can enable the display of "Green" bars (in the "Green Bars > Show" field). In the indicator style settings, you can disable changing the color of bars in accordance with the AO color (in the "AO bars" field), including changing the color for Fake bars (in the "Fake AO bars" field).
MFI is calculated using the formula: (high - low) / volume.
A Squat bar means that, compared to the previous bar, its MFI has decreased and at the same time its volume has increased, i.e. MFI < previous bar and volume > previous bar. A sign of a possible price reversal, so this is a particularly important signal.
A Fake bar is the opposite of a Squat bar and means that, compared to the previous bar, its MFI has increased and at the same time its volume has decreased, i.e. MFI > previous bar and volume < previous bar.
A "Green" bar means that, compared to the previous bar, its MFI has increased and at the same time its volume has increased, i.e. MFI > previous bar and volume > previous bar. A sign of trend continuation. But a more significant trend confirmation or warning of a possible reversal is the Awesome Oscillator, which measures market momentum by calculating the difference between the 5 Period and 34 Period Simple Moving Averages (SMA 5 - SMA 34) based on the midpoints of the bars (hl2). Therefore, by default, the "Green" bars and their opposite "Fade" bars are colored according to the color of the Awesome Oscillator.
According to Bill Williams' Profitunity strategy, using the Awesome Oscillator, the third Elliott wave is determined by the maximum peak of AO in the range from 100 to 140 bars. The presence of divergence between the maximum AO peak and the subsequent lower AO peak in this interval also warns of a possible correction, especially if the AO crosses the zero line between these AO peaks. Therefore, the chart additionally displays the prices of the highest and lowest bars, as well as the maximum or minimum peak of AO in the interval of 140 bars from the last bar. In the indicator settings, you can hide labels, lines, change the number of bars and any parameters for the AO indicator - method (SMA, Smoothed SMA, EMA and others), length, source (open, high, low, close, hl2 and others).
Bullish Divergent bar
🟢 A buy signal (Long) is a Bullish Divergent bar with a green circle displayed above it if such a bar simultaneously meets all of the following conditions:
The high of the bar is below all lines of the Alligator indicator.
The closing price of the bar is above its middle, i.e. close > (high + low) / 2.
The low of the bar is below the low of 2 previous bars or below the low of one previous bar, and the low of the second previous bar is a lower fractal (▼). By default, Divergent bars are not displayed, the low of which is lower than the low of only one previous bar and the low of the 2nd previous bar is not a lower fractal (▼), but you can enable the display of any Divergent bars in the indicator settings (by setting the value "no" in the " field Divergent Bars > Filtration").
The following conditions strengthen the Bullish Divergent bar signal:
The opening price of the bar, as well as the closing price, is higher than its middle, i.e. Open > (high + low) / 2.
The high of the bar is below all lines of the open Alligator indicator, i.e. the green line (Lips) is below the red line (Teeth) and the red line is below the blue line (Jaw). In this case, the color of the circle above the Bullish Divergent bar is dark green.
Squat Divergent bar.
The bar following the Bullish Divergent bar corresponds to the green color of the Awesome Oscillator.
Divergence on Awesome Oscillator.
Formation of the lower fractal (▼), in which the low of the Divergent bar is the peak of the fractal.
Bearish Divergent bar
🔴 A signal to sell (Short) is a Bearish Divergent bar under which a red circle is displayed if such a bar simultaneously meets all the following conditions:
The low of the bar is above all lines of the Alligator indicator.
The closing price of the bar is below its middle, i.e. close < (high + low) / 2.
The high of the bar is higher than the high of 2 previous bars or higher than the high of one previous bar, and the high of the second previous bar is an upper fractal (▲). By default, Divergent bars are not displayed, the high of which is higher than the high of only one previous bar and the high of the 2nd previous bar is not an upper fractal (▲), but you can enable the display of any Divergent bars in the indicator settings (by setting the value "no" in the " field Divergent Bars > Filtration").
The following conditions strengthen the Bearish Divergent bar signal:
The opening price of the bar, as well as the closing price, is below its middle, i.e. open < (high + low) / 2.
The low of the bar is above all lines of the open Alligator indicator, i.e. the green line (Lips) is above the red line (Teeth) and the red line is above the blue line (Jaw). In this case, the color of the circle under the Bearish Divergent bar is dark red.
Squat Divergent bar.
The bar following the Bearish Divergent bar corresponds to the red color of the Awesome Oscillator.
Divergence on Awesome Oscillator.
Formation of the upper fractal (▲), in which the high of the Divergent bar is the peak of the fractal.
Alligator lines crossing
Bars crossing the green line (Lips) of the open Alligator indicator is the first warning of a possible correction (price rollback) if one of the following conditions is met:
If the bar closed below the Lips line, which is above the Teeth line, and the Teeth line is above the Jaw line, while the closing price of the previous bar is above the Lips line.
If the bar closed above the Lips line, which is below the Teeth line, and the Teeth line is below the Jaw line, while the closing price of the previous bar is below the Lips line.
The intersection of all open Alligator lines by bars is a sign of a deep correction and a warning of a possible trend change.
Frequent intersection of Alligator lines with each other is a sign of a sideways trend (flat).
Signal Alerts
To receive notifications about signals when creating an alert, you must select the condition "Any alert() function is call", in which case notifications will arrive in the following format:
D — timeframe, for example: D, 4H, 15m.
🟢 BDB⎾ - a signal for a Bullish Divergent bar to buy (Long), triggers once after the bar closes and includes additional signals:
/// — if Alligator is open.
⏉ — if the opening price of the bar, as well as the closing price, is above its middle.
+ Squat 🔷 - Squat bar or + Green ↑ - "Green" bar or + Fake ↓ - Fake bar.
+ AO 🟩 - if after the Divergent bar closes, the oscillator color change for the next bar corresponds the green color of the Awesome Oscillator. ┴/┬ — AO above/below the zero line. ∇ — if there is divergence on AO in the interval of 140 bars from the last bar.
🔴 BDB⎿ - a signal for a Bearish Divergent bar to sell (Short), triggers once after the bar closes and includes additional signals:
/// — if Alligator is open.
⏊ — if the opening price of the bar, as well as the closing price, is below its middle.
+ Squat 🔷 - Squat bar or + Green ↑ - "Green" bar or + Fake ↓ - Fake bar.
+ AO 🟥 - if after the Divergent bar closes, the oscillator color change for the next bar corresponds to the red color of the Awesome Oscillator. ┴/┬ — AO above/below the zero line. ∇ — if there is divergence on AO in the interval of 140 bars from the last bar.
Alert for bars crossing the green line (Lips) of the open Alligator indicator (can be disabled in the indicator settings in the "Alligator > Enable crossing lips alerts" field):
🔴 Crossing Lips ↓ - if the bar closed below the Lips line, which is above than the other lines, while the closing price of the previous bar is above the Lips line.
🟢 Crossing Lips ↑ - if the bar closed above the Lips line, which is below the other lines, while the closing price of the previous bar is below the Lips line.
The fractal signal is triggered after the second bar closes, completing the formation of the fractal, if alerts about fractals are enabled in the indicator settings (the "Fractals > Enable alerts" field):
🟢 Fractal ▲ - upper (Bearish) fractal.
🔴 Fractal ▼ — lower (Bullish) fractal.
⚪️ Fractal ▲/▼ - both upper and lower fractal.
↳ (H=high - L=low) = difference.
If you redirect notifications to a webhook URL, for example, to a Telegram bot, then you need to set the notification template for the webhook in the indicator settings in the "Webhook > Message" field (contains a tooltip with an example), in which you just need to specify the text {{message}}, which will be automatically replaced with the alert text with a ticker and a link to TradingView.
‼️ A signal is not a call to action, but only a reason to analyze the chart to make a decision based on the rules of your strategy.
***
Индикатор включает в себя Williams Alligator, Williams Fractals, Дивергентные бары, Market Facilitation Index, самый высокий и самый низкий бары, максимальный и минимальный пик Awesome Oscillator, а также оповещения о сигналах на основе стратегии Profitunity Билла Вильямса.
MFI и Awesome Oscillator
В соответствии с осциллятором Market Facilitation Index Приседающий бар окрашен в синий цвет, все остальные бары окрашены в соответствии с цветом Awesome Oscillator, кроме Фальшивых баров, которые окрашены более светлым цветом AO. В настройках индикатора вы можете включить отображение "Зеленых" баров (в поле "Green Bars > Show"). В настройках стиля индикатора вы можете выключить изменение цвета баров в соответствии с цветом AO (в поле "AO bars"), в том числе изменить цвет для Фальшивых баров (в поле "Fake AO bars").
MFI рассчитывается по формуле: (high - low) / volume.
Приседающий бар означает, что по сравнению с предыдущим баром его MFI снизился и в тоже время вырос его объем, т.е. MFI < предыдущего бара и объем > предыдущего бара. Признак возможного разворота цены, поэтому это особенно важный сигнал.
Фальшивый бар является противоположностью Приседающему бару и означает, что по сравнению с предыдущим баром его MFI увеличился и в тоже время снизился его объем, т.е. MFI > предыдущего бара и объем < предыдущего бара.
"Зеленый" бар означает, что по сравнению с предыдущим баром его MFI увеличился и в тоже время вырос его объем, т.е. MFI > предыдущего бара и объем > предыдущего бара. Признак продолжения тренда. Но более значимым подтверждением тренда или предупреждением о возможном развороте является Awesome Oscillator, который измеряет движущую силу рынка путем вычисления разницы между 5 Периодной и 34 Периодной Простыми Скользящими Средними (SMA 5 - SMA 34) по средним точкам баров (hl2). Поэтому по умолчанию "Зеленые" бары и противоположные им "Увядающие" бары окрашены в соответствии с цветом Awesome Oscillator.
По стратегии Profitunity Билла Вильямса с помощью осциллятора Awesome Oscillator определяется третья волна Эллиота по максимальному пику AO в интервале от 100 до 140 баров. Наличие дивергенции между максимальным пиком AO и следующим за ним более низким пиком AO в этом интервале также предупреждает о возможной коррекции, особенно если AO переходит через нулевую линию между этими пиками AO. Поэтому на графике дополнительно отображаются цены самого высокого и самого низкого баров, а также максимальный или минимальный пик АО в интервале 140 баров от последнего бара. В настройках индикатора вы можете скрыть метки, линии, изменить количество баров и любые параметры для индикатора AO – метод (SMA, Smoothed SMA, EMA и другие), длину, источник (open, high, low, close, hl2 и другие).
Бычий Дивергентный бар
🟢 Сигналом на покупку (Long) является Бычий Дивергентный бар над которым отображается зеленый круг, если такой бар соответствует одновременно всем следующим условиям:
Максимум бара ниже всех линий индикатора Alligator.
Цена закрытия бара выше его середины, т.е. close > (high + low) / 2.
Минимум бара ниже минимума 2-х предыдущих баров или ниже минимума одного предыдущего бара, а минимум второго предыдущего бара является нижним фракталом (▼). По умолчанию не отображаются Дивергентные бары, минимум которых ниже минимума только одного предыдущего бара и минимум 2-го предыдущего бара не является нижним фракталом (▼), но вы можете включить отображение любых Дивергентных баров в настройках индикатора (установив значение "no" в поле "Divergent Bars > Filtration").
Усилением сигнала Бычьего Дивергентного бара являются следующие условия:
Цена открытия бара, как и цена закрытия, выше его середины, т.е. Open > (high + low) / 2.
Максимум бара ниже всех линий открытого индикатора Alligator, т.е. зеленая линия (Lips) ниже красной линии (Teeth) и красная линия ниже синей линии (Jaw). В этом случае цвет круга над Бычьим Дивергентным баром окрашен в темно-зеленый цвет.
Приседающий Дивергентный бар.
Бар, следующий за Бычьим Дивергентным баром, соответствует зеленому цвету Awesome Oscillator.
Дивергенция на Awesome Oscillator.
Образование нижнего фрактала (▼), у которого минимум Дивергентного бара является пиком фрактала.
Медвежий Дивергентный бар
🔴 Сигналом на продажу (Short) является Медвежий Дивергентный бар под которым отображается красный круг, если такой бар соответствует одновременно всем следующим условиям:
Минимум бара выше всех линий индикатора Alligator.
Цена закрытия бара ниже его середины, т.е. close < (high + low) / 2.
Максимум бара выше маскимума 2-х предыдущих баров или выше максимума одного предыдущего бара, а максимум второго предыдущего бара является верхним фракталом (▲). По умолчанию не отображаются Дивергентные бары, максимум которых выше максимума только одного предыдущего бара и максимум 2-го предыдущего бара не является верхним фракталом (▲), но вы можете включить отображение любых Дивергентных баров в настройках индикатора (установив значение "no" в поле "Divergent Bars > Filtration").
Усилением сигнала Медвежьего Дивергентного бара являются следующие условия:
Цена открытия бара, как и цена закрытия, ниже его середины, т.е. open < (high + low) / 2.
Минимум бара выше всех линий открытого индикатора Alligator, т.е. зеленая линия (Lips) выше красной линии (Teeth) и красная линия выше синей линии (Jaw). В этом случае цвет круга под Медвежьим Дивергентным Баром окрашен в темно-красный цвет.
Приседающий Дивергентный бар.
Бар, следующий за Медвежьим Дивергентным баром, соответствует красному цвету Awesome Oscillator.
Дивергенция на Awesome Oscillator.
Образование верхнего фрактала (▲), у которого максимум Дивергентного бара является пиком фрактала.
Пересечение линий Alligator
Пересечение барами зеленой линии (Lips) открытого индикатора Alligator является первым предупреждением о возможной коррекции (откате цены) при выполнении одного из следующих условий:
Если бар закрылся ниже линии Lips, которая выше линии Teeth, а линия Teeth выше линии Jaw, при этом цена закрытия предыдущего бара находится выше линии Lips.
Если бар закрылся выше линии Lips, которая ниже линии Teeth, а линия Teeth ниже линии Jaw, при этом цена закрытия предыдущего бара находится ниже линии Lips.
Пересечение барами всех линий открытого Alligator является признаком глубокой коррекции и предупреждением о возможной смене тренда.
Частое пересечение линий Alligator между собой является признаком бокового тренда (флэт).
Оповещения о сигналах
Для получения уведомлений о сигналах при создании оповещения необходимо выбрать условие "При любом вызове функции alert()", в таком случае уведомления будут приходить в следующем формате:
D — таймфрейм, например: D, 4H, 15m.
🟢 BDB⎾ — сигнал Бычьего Дивергентного бара на покупку (Long), срабатывает один раз после закрытия бара и включает дополнительные сигналы:
/// — если Alligator открыт.
⏉ — если цена открытия бара, как и цена закрытия, выше его середины.
+ Squat 🔷 — Приседающий бар или + Green ↑ — "Зеленый" бар или + Fake ↓ — Фальшивый бар.
+ AO 🟩 — если после закрытия Дивергентного бара, изменение цвета осциллятора для следующего бара соответствует зеленому цвету Awesome Oscillator. ┴/┬ — AO выше/ниже нулевой линии. ∇ — если есть дивергенция на AO в интервале 140 баров от последнего бара.
🔴 BDB⎿ — сигнал Медвежьего Дивергентного бара на продажу (Short), срабатывает один раз после закрытия бара и включает дополнительные сигналы:
/// — если Alligator открыт.
⏊ — если цена открытия бара, как и цена закрытия, ниже его середины.
+ Squat 🔷 — Приседающий бар или + Green ↑ — "Зеленый" бар или + Fake ↓ — Фальшивый бар.
+ AO 🟥 — если после закрытия Дивергентного бара, изменение цвета осциллятора для следующего бара соответствует красному цвету Awesome Oscillator. ┴/┬ — AO выше/ниже нулевой линии. ∇ — если есть дивергенция на AO в интервале 140 баров от последнего бара.
Сигнал пересечения барами зеленой линии (Lips) открытого индикатора Alligator (можно отключить в настройках индикатора в поле "Alligator > Enable crossing lips alerts"):
🔴 Crossing Lips ↓ — если бар закрылся ниже линии Lips, которая выше остальных линий, при этом цена закрытия предыдущего бара находится выше линии Lips.
🟢 Crossing Lips ↑ — если бар закрылся выше линии Lips, которая ниже остальных линий, при этом цена закрытия предыдущего бара находится ниже линии Lips.
Сигнал фрактала срабатывает после закрытия второго бара, завершающего формирование фрактала, если оповещения о фракталах включены в настройках индикатора (поле "Fractals > Enable alerts"):
🟢 Fractal ▲ — верхний (Медвежий) фрактал.
🔴 Fractal ▼ — нижний (Бычий) фрактал.
⚪️ Fractal ▲/▼ — одновременно верхний и нижний фрактал.
↳ (H=high - L=low) = разница.
Если вы перенаправляете оповещения на URL вебхука, например, в бота Telegram, то вам необходимо установить шаблон оповещения для вебхука в настройках индикатора в поле "Webhook > Message" (содержит подсказку с примером), в котором в качестве текста сообщения достаточно указать текст {{message}}, который будет автоматически заменен на текст оповещения с тикером и ссылкой на TradingView.
‼️ Сигнал — это не призыв к действию, а лишь повод проанализировать график для принятия решения на основе правил вашей стратегии.

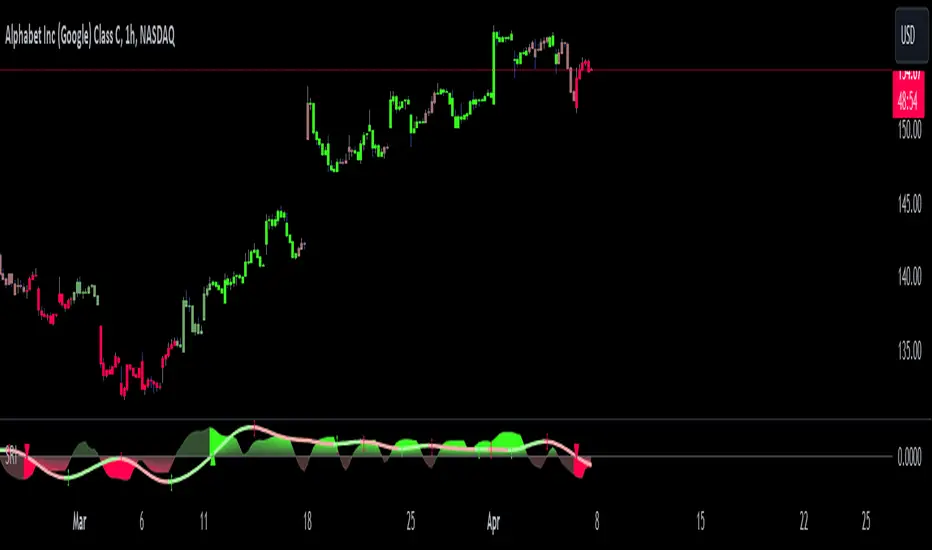
Money Flow Index Divergences [UAlgo]🔶 Description:
This script aims providing traders with comprehensive insights into market dynamics. The indicator offers a multi-faceted approach to technical analysis, encompassing various features to enhance trading decision-making:
🔶Key Features:
Money Flow Index Oscillator Settings: Users can customize the length of the MFI oscillator and the confluence bar length to suit their trading preferences.
Gradient Color Visualization: The indicator utilizes gradient colors to visually represent the MFI oscillator, with colors shifting based on MFI values for enhanced clarity.
Confluence Area Calculation: A confluence area is calculated based on the specified length, providing additional context for MFI movements (Aims to provide longer-term information).
Divergence Detection: The script identifies bullish and bearish divergences by comparing price action with MFI oscillator movements, aiding traders in spotting potential trend reversals.
Customizable Sensitivity: Traders can adjust the sensitivity settings for divergence detection according to their trading strategies.
🔶Calculations:
MFI Calculation:
The script starts by calculating the Money Flow Index (MFI) using the ta.mfi() function, which takes the typical price (hlc3) and a length parameter (default set to 14). The MFI is normalized to a range between 0 and 1 for color gradient calculations.
Another MFI is calculated with a longer length (lengthConfluence, default set to 50) for confluence analysis. Similar to the MFI calculation, the highest and lowest MFI values within the confluence length are determined. The MFI values within the confluence length are normalized. The normalized MFI values are used to calculate the gradient color for the confluence area.
Gradient Color Calculations:
Two sets of RGB color values (redRGB, greenRGB, blueRGB) and (redRGB2, greenRGB2, blueRGB2) are defined to create a gradient color scheme for the MFI plot. The MFI value is normalized between the highest and lowest MFI values within the specified length. The normalized MFI value is then used to calculate the red, green, and blue components of the gradient color.
Plotting Confluence Area:
Two horizontal lines (upperArea and lowerArea) are plotted to highlight the confluence area.
The area between these lines is filled with the gradient color representing MFI confluence.
Divergence Calculations:
Bullish and bearish divergences are identified based on specific conditions related to the MFI and price action.
Bullish divergence occurs when the MFI makes a lower low while price makes a higher low.
Bearish divergence occurs when the MFI makes a higher high while price makes a lower high.
The sensitivity (Pivot calculation length) of divergence detection can be adjusted.
Overall, this script provides a comprehensive analysis of the Money Flow Index, including plotting the MFI with a gradient color scheme, identifying confluence areas, and detecting bullish and bearish divergences to aid traders in making informed decisions.
🔶Disclaimer:
-This script is provided for informational and educational purposes only and should not be considered financial advice.
-Trading involves risk, and users should conduct their own research and analysis before making any investment decisions.
-The author of this script and UAlgo are not liable for any losses incurred as a result of using this indicator.
-Users are encouraged to exercise caution and practice risk management when trading in the financial markets.

F2X IndexThis script is designed to analyze financial market data, particularly focusing on trends and volatility. It allows users to input parameters such as index length and signal length. The script calculates moving averages and differences between the source data and the moving averages. It also optionally adjusts for volatility using the Average True Range (ATR) and can color the signal based on trend direction. The output includes plots for the index and signal, with customizable colors based on trend and volatility. The script provides a visual representation of market dynamics to aid in decision-making for traders and investors.

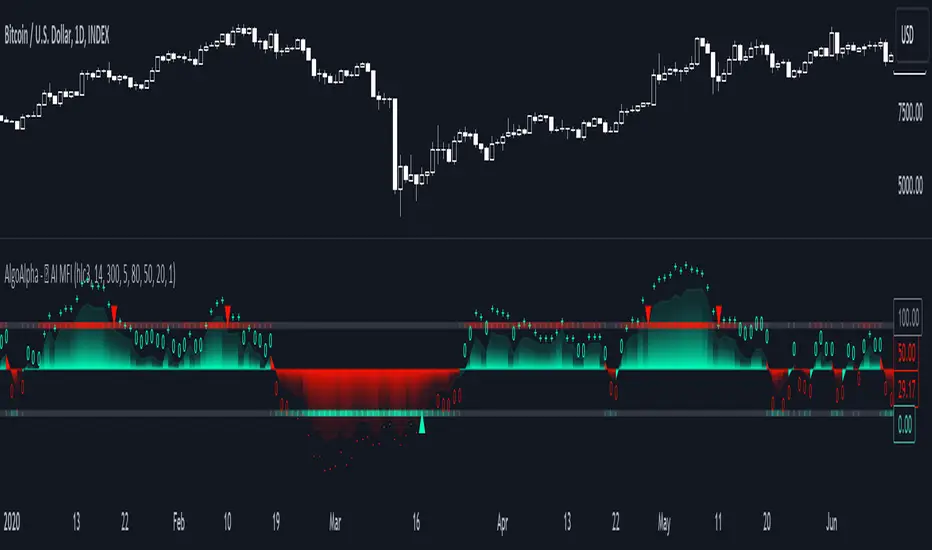
AI Adaptive Money Flow Index (Clustering) [AlgoAlpha]🌟🚀 Dive into the future of trading with our latest innovation: the AI Adaptive Money Flow Index by AlgoAlpha Indicator! 🚀🌟
Developed with the cutting-edge power of Machine Learning, this indicator is designed to revolutionize the way you view market dynamics. 🤖💹 With its unique blend of traditional Money Flow Index (MFI) analysis and advanced k-means clustering, it adapts to market conditions like never before.
Key Features:
📊 Adaptive MFI Analysis: Utilizes the classic MFI formula with a twist, adjusting its parameters based on AI-driven clustering.
🧠 AI-Driven Clustering: Applies k-means clustering to identify and adapt to market states, optimizing the MFI for current conditions.
🎨 Customizable Appearance: Offers adjustable settings for overbought, neutral, and oversold levels, as well as colors for uptrends and downtrends.
🔔 Alerts for Key Market Movements: Set alerts for trend reversals, overbought, and oversold conditions, ensuring you never miss a trading opportunity.
Quick Guide to Using the AI Adaptive MFI (Clustering):
🛠 Customize the Indicator: Customize settings like MFI source, length, and k-means clustering parameters to suit your analysis.
📈 Market Analysis: Monitor the dynamically adjusted overbought, neutral, and oversold levels for insights into market conditions. Watch for classification symbols ("+", "0", "-") for immediate understanding of the current market state. Look out for reversal signals (▲, ▼) to get potential entry points.
🔔 Set Alerts: Utilize the built-in alert conditions for trend changes, overbought, and oversold signals to stay ahead, even when you're not actively monitoring the charts.
How It Works:
The AI Adaptive Money Flow Index employs the k-means clustering machine learning algorithm to refine the traditional Money Flow Index, dynamically adjusting overbought, neutral, and oversold levels based on market conditions. This method analyzes historical MFI values, grouping them into initial clusters using the traditional MFI's overbought, oversold and neutral levels, and then finding the mean of each cluster, which represent the new market states thresholds. This adaptive approach ensures the indicator's sensitivity in real-time, offering a nuanced understanding of market trend and volume analysis.
By recalibrating MFI thresholds for each new data bar, the AI Adaptive MFI intelligently conforms to changing market dynamics. This process, assessing past periods to adjust the indicator's parameters, provides traders with insights finely tuned to recent market behavior. Such innovation enhances decision-making, leveraging the latest data to inform trading strategies. 🌐💥
Shadow Range IndexShadow Range Index (SRI) introduces a new concept to calculate momentum, shadow range.
What is range?
Traditionally, True Range (TR) is the current high minus the current low of each bar in the timeframe. This is often used successfully on its own in indicators, or as a moving average in ATR (Average True Range).
To calculate range, SRI uses an innovative calculation of current bar range that also considers the previous bar. It calculates the difference between its maximum upward and maximum downward values over the number of bars the user chooses (by adjusting ‘Range lookback’).
What is shadow range?
True Range (TR) uses elements in its calculation (the highs and lows of the bar) that are also visible on the chart bars. Shadow range does not, though.
SRI calculates shadow range in a similar formula to range, except that this time it works out the difference between the minimum upward and minimum downward movement. This movement is by its nature less than the maximums, hence a shadow of it. Although more subtle, shadow range is significant, because it is quantifiable, and goes in one direction or another.
Finally, SRI smoothes shadow range and plots it as a histogram, and also smoothes and plots range as a signal line. Useful up and down triangles show trend changes, which optionally colour the chart bars.
Here’s an example of a long trade setup:
In summary, Shadow Range Index identifies and traces maximum and minimum bar range movement both up and down, and plots them as centred oscillators. The dynamics between the two can provide insights into the chart's performance and future direction.
Credit to these authors, whose MA or filters form part of this script:
@balipour - Super Smoother MA
@cheatcountry - Hann window smoothing
@AlgoAlpha - Gaussian filter
Custom Swing Index [AstroHub]Custom Swing Index - Unleashing Precision in Trend Analysis
🌟 Overview:
The Custom Swing Index is a meticulously crafted tool that empowers traders with advanced insights into market dynamics, specifically focusing on identifying potential trend reversals. Developed by AstroHub, this indicator stands out for its unique combination of price-related calculations, ratios, and averages, providing a comprehensive and nuanced view of market sentiment.
📈 Key Components:
Price Calculation:
- Price Change: Captures the difference between the current and previous closing prices.
- High and Low Points: Analyzes the high and low points of each bar for crucial price movement data.
Ratios and Averages:
- Upper-Lower Shadow Ratio: Measures the relationship between the upper and lower shadows.
- Open-Close Ratio: Evaluates the ratio of opening to closing prices.
- Sum Price Changes: Sums up price changes over a specified period.
Differences and Shadows:
- Open-Close Difference: Considers the difference between opening and closing prices.
- Upper and Lower Shadow Ratios: Examines the proportions of upper and lower shadows.
Bar Size Metrics:
- Average Bar Size: Determines the average size of each bar.
- High-Low Difference: Measures the difference between the high and low points.
Swing Indicator Calculation:
- The Custom Swing Index is the result of combining these components, creating a dynamic metric that reflects potential trend reversals.
🚥 How to Use:
Understanding the Indicator:
- Bullish signals may be indicated when the swing index surpasses a defined threshold.
- Bearish signals may be indicated when the swing index falls below the negative threshold.
Visual Interpretation:
- Color-coded bars enhance visual interpretation, turning green for bullish conditions and red for bearish conditions.
Entry Points:
- Look for entry points where circle markings are present, indicating potential opportunities.
Alerts:
- Integrated alerts keep traders informed of significant swings, ensuring timely decision-making.

Supertrended RSI [AlgoAlpha]🚀📈 Introducing the Supertrended RSI Indicator by AlgoAlpha!
Designed to empower your trading decisions, this innovative Pine Script™ creation marries the precision of the Relative Strength Index (RSI) with the dynamic prowess of the SuperTrend methodology. Whether you’re charting the course of cryptos, riding the waves of stock markets, or navigating the futures landscape, our SuperTrended RSI Indicator is your go-to tool for uncovering unique trend insights and crafting trading strategies. 🌟
Key Features:
🔍 Enhanced RSI Analysis: Combines the traditional RSI with a supertrend calculation for a dynamic look at market trends.
🔄 Multiple Moving Averages: Offers a selection of moving averages including SMA, HMA, EMA, and more for tailored analysis.
🎨 Customizable Visuals: Choose your own color scheme for uptrends and downtrends to match your trading dashboard.
📊 Flexible Input Settings: Tailor the indicator with customizable lengths, factors, and smoothing options.
⚡ Real-Time Alerts: Set alerts for bullish and bearish reversals to stay ahead of market movements.
Quick Guide to Using the Supertrended RSI Indicator
Maximize your trading with the Supertrended RSI by following these streamlined steps! 🚀✨
🛠 Add the Indicator: Search for "Supertrended RSI " in TradingView's Indicators & Strategies. Customize settings like RSI length, MA type, and Supertrend factors to fit your trading style.
🎨 Visual Customization: Adjust uptrend and downtrend colors for clear trend visualization.
📊 Market Analysis: Watch for the Supertrend color change for trend reversals. Use the 70 and 30 lines to spot overbought/oversold conditions.
🔔 Alerts: Enable notifications for reversal conditions to capture trading opportunities without constant chart monitoring.
How It Works:
At the core of this indicator is the combination of the Relative Strength Index (RSI) and the Supertrend framework, it does so by applying the SuperTrend on the RSI. The RSI settings can be adjusted for length and smoothing, with the option to select the data source. The Supertrend calculation takes into account a specified trend factor and the Average True Range (ATR) over a given period to determine trend direction.
Visual elements include plotting the RSI, its moving average, and the Supertrend line, with customizable colors for clarity. Overbought and oversold conditions are highlighted, and trend changes are filled with distinct colors.
🔔 Alerts: Enable alerts for crossover and crossunder events to catch every trading opportunity.
🌈 Whether you're a seasoned trader or just starting, the Supertrended RSI offers a fresh perspective on market trends. 📈
💡 Tip: Experiment with different settings to find the perfect balance for your trading style!
🔗 Explore, customize, and enhance your trading experience with the Supertrended RSI Indicator! Happy trading! 🎉

ML - Momentum Index (Pivots)Building upon the innovative foundations laid by Zeiierman's Machine Learning Momentum Index (MLMI), this variation introduces a series of refinements and new features aimed at bolstering the model's predictive accuracy and responsiveness. Licensed under the Creative Commons Attribution-NonCommercial-ShareAlike 4.0 International License (CC BY-NC-SA 4.0), my adaptation seeks to enhance the original by offering a more nuanced approach to momentum-based trading.
Key Features :
Pivot-Based Analysis: Shifting focus from trend crosses to pivot points, this version employs pivot bars to offer a distinct perspective on market momentum, aiding in the identification of critical reversal points.
Extended Parameter Set: By integrating additional parameters for making predictions, the model gains improved adaptability, allowing for finer tuning to match market conditions.
Dataset Size Limitation: To ensure efficiency and mitigate the risk of calculation timeouts, a cap on the dataset size has been implemented, balancing between comprehensive historical analysis and computational agility.
Enhanced Price Source Flexibility: Users can select between closing prices or (suggested) OHLC4 as the basis for calculations, tailoring the indicator to different analysis preferences and strategies.
This adaptation not only inherits the robust framework of the original MLMI but also introduces innovations to enhance its utility in diverse trading scenarios. Whether you're looking to refine your short-term trading tactics or seeking stable indicators for long-term strategies, the ML - Momentum Index (Pivots) offers a versatile tool to navigate the complexities of the market.
For a deeper understanding of the modifications and to leverage the full potential of this indicator, users are encouraged to explore the tooltips and documentation provided within the script.
The Momentum Indicator calculations have been transitioned to the MLMomentumIndex library, simplifying the process of integration. Users can now seamlessly incorporate the momentumIndexPivots function into their scripts to conduct detailed momentum analysis with ease.

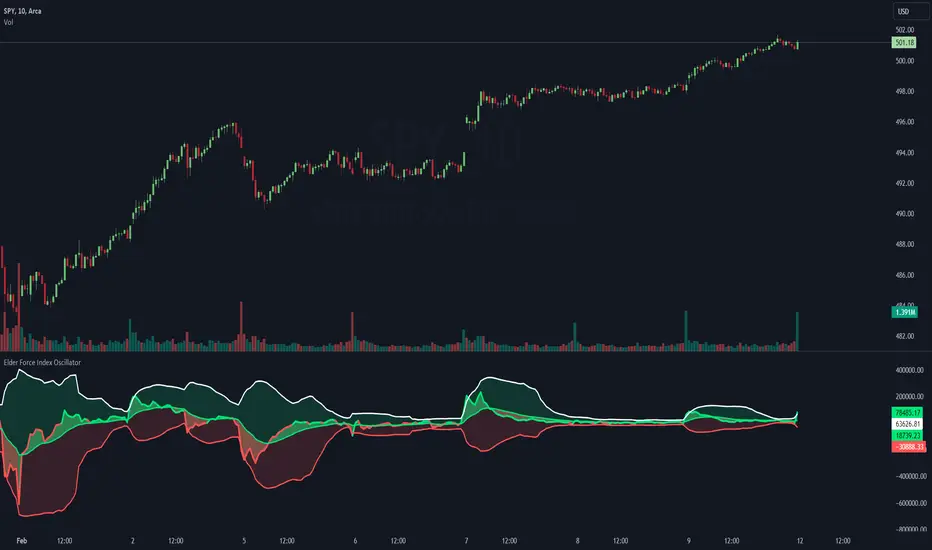
Elder Force Index Oscillator @shrilssThe "Elder Force Index Oscillator" is a comprehensive tool designed to assess the strength and direction of trends in the market. This indicator combines volume and price movement to provide traders with valuable insights into market dynamics.
Key Features:
- Volume Weighted: The oscillator considers both price changes and volume, emphasizing the significance of volume in confirming price movements.
- Trend Identification: Utilizing exponential moving averages (EMAs) and Bollinger Bands (BB), the indicator identifies potential trend reversals and continuations.
- Trend Strength Highlighting: With customizable options, the script highlights areas of strong and weak trend initiation, aiding traders in making informed decisions.
How It Works:
- Elder Force Index (EFI): The EFI is calculated as the EMA of price changes multiplied by volume. A positive value suggests buying pressure, while a negative value indicates selling pressure.
- EFI Moving Average (EFI MA): This smooths out the EFI, providing a clearer indication of trend direction.
- Bollinger Bands (BB): The upper and lower bands are calculated based on a specified number of standard deviations from the EFI's moving average, offering insights into potential overbought or oversold conditions.
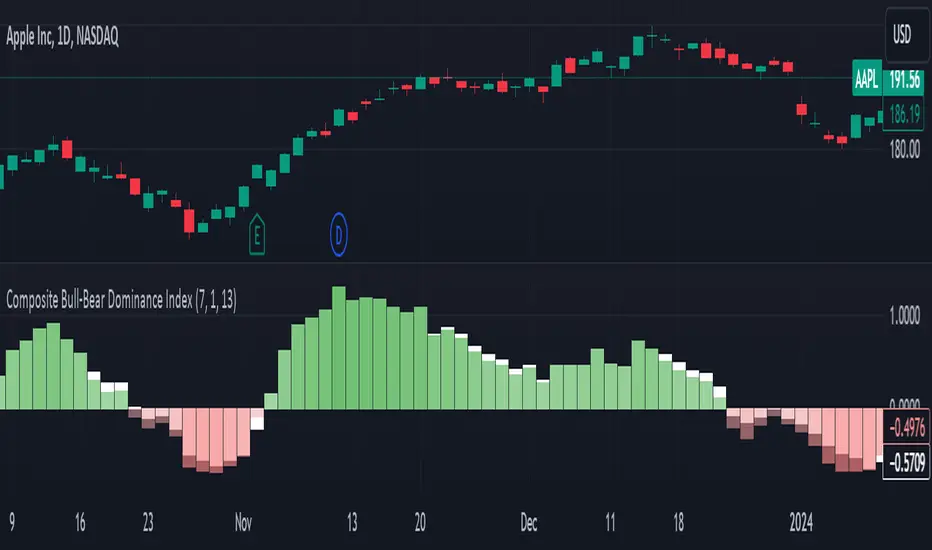
Composite Bull-Bear Dominance IndexNote: CREDITS: This is based on the Up Down Volume Indicator (published in Trading View) and Elder Ray Index (Bull Bear Power).
The Composite Bull Bear Dominance Index (CBBDI) is a indicator that combines up down volume analysis with Bull and Bear Power to provide a comprehensive view of market dynamics. It calculates Z-scores for up down volume delta and bull bear power measures, averages them, and then smoothes the result using Weighted Moving Average (WMA) for Bull and Bear Power and Volume Weighted Moving Average (VWMA) for Up and Down Volume Delta. The advantages include responsiveness to short-term trends, noise reduction through weighting, incorporation of volume information, and the ability to identify significant changes in buying and selling pressure. The indicator aims to offer clear signals for traders seeking insights into overall market dominance and indicate if the bulls or the bears have the upper hand.
Volume Analysis (Up/Down Volume Delta):
Up/Down Volume Delta reflects the net difference between buying and selling volume, providing insights into the prevailing market sentiment.
Positive Delta: Indicates potential bullish dominance due to higher buying volume.
Negative Delta: Suggests potential bearish dominance as selling volume surpasses buying volume.
Price Analysis (Bull and Bear Power):
Bull and Bear Power measure the strength of buying and selling forces based on price movements and the Exponential Moving Average (EMA) of the closing price.
Positive Bull Power: Reflects bullish dominance, indicating potential upward momentum.
Positive Bear Power: Suggests bearish dominance, indicating potential downward momentum.
Composite Bull Bear Dominance Index (CBBDI):
CBBDI combines the standardized Z-scores of Up/Down Volume Delta and Bull Bear Power, providing an average measure of both volume and price-related dominance.
Positive CBBDI: Indicates an overall bullish dominance in both volume and price dynamics.
Negative CBBDI: Suggests an overall bearish dominance in both volume and price dynamics.
Smoothing Techniques:
The use of Weighted Moving Average (WMA) for smoothing Bull and Bear Power Z-scores, and Volume Weighted Moving Average (VWMA) for smoothing Up/Down Volume Delta, reduces noise and provides a clearer trend signal.
Smoothing helps filter out short-term fluctuations and emphasizes more significant trends in both volume and price movements.
Color Coding:
CBBDI values are color-coded based on their direction, visually representing the prevailing market sentiment.
Green Colors: Positive values indicate potential bullish dominance.
Red Colors: Negative values suggest potential bearish dominance.
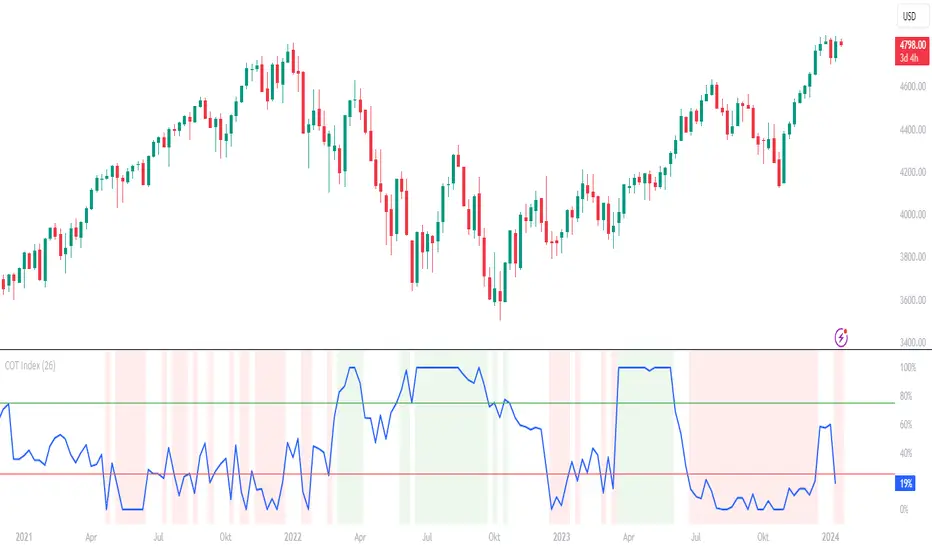
COT Index by NielsThe COT index is an indicator for determining trend reversals based on the net positions of commercials from the CFTC COT report.
A time frame of 26 weeks is selected as the basis. If the value is greater than or equal to 75, this is a bullish sign; if it is less than or equal to 25, this is a bearish sign.
You can select the number of weeks to be used for the calculation.
As the CFTC data is only published on Fridays at 21:30, the value of the current week is hidden until the market closes.
In addition, the background changes color when the index reaches an extreme range.
Both functions can be deactivated in the settings.
VIX Statistical Sentiment Index [Nasan]** THIS IS ONLY FOR US STOCK MARKET**
The indicator analyzes market sentiment by computing the Rate of Change (ROC) for the VIX and S&P 500, visualizing the data as histograms with conditional coloring. It measures the correlation between the VIX, the specific stock, and the S&P 500, displaying the results on the chart. The reliability measure combines these correlations, offering an overall assessment of data robustness. One can use this information to gauge the inverse relationship between VIX and S&P 500, the alignment of the specific stock with the market, and the overall reliability of the correlations for informed decision-making based on the inverse relationship of VIX and price movement.
**WHEN THE VIX ROC IS ABOVE ZERO (RED COLOR) AND RASING ONE CAN EXPECT THE PRICE TO MOVE DOWNWARDS, WHEN THE VIX ROC IS BELOW ZERO (GREEN)AND DECREASING ONE CAN EXPECT THE PRICE TO MOVE UPWARDS"
Understanding the VIX Concept:
The VIX, or Volatility Index, is a widely used indicator in finance that measures the market's expectation of volatility over the next 30 days. Here are key points about the VIX:
Fear Gauge:
Often referred to as the "fear gauge," the VIX tends to rise during periods of market uncertainty or fear and fall during calmer market conditions.
Inverse Relationship with Market:
The VIX typically has an inverse relationship with the stock market. When the stock market experiences a sell-off, the VIX tends to rise, indicating increased expected volatility.
Implied Volatility:
The VIX is derived from the prices of options on the S&P 500. It represents the market's expectations for future volatility and is often referred to as "implied volatility."
Contrarian Indicator:
Extremely high VIX levels may indicate oversold conditions, suggesting a potential market rebound. Conversely, very low VIX levels may signal complacency and a potential reversal.
VIX vs. SPX Correlation:
This correlation measures the strength and direction of the relationship between the VIX (Volatility Index) and the S&P 500 (SPX).
A negative correlation indicates an inverse relationship. When the VIX goes up, the SPX tends to go down, and vice versa.
The correlation value closer to -1 suggests a stronger inverse relationship between VIX and SPX.
Stock vs. SPX Correlation:
This correlation measures the strength and direction of the relationship between the closing price of the stock (retrieved using src1) and the S&P 500 (SPX).
This correlation helps assess how closely the stock's price movements align with the broader market represented by the S&P 500.
A positive correlation suggests that the stock tends to move in the same direction as the S&P 500, while a negative correlation indicates an opposite movement.
Reliability Measure:
Combines the squared values of the VIX vs. SPX and Stock vs. SPX correlations and takes the square root to create a reliability measure.
This measure provides an overall assessment of how reliable the correlation information is in guiding decision-making.
Interpretation:
A higher reliability measure implies that the correlations between VIX and SPX, as well as between the stock and SPX, are more robust and consistent.
One can use this reliability measure to gauge the confidence they can place in the correlations when making decisions about the specific stock based on VIX data and its correlation with the broader market.

BTC - Hotness Index### Script Description
#### BTC - Hotness Index
This Pine Script, version 4, aims to generate a "Hotness Index" for Bitcoin (BTC) trading by utilizing a Pi Cycle Top Indicator. The script operates in a daily (`1D`) time frame and involves calculating two Simple Moving Averages (SMA) based on `close` prices:
- 111-day SMA (`D_111SMA`)
- 350-day SMA (`D_350SMA`) multiplied by 2
The primary indicator (`pi_indicator`) is derived by dividing `D_111SMA` by `D_350SMA`.
##### Sell Signal
A sell signal is plotted as a histogram if `pi_indicator` crosses above 1 (`pi_plot` variable).
##### Buy Signal
A buy signal is plotted as a histogram if `pi_indicator` crosses below 0.35 (`pi_plot_buy` variable).
##### Horizontal Lines
Two horizontal lines are included to denote the "Buy Zone" and "Sell Zone":
- "Sell Zone" at `pi_indicator` level of 1
- "Buy Zone" at `pi_indicator` level of 0.35
##### Plotting
Histogram plots are used for visualizing the signals:
- Sell signals are colored red (`RGB: 255, 59, 59`)
- Buy signals are colored green (`RGB: 82, 255, 59`)
This script provides traders a visual guide for potential buy/sell opportunities based on the Pi Cycle Top Indicator and the Hotness Index for Bitcoin. It operates under the terms of the Mozilla Public License 2.0.

[blackcat] L2 Range Action Verification Index (RAVI) with 3 SMAThe Range Action Verification Index (RAVI) is a technical indicator used in trading to measure the strength of a trend. It compares two simple moving averages (SMAs) to determine the market's momentum.
To calculate RAVI, we subtract the shorter SMA from the longer SMA, and then divide the result by the longer SMA. This value is then multiplied by 100 to express it as a percentage.
The RAVI indicator helps traders identify whether the market is in a trending or range-bound phase. When the RAVI value is positive, it indicates a bullish trend, suggesting that the market is in an uptrend. Conversely, a negative RAVI value indicates a bearish trend or a downtrend.
Traders can use the RAVI indicator in several ways. Here are a few common strategies:
1. **Trend confirmation**: Traders can use RAVI to confirm the strength of a trend identified by other indicators or price patterns. If the RAVI value aligns with the direction of the trend, it provides additional confirmation.
2. **Overbought and oversold conditions**: Traders can use extreme RAVI values to identify overbought or oversold conditions in the market. When the RAVI value reaches high positive or negative levels, it suggests that the market may be due for a reversal or a retracement.
3. **Divergence**: Traders can look for divergences between the RAVI indicator and the price action. For example, if the price makes a higher high, but the RAVI value makes a lower high, it could indicate a weakening trend and a potential reversal.
As with any technical indicator, it is essential to use RAVI in conjunction with other tools and analysis techniques to make informed trading decisions. Traders should also consider factors such as market conditions, risk management, and other supporting indicators to validate their trading strategies.
In this indicator, an additional simple moving average (SMA) is introduced to consider long-term bias. This modification allows the Range Action Verification Index (RAVI) to be used as a volatility filter. By comparing the shorter SMA with this longer SMA, traders can gain insights into the market's volatility and adjust their trading strategies accordingly. This longer SMA helps provide a broader perspective on the market's trend and can be particularly useful for identifying and filtering out periods of high volatility. It is called "L2 Range Action Verification Index (RAVI) with 3 SMA". It calculates the RAVI value based on three simple moving averages (SMA). The code also includes calculations for the upper and lower bands, as well as color gradient settings. Finally, it plots the RAVI values and a midline.
It calculates the Range Action Verification Index (RAVI) using three Simple Moving Averages (SMA). The RAVI measures the difference between two SMAs divided by a third SMA, and then multiplied by 100.
The code starts with defining input parameters such as length, multiplier, and lengths for the three SMAs. Then it assigns the closing price to a variable called "price".
Next, it calculates the three SMAs using the "ta.sma" function from TradingView's built-in technical analysis library. The first SMA uses "sma1Length", the second SMA uses "sma2Length", and the third SMA uses "sma3Length".
After that, it calculates the RAVI by subtracting sma2 from sma1, dividing it by sma3, and multiplying it by 100.
Then it calculates additional values like basis (using another SMA), deviation (using standard deviation), upper band (basis + dev), and lower band (basis - dev).
Finally, it plots these values on a chart using different colors for each line. It also creates an array of gradient colors based on RSI values calculated from another indicator called ALMA. This gradient color is used to colorize the RAVI line.
Overall, this script helps visualize and analyze market trends based on moving averages and their relationship with price movements.

Intraday Intensity Index [SyntaxGeek]Intraday Intensity Index
This is a volume-based technical indicator that integrates volume with a security’s price. Use this to follow how intraday highs and lows are moving with volume.
The Intraday Intensity Index was developed by Dave Bostian.
It is one of several indicators that can be used to follow how volume is influencing a security’s price. It provides a continuous volume-focused indicator by using a security’s most recent close, high and low in its calculation while also factoring in volume.
I've searched high and low for the correct implementation of this measure and I can only find it buried within old books or in PineScript's own ta.iii, but no one has provided it as a histogram indicator correctly.
The main difference I can find is that most are not restricting volumes influence to the denominator solely, which is how Dave designed it.
For illustration the correct implementation is:
(2 * close - high - low) / ((high - low) * volume)
Such a simple change but compare to many other indicators that claim to implement the measure and it's easy to see the difference.
I also provided a high/low mode that aims to ease comparison to Bollinger Bands which is something that John Bollinger references when utilizing III.
Setting III to 20 trend and high/low mode can present similar areas of extreme breaks to the high or low and may be great entries for trades but you must complete your own analysis.

[blackcat] L2 Market Facilitation IndexThe Market Facilitation Index (MFI) is a technical indicator that measures the ease with which the market is able to move based on the volume traded. It was developed by Dr. Bill Williams as part of his trading system.
The MFI is calculated by taking into account the difference between the current typical price (average of high, low, and close) and the previous typical price, multiplied by the volume. This difference is then divided by the sum of volume over a specified period.
The MFI helps traders to identify periods of high or low market facilitation. High MFI values indicate that the market is facilitating trade and moving with ease, suggesting increased activity and potential trading opportunities. Conversely, low MFI values suggest a lack of market facilitation, indicating decreased activity and potential consolidation or sideways movement.
Traders can use the MFI in conjunction with other technical indicators and price analysis techniques to make informed trading decisions. It can be used to confirm trends, identify potential reversals, and assess the strength of market movements.
The Market Facilitation Index provides valuable insights into market dynamics, as it focuses on the relationship between price movement and trading volume. By incorporating volume data into its calculations, the MFI captures the impact of volume on market activity.
This indicator is particularly useful in identifying periods of market consolidation or range-bound trading. When the MFI shows low values, it suggests that market participants are hesitant and there may be a lack of clear trends. Traders can interpret this as a potential signal to avoid entering new positions or to tighten their stop-loss levels.
Conversely, when the MFI indicates high values, it signifies that the market is experiencing high levels of activity and price movement. This can be an indication of a strong trend, and traders may look for opportunities to enter positions in line with the prevailing market direction.
In addition to identifying market trends and potential reversals, the MFI can also help traders gauge the strength of price movements. By comparing the MFI values during different price swings or trends, traders can assess whether the market is experiencing increasing or decreasing levels of facilitation. This information can be valuable in determining the overall momentum and sustainability of a trend.
It's important to note that while the Market Facilitation Index can be a useful tool in technical analysis, it should not be used in isolation. Like any indicator, it has its limitations and may not always accurately reflect market conditions. Therefore, it is advisable to combine the MFI with other technical indicators, chart patterns, and fundamental analysis to gain a more comprehensive understanding of the market.
In conclusion, the Market Facilitation Index is a powerful technical indicator that measures the ease with which the market is able to move based on trading volume. It helps traders identify periods of high or low market facilitation, confirm trends, identify potential reversals, and assess the strength of market movements. However, it should be used in conjunction with other analysis methods for comprehensive market evaluation.

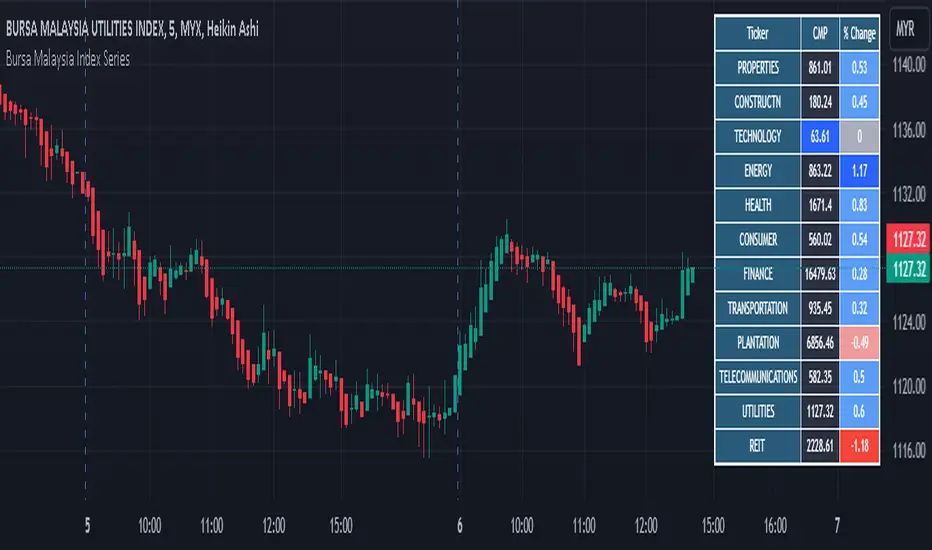
Bursa Malaysia Index SeriesBursa Malaysia Index Series. The index computation is as follows:-
Current aggregate Market Capitalisation/Base Aggregate Market Capitalisation x 100.
The Bursa Malaysia Index Series is calculated and disseminated on a real-time basis at 60-second intervals during Bursa’s trading hours.
[blackcat] L1 Variable Index Dynamic Average (VIDYA)Variable Index Dynamic Average (VIDYA) is a technical indicator that adjusts its sensitivity to market volatility. VIDYA is an exponential moving average (EMA) that uses the standard deviation of price as a measure of volatility. When the market is volatile, the indicator places more weight on recent prices, and when the market is stable, it places more weight on older prices. This makes VIDYA more responsive to market conditions than a regular EMA.
This script is a powerful tool that traders can use to gain valuable insights into market trends and make informed trading decisions. The L1 Variable Index Dynamic Average (VIDYA) is a technical indicator that adjusts its sensitivity to market volatility, making it more responsive to market conditions than a regular EMA. By incorporating the standard deviation of price as a measure of volatility, VIDYA can provide a more accurate representation of the market's current state, which can be especially useful in volatile markets.
One of the key features of this script is that it allows the user to customize the period and alpha inputs used in the VIDYA calculation. This means that traders can tailor the indicator to their specific trading strategies and preferences. By adjusting the period and alpha inputs, traders can fine-tune the sensitivity of the indicator to match the volatility of the market they're trading in.
In addition to plotting the VIDYA line on the chart, this script generates alerts and labels for buy and sell signals based on the crossover and crossunder of the VIDYA line. These alerts and labels can be incredibly helpful in identifying potential trading opportunities and avoiding costly mistakes. By being alerted to buy and sell signals in real-time, traders can take advantage of market movements and make trades quickly and confidently.
Another advantage of this script is that it is written in TradingView's Pine programming language, which is specifically designed for technical analysis and trading. Pine is a user-friendly language that allows traders to create custom indicators and strategies without having to learn a complex programming language. This means that even traders with little to no programming experience can use this script to gain valuable insights into the market.
Overall, this script is an excellent tool for traders who are looking for a powerful and customizable technical indicator that can help them make informed trading decisions. With its ability to adjust to market volatility, generate alerts and labels, and be customized to match individual trading strategies, the L1 Variable Index Dynamic Average (VIDYA) is a valuable addition to any trader's toolkit.

Price Strength Index + RSI Buy/Sell ZonesThe Price Strength Index + RSI Buy/Sell Zones indicator is a technical analysis tool designed to evaluate the strength of a financial asset's price movement by comparing it with a series of Volume Weighted Moving Averages (VWMAs) of different lengths calculated from historical data.
Hypothesis :
The core hypothesis behind this indicator is that assessing the relationship between the current price and a range of VWMAs with varying lengths can provide valuable insights into the strength and direction of a price trend. Additionally, it incorporates Relative Strength Index (RSI) conditions to further refine potential buy and sell signals.
How It Works :
Multiple VWMA Calculation: The indicator calculates multiple VWMAs, each with a different length, using historical price data and volume. These VWMAs represent weighted moving averages over various periods, helping to capture different aspects of the price trend.
Comparison with Current Price : For each of these VWMAs, the indicator compares the current bar's price with the VWMA value. This comparison is crucial in understanding how the current price relates to historical averages, shedding light on the strength and direction of the prevailing trend.
SMA of Percentage Above VWMA : The indicator calculates the Simple Moving Average (SMA) of the percentage of prices above the various VWMAs over a specified period. This moving average smoothens out the percentage data, providing a clearer trend signal.
Buy and Sell Zones : User-defined upper and lower thresholds for the percentage of prices above the VWMAs are used to define buy and sell zones. When the percentage falls below the lower threshold, it signals a potential buy zone, suggesting a weakening trend. Conversely, when it exceeds the upper threshold, it signifies a potential sell zone, indicating a strengthening trend.
RSI Integration : The RSI is calculated for the selected price source with a specified length. When the SMA of the percentage above VWMAs falls within the buy zone and the RSI is below the lower RSI threshold, it indicates an oversold condition, potentially signaling a buy opportunity. Conversely, when the SMA falls within the sell zone and the RSI is above the upper RSI threshold, it suggests an overbought condition, possibly signaling a sell opportunity.
Color Coding : The indicator employs color-coding to visually represent the buy and sell zones, as well as extreme RSI conditions. Green color denotes the buy zone, red represents the sell zone, and orange lines indicate the median and potential reversal points.
In summary, the Price Strength Index + RSI Buy/Sell Zones indicator leverages multiple VWMAs of different lengths to assess the relationship between current prices and historical moving averages. This comprehensive analysis, coupled with RSI conditions, aids traders in identifying potential buy and sell zones, as well as extreme RSI points within those zones, enhancing the evaluation of price strength and potential trend reversals.

L&S Volatility Index Refurbished█ Introduction
This is my second version of the L&S Volatility Index, hence the name "Refurbished".
The first version can be found at this link:
The reason I released a separate version is because I rewrote the source code from scratch with the aim of both improving the indicator and staying as close as possible to the original concept.
I feel that the first version was somewhat exotic and polluted in relation to the indicator originally described by the authors.
In short, the main idea remains the same, however, the way of presenting the result has been changed, reiterating what was said.
█ CONCEPTS
The L&S Volatility Index measures the volatility of price in relation to a moving average.
The indicator was originally described by Brazilian traders Alexandre Wolwacz (Stormer) and Fábio Figueiredo (Vlad) from L&S Educação Financeira.
Basically, this indicator can be used in two ways:
1. In a mean reversion strategy, when there is an unusual distance from it;
2. In a trend following strategy, when the price is in an acceptable region.
As an indicator of volatility, the greatest utility is shown in first case.
This is because it allows identifying abnormal prices, extremely stretched in relation to an average, including market crashes.
How the calculation is done:
First, the distance of the price from a given average in percentage terms is measured.
Then, the historical average volatility is obtained.
Finally the indicator is calculated through the ratio between the distance and the historical volatility.
According to the description proposed by the creators, when the L&S Volatility Index is above 30 it means that the price is "stretched".
The closer to 100 the more stretched.
When it reaches 0, it means the price is on average.
█ What to look for
Basically, you should look at non-standard prices.
How to identify it?
When the oscillator is outside the Dynamic Zone and/or the Fixed Zone (above 30), it is because the price is stretched.
Nothing on the market is guaranteed.
As with the RSI, it is not because the RSI is overbought or oversold that the price will necessarily go down or up.
It is critical to know when NOT to buy, NOT to sell or NOT to do anything.
It is always important to consider the context.
█ Improvements
The following improvements have been implemented.
It should be noted that these improvements can be disabled, thus using the indicator in the "purest" version, the same as the one conceived by the creators.
Resources:
1. Customization of limits and zones:
2. Customization of the timeframe, which can be different from the current one.
3. Repaint option (prints the indicator in real time even if the bar has not yet closed. This produces more signals).
4. Customization of price inputs. This affects the calculation.
5. Customization of the reference moving average (the moving average used to calculate the price distance).
6. Customization of the historical volatility calculation strategy.
- Accumulated ATR: calculates the historical volatility based on the accumulated ATR.
- Returns: calculates the historical volatility based on the returns of the source.
Both forms of volatility calculation have their specific utilities and applications.
Therefore, it is worthwhile to have both approaches available, and one should not necessarily replace the other.
Each method has its advantages and may be more appropriate in different contexts.
The first approach, using the accumulated ATR, can be useful when you want to take into account the implied volatility of prices over time,
reflecting broader price movements and higher impact events. It can be especially relevant in scenarios where unexpected events can drastically affect prices.
The second approach, using the standard deviation of returns, is more common and traditionally used to measure historical volatility.
It considers the variability of prices relative to their average, providing a more general measure of market volatility.
Therefore, both forms of calculation have their merits and can be useful depending on the context and specific analysis needs.
Having both options available gives users flexibility in choosing the most appropriate volatility measure for the situation at hand.
* When choosing "Accumulated ATR", if the indicator becomes difficult to see, there are 3 possibilities:
a) manually adjust the Fixed Zone value;
b) disable the Fixed Zone and use only the Dynamic Zone;
c) normalize the indicator.
7. Signal line (a moving average of the oscillator).
8. Option to normalize the indicator or not.
9. Colors to facilitate direction interpretation.
Since the L&S is a volatility indicator, it does not show whether the price is rising or falling.
This can sometimes confuse the user.
That said, the idea here is to show certain colors where the price is relative to the average, making it easier to analyze.
10. Alert messages for automations.

Machine Learning Momentum Index (MLMI) [Zeiierman]█ Overview
The Machine Learning Momentum Index (MLMI) represents the next step in oscillator trading. By blending traditional momentum analysis with machine learning, MLMI delivers a potent and dynamic tool that aligns with the complexities of modern financial landscapes. Offering traders an adaptive way to understand and act on market momentum and trends, this oscillator provides real-time insights into market momentum and prevailing trends.
█ How It Works:
Momentum Analysis: MLMI employs a dual-layer analysis, utilizing quick and slow weighted moving averages (WMA) of the Relative Strength Index (RSI) to gauge the market's momentum and direction.
Machine Learning Integration: Through the k-Nearest Neighbors (k-NN) algorithm, MLMI intelligently examines historical data to make more accurate momentum predictions, adapting to the intricate patterns of the market.
MLMI's precise calculation involves:
Weighted Moving Averages: Calculations of quick (5-period) and slow (20-period) WMAs of the RSI to track short-term and long-term momentum.
k-Nearest Neighbors Algorithm: Distances between current parameters and previous data are measured, and the nearest neighbors are used for predictive modeling.
Trend Analysis: Recognition of prevailing trends through the relationship between quick and slow-moving averages.
█ How to use
The Machine Learning Momentum Index (MLMI) can be utilized in much the same way as traditional trend and momentum oscillators, providing key insights into market direction and strength. What sets MLMI apart is its integration of artificial intelligence, allowing it to adapt dynamically to market changes and offer a more nuanced and responsive analysis.
Identifying Trend Direction and Strength: The MLMI serves as a tool to recognize market trends, signaling whether the momentum is upward or downward. It also provides insights into the intensity of the momentum, helping traders understand both the direction and strength of prevailing market trends.
Identifying Consolidation Areas: When the MLMI Prediction line and the WMA of the MLMI Prediction line become flat/oscillate around the mid-level, it's a strong sign that the market is in a consolidation phase. This insight from the MLMI allows traders to recognize periods of market indecision.
Recognizing Overbought or Oversold Conditions: By identifying levels where the market may be overbought or oversold, MLMI offers insights into potential price corrections or reversals.
█ Settings
Prediction Data (k)
This parameter controls the number of neighbors to consider while making a prediction using the k-Nearest Neighbors (k-NN) algorithm. By modifying the value of k, you can change how sensitive the prediction is to local fluctuations in the data.
A smaller value of k will make the prediction more sensitive to local variations and can lead to a more erratic prediction line.
A larger value of k will consider more neighbors, thus making the prediction more stable but potentially less responsive to sudden changes.
Trend length
This parameter controls the length of the trend used in computing the momentum. This length refers to the number of periods over which the momentum is calculated, affecting how quickly the indicator reacts to changes in the underlying price movements.
A shorter trend length (smaller momentumWindow) will make the indicator more responsive to short-term price changes, potentially generating more signals but at the risk of more false alarms.
A longer trend length (larger momentumWindow) will make the indicator smoother and less responsive to short-term noise, but it may lag in reacting to significant price changes.
Please note that the Machine Learning Momentum Index (MLMI) might not be effective on higher timeframes, such as daily or above. This limitation arises because there may not be enough data at these timeframes to provide accurate momentum and trend analysis. To overcome this challenge and make the most of what MLMI has to offer, it's recommended to use the indicator on lower timeframes.
-----------------
Disclaimer
The information contained in my Scripts/Indicators/Ideas/Algos/Systems does not constitute financial advice or a solicitation to buy or sell any securities of any type. I will not accept liability for any loss or damage, including without limitation any loss of profit, which may arise directly or indirectly from the use of or reliance on such information.
All investments involve risk, and the past performance of a security, industry, sector, market, financial product, trading strategy, backtest, or individual's trading does not guarantee future results or returns. Investors are fully responsible for any investment decisions they make. Such decisions should be based solely on an evaluation of their financial circumstances, investment objectives, risk tolerance, and liquidity needs.
My Scripts/Indicators/Ideas/Algos/Systems are only for educational purposes!
