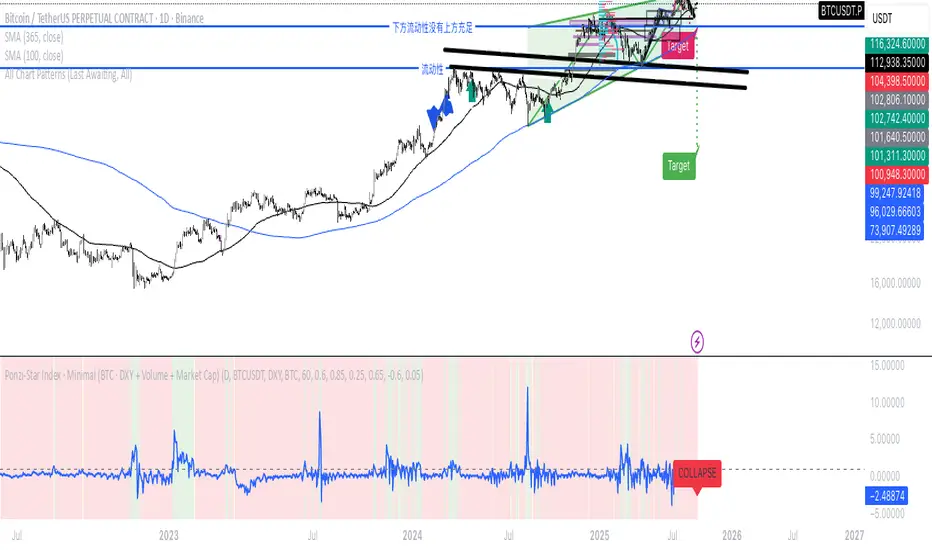
Ponzi-Star Index · Minimal (BTC · DXY + Volume + Market Cap)If we think of the U.S. Dollar Index as the speed of light,
market cap as the mass of a star,
and trading volume as the energy of cataclysmic change—
then can we imagine the market as a star:
entering during its expansion phase,
and exiting before its collapse?
Cari dalam skrip untuk "index"
Commodity Channel Index DualThe CCI Dual is a custom TradingView indicator built in Pine Script v5, designed to help traders identify potential buy and sell signals using two Commodity Channel Index (CCI) oscillators. It combines a shorter-period CCI (default: 14) for quick momentum detection with a longer-period CCI (default: 50) for confirmation, focusing on mean-reversion opportunities in overbought or oversold conditions.
This setup is particularly suited for volatile markets like cryptocurrencies on higher timeframes (e.g., 3-day charts), where it highlights reversals by requiring both CCIs to cross out of extreme zones within a short window (default: 3 bars).
The indicator plots the CCIs, customizable bands (inner: 100, OB/OS: 175, outer: 200), dynamic fills for visual emphasis, background highlights for signals, and alert conditions for notifications.
How It Works
The indicator calculates two CCIs based on user-defined lengths and source (default: close price):
CCI Calculation: CCI measures price deviation from its average, using the formula: CCI = (Typical Price - Simple Moving Average) / (0.015 * Mean Deviation). The short CCI reacts faster to price changes, while the long CCI provides smoother, trend-aware confirmation.
Overbought/Oversold Levels: Customizable thresholds define extremes (Overbought at +175, Oversold at -175 by default). Bands are plotted at inner (±100), mid (±175 dashed), and outer (±200) levels, with gray fills for the outer zones.
Dynamic Fills: The longer CCI is used to shade areas beyond OB/OS levels in red (overbought) or green (oversold) for quick visual cues.
Signals:
Buy Signal: Triggers when both CCIs cross above the Oversold level (-175) within the signal window (3 bars). This suggests a potential upward reversal from an oversold state.
Sell Signal: Triggers when both cross below the Overbought level (+175) within the window, indicating a possible downward reversal.
Visuals and Alerts: Buy signals highlight the background green, sells red. Separate alertconditions allow setting TradingView alerts for buys or sells independently.
Customization: Adjust lengths, levels, and window via inputs to fit your timeframe or asset—e.g., higher OB/OS for crypto volatility.
This logic reduces noise by requiring dual confirmation, but like all oscillators, it can produce false signals in strong trends where prices stay extended.
To mitigate false signals (e.g., in trending markets), layer the CCI Dual with MACD (default: 12,26,9) and RSI (default: 14) for multi-indicator confirmation:
With MACD: Only take CCI buys if the MACD line is above the signal line (or histogram positive), confirming bullish momentum. For sells, require MACD bearish crossover. This filters counter-trend signals by aligning with trend strength—e.g., ignore CCI sells if MACD shows upward momentum.
With RSI: Confirm CCI oversold buys only if RSI is below 30 and rising (or shows bullish divergence). For overbought sells, RSI above 70 and falling. This adds overextension validation, reducing whipsaws in crypto trends.
I made this customizable for you to find what works best for your asset you are trading. I trade the 6 hour and 3 day timeframe mainly on major cryptocurrency pairs. I hope you enjoy this script and it serves you well.

Queso Heat IndexQueso Heat Index (QHI) — ATR-Adaptive Edge-Pressure Gauge
QHI measures how strongly price is pressing the edges of a rolling consolidation window. It heats up when price repeatedly pushes the window up , cools down when it pushes down , and drifts back toward neutral when price wanders in the middle. Everything is ATR-normalized so it adapts across symbols and timeframes.
Output: a signed score from −100 … +100
> 0 = bullish pressure (hot)
< 0 = bearish pressure (cold)
≈ 0 = neutral (no side dominating)
What you’ll see on the chart
Rolling “box” (Donchian window): top, bottom, and midline.
Optional compact-box shading when the window height is small relative to ATR.
Background “thermals”: tinted red when Heat > Hot threshold, blue when Heat < Cold threshold (intensity scales with the score).
Optional Heat line (−100..+100), optional 0/±80 thresholds, and optional push markers (PU/PD).
Optional table showing the current Heat score, placeable in any corner.
How it works (under the hood)
Consolidation window — Over lookback bars we track highest high (top), lowest low (bottom), and midpoint. The window is called “compact” when box height ≤ ATR × maxRangeATR .
ATR-based push detection — A bar is a push-up if high > prior window high + (epsATR × ATR + tick buffer) . A push-down if low < prior window low − (epsATR × ATR + tick buffer) . We also measure how many ATRs beyond the edge the bar traveled.
Heat gains (symmetric) — Each push adds/subtracts Heat:
base gain + streak bonus × consecutive pushes + magnitude bonus × ATRs beyond edge .
Decay toward neutral — Each bar, Heat decays by a percentage. Decay is:
– higher in the middle band of the box, and
– adaptive : the farther (in ATRs) from the relevant band (top when hot, bottom when cold), the faster it decays; hugging the band slows decay.
Midpoint bias (optional) — Gentle drift toward hot when trading above mid, toward cold when below mid, with a dead-zone near mid so tiny wobbles don’t matter.
Reset on regime flip (optional) — First valid push from the opposite side can snap Heat back to 0 before applying new gains.
How to read it
Rising hot with slow decay → strong upside pressure; pullbacks that hold near the top band often continue.
Flip to cold after being hot → regime change risk; tighten risk or consider the other side.
Compact window + rising hot (or cold) → squeeze-and-go conditions.
Neutral (≈ 0) → edges aren’t being pressured; expect mean-reversion inside the box.
Key inputs (what they do)
Window & ATR
lookback : size of the Donchian window (longer = smoother, slower).
atrLen : ATR period for all volatility-scaled thresholds.
maxRangeATR : defines “compact” windows for optional shading.
topBottomFrac : how thick the top/bottom bands are (used for decay/pressure logic).
Push detection (ATR-based)
epsATR : how many ATRs beyond the prior edge to count as a real push.
tickBuff : fixed extra ticks beyond the ATR epsilon (filters micro-breaches).
Heat gains
gainBase : main fuel per push.
gainPerStreak : rewards consecutive pushes.
gainPer1ATRBrk : adds more for stronger breakouts past the edge.
resetOppSide : snap back to 0 on the first opposite-side push.
Decay
decayPct : baseline % removed each bar.
decayAccelMid : multiplies decay when price is in the middle band.
adaptiveDecay , decayMinMult , decayPerATR , decayMaxMult : scale decay with ATR distance from the nearest “target” band (top if hot, bottom if cold).
Midpoint bias
useMidBias : enable/disable drift above/below midpoint.
midDeadFrac : width of neutral (no-drift) zone around mid.
midBiasPerBar : max drift per bar at the box edge.
Visuals (all default to OFF for a clean chart)
Plot Heat line + Show 0/±80 lines (only shows thresholds if Heat line is on).
Hot/Cold thresholds & transparency floors for background shading.
Push markers (PU/PD).
Heat score table : toggle on; choose any corner.
Tuning quick-starts
Daily trending equities : lookback 40–60; epsATR 0.10–0.25; gainBase 12–18; gainPerStreak 0.5–1.5; gainPer1ATRBrk 1–2; decayPct 3–6; adaptiveDecay ON (decayPerATR 0.5–0.8).
Intraday / noisy : raise epsATR and tickBuff to filter noise; keep decayPct modest so Heat can build.
Weekly swing : longer lookback/atrLen; slightly lower decayPct so regimes persist.
Alerts (included)
New window HIGH (push-up)
New window LOW (push-down)
Heat turned HOT (crosses above your Hot threshold)
Heat turned COLD (crosses below your Cold threshold)
Best practices & notes
Use QHI as a pressure gauge , not a standalone system—combine with your entry/exit plan and risk rules.
On thin symbols, increase epsATR and/or tickBuff to avoid spurious pushes.
Gap days can register large pushes; ATR scaling helps but consider context.
Want the Heat in a separate pane? Use the companion panel version; keep this overlay for background/box visuals.
Pine v6. Warm-up: values appear as soon as one bar of window history exists.
TL;DR
QHI quantifies how hard price is leaning on a consolidation edge.
It’s ATR-adaptive, streak- and magnitude-aware, and cools off intelligently when momentum fades.
Watch for thermals (background), the score (−100..+100), and fresh push alerts to time entries in the direction of pressure.

Crypto Weighted 60 Day Return Index60 Day Return of Crypto Index (Volatility Adjusted) weightings based on Holdings
BTC
ETH
SOL
AAVE
XRP
US Index First 30m Candle Strategy (10m Chart)Strategy Description for Publishing
Title: US Index First 30-Minute Candle Strategy (10m Chart)
Overview:
This Pine Script implements a trading strategy designed to capitalize on price movements within the first 30 minutes of the U.S. stock market opening. It is specifically tailored for use on a 15-minute chart and is optimized for trading U.S. indices during regular market hours.
Features:
Session Time Configuration: The strategy operates within the U.S. market hours, specifically from 9:30 AM to 4:00 PM (Eastern Time).
First 30-Minute Candle Aggregation: The script identifies the high and low of the first 30-minute candle, which is considered a critical time frame for market momentum.
Single Trade Per Day: To minimize risk, the strategy is designed to execute only one trade per day based on the established range of the first 30 minutes.
Dynamic Trade Conditions: Buy and sell signals are generated when the price breaks above the high or below the low of the first 30-minute candle, with defined stop-loss and take-profit levels based on a customizable risk-reward ratio.
How It Works:
Initialization:
At the start of each trading day, the script resets the high and low values for the first 30 minutes.
Range Locking: After the first 30 minutes, the high and low values are locked, allowing for trade entries based on these levels.
Trade Execution:
Long Entry: Triggered when the price moves above the locked high.
Short Entry: Triggered when the price drops below the locked low.
Risk Management: Each trade comes with a stop-loss and take-profit mechanism to manage potential losses and secure profits.
Visuals:
The script also plots the locked high and low levels on the chart, providing a visual reference for traders.
Conclusion:
This strategy leverages the volatility often seen in the first 30 minutes of trading, aiming to capture significant price movements while maintaining a disciplined trading approach. It is suitable for traders looking to implement a systematic strategy based on early market behavior.
Usage:
To use this strategy, simply add the script to your TradingView chart, set your desired parameters, and monitor for trade signals during the specified market hours. Adjust the risk-reward ratio as needed to align with your trading style.

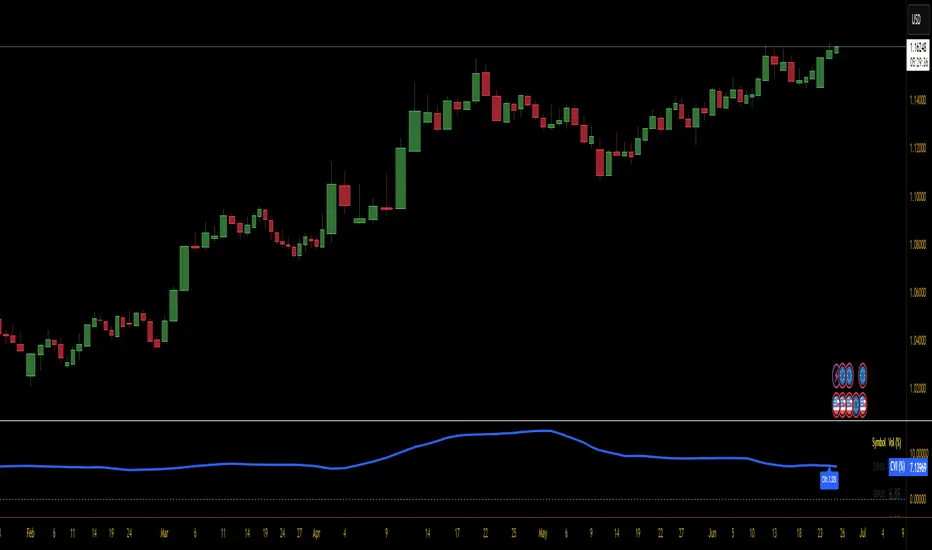
Currency Volatility Index (CVI)This Currency Volatility Index (CVI) indicator aggregates the realized volatility of the eight “major” FX pairs into a single, tradable series—much like an FX-version of the VIX. Here’s what it does step by step:
Inputs & Settings
• Volatility Length (default 20 days): the lookback over which daily log-returns’ standard deviation is computed.
• Data Timeframe (default Daily): the resolution at which price data is fetched for each pair.
• Smoothing Length (default 5): the period of a simple moving average applied to the raw, averaged volatility (in %).
Pair-by-Pair Volatility Calculation
For each hard-coded symbol (EURUSD, GBPUSD, USDJPY, USDCHF, AUDUSD, USDCAD, NZDUSD, EURGBP):
Pull the series of daily closes.
Compute the series of log-returns: ln(today’s close / yesterday’s close).
Calculate the standard deviation of those log-returns over your lookback.
Annualize it (×√252) to convert daily volatility into an annualized figure.
Aggregation
The eight annualized volatilities are averaged (equal weights).
The resulting number is then multiplied by 100 to express it as a percentage.
Smoothing & Plotting
A simple moving average over the aggregated volatility smooths out spikes.
The smoothed CVI (%) is plotted as a standalone line below price charts.
Visualization Aids
A small table in the top-right corner shows each pair’s current volatility in percent.
A dynamic label on the final bar prints the latest CVI value directly on the chart.
Why use it?
Gives a one-stop measure of overall FX market turbulence.
Helps you compare “quiet” vs. “volatile” regimes across currencies.
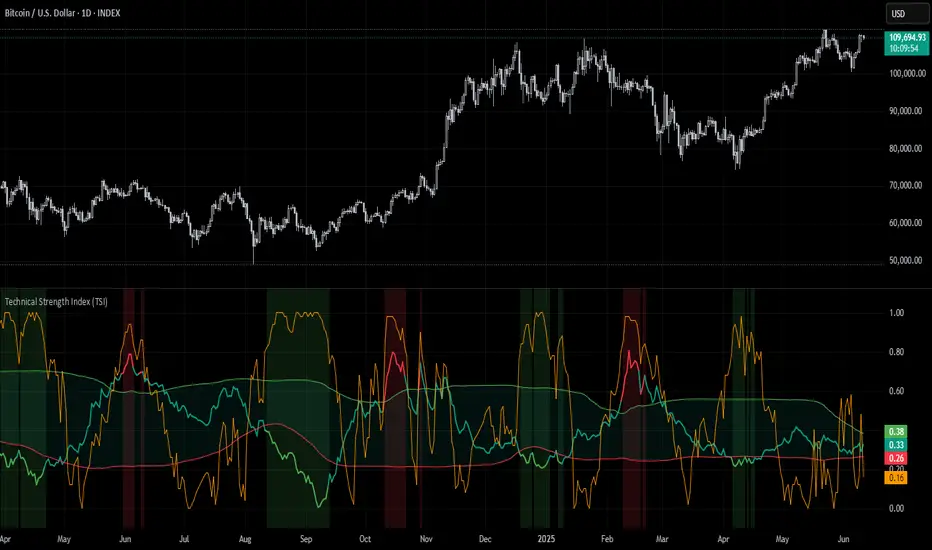
Technical Strength Index (TSI)📘 TSI with Dynamic Bands – Technical Strength Index
The TSI with Dynamic Bands is a multi-factor indicator designed to measure the statistical strength and structure of a trend. It combines several quantitative metrics into a single, normalized score between 0 and 1, allowing traders to assess the technical quality of market moves and detect overbought/oversold conditions with adaptive precision.
🧠 Core Components
This indicator draws from the StatMetrics library, blending:
📈 Trend Persistence: via the Hurst exponent, indicating whether price action is mean-reverting or trending.
📉 Risk-Adjusted Volatility: via the inverted , rewarding smoother, less erratic price movement.
🚀 Momentum Strength: using a combination of directional momentum and Z-score–normalized returns.
These components are normalized and averaged into the TSI line.
🎯 Features
TSI Line: Composite score of trend quality (0 = weak/noise, 1 = strong/structured).
Dynamic Bands: Mean ± 1 standard deviation envelopes provide adaptive context.
Overbought/Oversold Detection: Based on a rolling quantile (e.g. 90th/10th percentile of TSI history).
Signal Strength Bar (optional): Measures how statistically extreme the current TSI value is, helping validate confidence in trade setups.
Dynamic Color Cues: Background and bar gradients help visually identify statistically significant zones.
📈 How to Use
Look for overbought (red background) or oversold (green background) conditions as potential reversal zones.
Confirm trend strength with the optional signal strength bar — stronger values suggest higher signal confidence.
Use the TSI line and context bands to filter out noisy ranges and focus on structured price moves.
⚙️ Inputs
Lookback Period: Controls the smoothing and window size for statistical calculations.
Overbought/Oversold Quantiles: Adjust the thresholds for signal zones.
Plot Signal Strength: Enable or disable the signal confidence bar.
Overlay Signal Strength: Show signal strength in the same panel (compact) or not (cleaner TSI-only view).
🛠 Example Use Cases
Mean reversion traders identifying reversal zones with statistical backing
Momentum/Trend traders confirming structure before entries
Quantitative dashboards or multi-asset screening tools
⚠️ Disclaimer
This script is for educational and informational purposes only. It does not constitute financial advice or a recommendation to buy or sell any financial instrument.
This AI is not a financial advisor; please consult your financial advisor for personalized advice.
Symbol vs Benchmark Performance & Volatility TableThis tool puts the current symbol’s performance and volatility side-by-side with any benchmark —NASDAQ, S&P 500, NIFTY or a custom index of your choice.
A quick glance shows whether the stock is outperforming, lagging, or just moving with the market.
⸻
Features
• ✅ Returns over 1W, 1M, 3M, 6M, 12M
• 🔄 Benchmark comparison with optional difference row
• ⚡ Volatility snapshot (20D, 60D, or 252D)
• 🎛️ Fully customizable:
• Show/hide rows and timeframes
• Switch between default or custom benchmarks
• Pick position, size, and colors
Built to answer a simple, everyday question — “How’s this really doing compared to the broader market?”
Thanks to @BeeHolder, whose performance table originally inspired this.
Hope it makes your analysis a little easier and quicker.

Swing-Based Volatility IndexSwing-Based Volatility Index
This indicator helps traders quickly determine whether the market has moved enough over the past few hours to justify scalping.
It measures the percentage price swing (high to low) over a configurable time window (e.g., last 4–8 hours) and compares it to a minimum threshold (e.g., 1%).
✅ If the percent move exceeds the threshold → Market is volatile enough to scalp (green background).
🚫 If it's below the threshold → Market is too quiet (red background).
Features:
Adjustable lookback period in hours
Custom threshold for volatility sensitivity
Automatically adapts to the current chart timeframe
This tool is ideal for scalpers and short-term traders who want to avoid entering trades in low-volatility environments.

Volumetric Entropy IndexVolumetric Entropy Index (VEI)
A volume-based drift analyzer that captures directional pressure, trend agreement, and entropy structure using smoothed volume flows.
---
🧠 What It Does:
• Volume Drift EMAs : Shows buy/sell pressure momentum with adaptive smoothing.
• Dynamic Bands : Bollinger-style volatility wrappers react to expanding/contracting drift.
• Baseline Envelope : Clean structural white rails for mean-reversion zones or trend momentum.
• Background Shading : Highlights when both sides (up & down drift) are in agreement — green for bullish, red for bearish.
• Alerts Included : Drift alignment, crossover events, net drift shifts, and strength spikes.
---
🔍 What Makes It Different:
• Most volume indicators rely on bars, oscillators, or OBV-style accumulation — this doesn’t.
• It compares directional EMAs of raw volume to isolate real-time bias and acceleration.
• It visualizes the twisting tension between volume forces — not just price reaction.
• Designed to show when volatility is building inside the volume mechanics before price follows.
• Modular — every element is optional, so you can run it lean or fully loaded.
---
📊 How to Use It:
• Drift EMAs : Watch for one side consistently dominating — sharp spikes often precede breakouts.
• Bands : When they tighten and start expanding, it often signals directional momentum forming.
• Envelope Lines : Use as high-probability reversal or continuation zones. Bands crossing envelopes = potential thrust.
• Background Color : Green/red backgrounds confirm volume agreement. Can be used as a filter for other signals.
• Net Drift : Optional smoothed oscillator showing the difference between bullish and bearish volume pressure. Crosses above or below zero signal directional bias shifts.
• Drift Strength : Measures pressure buildup — spikes often correlate with large moves.
---
⚙️ Full Customization:
• Turn every layer on/off independently
• Modify all colors, transparencies, and line widths
• Adjust band width multiplier and envelope offset (%)
• Toggle bonus plots like drift strength and net baseline
---
🧪 Experimental Tools:
• Smoothed Net Drift trace
• Drift Strength signal
• Envelope lines and dynamic entropy bands with adjustable math
---
Built for signal refinement. Made to expose directional imbalance before the herd sees it.
Created by @Sherlock_Macgyver

True Strength Index (TSI)%📌 Script Name: TSI Percentuale
This script is a custom True Strength Index (TSI) indicator that expresses momentum strength as a percentage from 0% to 100%, instead of the traditional TSI scale.
✅ What the Script Does
Calculates the standard TSI:
Uses double exponential smoothing of price changes and their absolute values.
Formula:
TSI_raw
=
100
×
DoubleSmoothed(ΔPrice)
DoubleSmoothed(|ΔPrice|)
TSI_raw=100×
DoubleSmoothed(|ΔPrice|)
DoubleSmoothed(ΔPrice)
Normalizes TSI to a percentile scale:
Over a user-defined lookback period, the script finds the lowest and highest TSI values.
It then rescales the current TSI to a value between 0% (minimum) and 100% (maximum).
50% represents neutral momentum (i.e., "flat").
Plots the result:
tsi_percent is plotted as a blue line.
Horizontal dashed/dotted lines are drawn at:
0% → strong downward momentum
50% → neutral
100% → strong upward momentum
⚙️ Inputs
Long Length: Long EMA smoothing period (default: 25)
Short Length: Short EMA smoothing period (default: 13)
Signal Length: (not used in this version, can be removed or extended)
Lookback Period: Number of bars to calculate min/max normalization (default: 100)
🧠 Why Use This Indicator
The classic TSI ranges around and can be hard to interpret.
This version makes TSI visually intuitive by converting it to percentile form, allowing easier comparison of momentum strength across time and instruments.
It’s particularly useful for defining zones like:
Above 70% = strong bullish
Below 30% = strong bearish

Price Change Sentiment Index [tradeviZion]Price Change Sentiment Index
A technical indicator that measures price changes relative to the day's range.
Indicator Overview
Normalizes price changes on a 0-100 scale
Uses a smoothing period for signal clarity
Shows potential overbought/oversold conditions
Inputs
Smoothing Period (default: 3)
Show Background Colors (on/off)
Overbought Level (default: 75)
Oversold Level (default: 25)
Reading the Indicator
Values above 75: Price change showing strong upward movement
Values below 25: Price change showing strong downward movement
Around 50: Neutral price movement
Technical Details
// Core calculation
changePct = (currClose - prevClose) / (high - low)
normalized = 50 + (changePct * 50)
smoothedNormalized = ta.sma(normalizedClamped, smoothingPeriod)
Usage Notes
Best used with other technical analysis tools
Adjustable smoothing period affects signal sensitivity
Background colors highlight extreme readings
Works on any timeframe
Settings Guide
Smoothing Period:
- Lower values (1-3): More responsive
- Higher values (5-10): Smoother output
Visual Settings: Toggle background colors
Levels: Adjust overbought/oversold thresholds
This indicator is a technical analysis tool. Please conduct your own research and testing before use.

Kalman Filtered RSI | [DeV]The Kalman Filtered RSI indicator is an advanced tool designed for traders who want precise, noise-free market insights. By enhancing the classic Relative Strength Index (RSI) with a Kalman filter, this indicator delivers a smoother, more reliable view of market momentum, helping you identify trends, reversals, and overbought/oversold conditions with greater accuracy. It’s an ideal choice for traders seeking clear signals amidst market volatility, giving you a competitive edge across any trading environment.
The RSI measures momentum by analyzing price movements over a set period, typically 14 bars. It calculates the average of price gains on up days and the average of price losses on down days, then compares these to produce a value between 0 and 100. An RSI above 70 often indicates an overbought market that may reverse downward, while below 30 suggests an oversold market that could reverse upward. RSI is great for spotting momentum shifts, potential reversals, and trend strength, but it can be noisy in choppy markets, leading to misleading signals.
That's where the Kalman filter comes in; it enhances the RSI by applying a sophisticated smoothing process that predicts the RSI’s next value based on its historical trend, then updates this prediction with the actual RSI reading. It operates in two phases: prediction and correction. In the prediction phase, it uses the previous filtered RSI and adds uncertainty from process noise (Q), which is derived from the historical variance of RSI changes, reflecting how much the RSI might unexpectedly shift. In the correction phase, it calculates a Kalman gain based on the ratio of prediction uncertainty to measurement noise (R), which is determined from the variance between raw RSI and a smoothed version, indicating the raw data’s noisiness. This gain weights how much the filter trusts the new RSI versus the prediction, blending them to produce a smoothed RSI that reduces noise while staying responsive to real trends, outperforming simpler methods like moving averages that often lag or oversmooth.
With the Kalman Filtered RSI, you get a refined view of momentum, making it easier to spot trends and reversals with clarity. This indicator’s ability to dynamically adapt to market changes delivers timely, reliable signals, making it a powerful addition to your trading strategy for any market or timeframe.

M2 Global Liquidity Index [Extended + Offset]M2 Global Liquidity Index
This indicator visualizes global M2 money supply, weighted in USD, based on major economic regions.
Features:
Standard Mode: Includes M2 data from the USA, China, Eurozone, Japan, and the UK.
Extended Mode: Adds Switzerland, Canada, India, Russia, Brazil, South Korea, Mexico, and South Africa.
Offset Function: Adjustable time lag (78 or 108 days) to analyze the delayed impact of liquidity on financial markets.
Use Case:
Designed to help identify global liquidity cycles and assess potential turning points in financial markets. Rising global liquidity generally supports risk assets like equities and crypto, while declining liquidity can put downward pressure on these markets.
Technical Details:
Non-USD M2 values are converted using real-time FX rates.
All values are displayed in trillions of USD (Tn).
Note:
Not all countries release M2 data in real-time or at the same frequency. Minor delays and discrepancies may occur.
Example:

Dirty Market IndexThis indicator is designed to out an index displaying the level of dirtiness in market.
This level is defined by:
Sum of shadow lengths of last n candles (n is input and user can change it, it's 100 by default)
divided by
Sum of full candle bodies of last n candles (high - low)
This factor indicates how many percents of the market movement has been placed in shadows of candles, the higher this number, the dirtier market would be.

Liquidity Stress Index SOFR - IORBLiquidity Stress Index (SOFR - IORB)
This indicator tracks the spread between the Secured Overnight Financing Rate (SOFR) and the Interest on Reserve Balances (IORB) set by the Federal Reserve.
A persistently positive spread may indicate funding stress or liquidity shortages in the repo market, as it suggests overnight lending rates exceed the risk-free rate banks earn at the Fed.
Useful for monitoring monetary policy transmission or market/liquidity stress.

RSI Full [Titans_Invest]RSI Full
One of the most complete RSI indicators on the market.
While maintaining the classic RSI foundation, our indicator integrates multiple entry conditions to generate more accurate buy and sell signals.
All conditions are fully configurable, allowing complete customization to fit your trading strategy.
⯁ WHAT IS THE RSI❓
The Relative Strength Index (RSI) is a technical analysis indicator developed by J. Welles Wilder. It measures the magnitude of recent price movements to evaluate overbought or oversold conditions in a market. The RSI is an oscillator that ranges from 0 to 100 and is commonly used to identify potential reversal points, as well as the strength of a trend.
⯁ HOW TO USE THE RSI❓
The RSI is calculated based on average gains and losses over a specified period (usually 14 periods). It is plotted on a scale from 0 to 100 and includes three main zones:
Overbought: When the RSI is above 70, indicating that the asset may be overbought.
Oversold: When the RSI is below 30, indicating that the asset may be oversold.
Neutral Zone: Between 30 and 70, where there is no clear signal of overbought or oversold conditions.
⯁ ENTRY CONDITIONS
The conditions below are fully flexible and allow for complete customization of the signal.
______________________________________________________
🔹 CONDITIONS TO BUY 📈
______________________________________________________
• Signal Validity: The signal will remain valid for X bars .
• Signal Sequence: Configurable as AND/OR .
📈 RSI Conditions:
🔹 RSI > Upper
🔹 RSI < Upper
🔹 RSI > Lower
🔹 RSI < Lower
🔹 RSI > Middle
🔹 RSI < Middle
🔹 RSI > MA
🔹 RSI < MA
📈 MA Conditions:
🔹 MA > Upper
🔹 MA < Upper
🔹 MA > Lower
🔹 MA < Lower
📈 Crossovers:
🔹 RSI (Crossover) Upper
🔹 RSI (Crossunder) Upper
🔹 RSI (Crossover) Lower
🔹 RSI (Crossunder) Lower
🔹 RSI (Crossover) Middle
🔹 RSI (Crossunder) Middle
🔹 RSI (Crossover) MA
🔹 RSI (Crossunder) MA
🔹 MA (Crossover) Upper
🔹 MA (Crossunder) Upper
🔹 MA (Crossover) Lower
🔹 MA (Crossunder) Lower
📈 RSI Divergences:
🔹 RSI Divergence Bull
🔹 RSI Divergence Bear
______________________________________________________
______________________________________________________
🔸 CONDITIONS TO SELL 📉
______________________________________________________
• Signal Validity: The signal will remain valid for X bars .
• Signal Sequence: Configurable as AND/OR .
📉 RSI Conditions:
🔸 RSI > Upper
🔸 RSI < Upper
🔸 RSI > Lower
🔸 RSI < Lower
🔸 RSI > Middle
🔸 RSI < Middle
🔸 RSI > MA
🔸 RSI < MA
📉 MA Conditions:
🔸 MA > Upper
🔸 MA < Upper
🔸 MA > Lower
🔸 MA < Lower
📉 Crossovers:
🔸 RSI (Crossover) Upper
🔸 RSI (Crossunder) Upper
🔸 RSI (Crossover) Lower
🔸 RSI (Crossunder) Lower
🔸 RSI (Crossover) Middle
🔸 RSI (Crossunder) Middle
🔸 RSI (Crossover) MA
🔸 RSI (Crossunder) MA
🔸 MA (Crossover) Upper
🔸 MA (Crossunder) Upper
🔸 MA (Crossover) Lower
🔸 MA (Crossunder) Lower
📉 RSI Divergences:
🔸 RSI Divergence Bull
🔸 RSI Divergence Bear
______________________________________________________
______________________________________________________
🤖 AUTOMATION 🤖
• You can automate the BUY and SELL signals of this indicator.
______________________________________________________
______________________________________________________
⯁ UNIQUE FEATURES
______________________________________________________
Signal Validity: The signal will remain valid for X bars
Signal Sequence: Configurable as AND/OR
Condition Table: BUY/SELL
Condition Labels: BUY/SELL
Plot Labels in the Graph Above: BUY/SELL
Automate and Monitor Signals/Alerts: BUY/SELL
Signal Validity: The signal will remain valid for X bars
Signal Sequence: Configurable as AND/OR
Condition Table: BUY/SELL
Condition Labels: BUY/SELL
Plot Labels in the Graph Above: BUY/SELL
Automate and Monitor Signals/Alerts: BUY/SELL
______________________________________________________
📜 SCRIPT : RSI Full
🎴 Art by : @Titans_Invest & @DiFlip
👨💻 Dev by : @Titans_Invest & @DiFlip
🎑 Titans Invest — The Wizards Without Gloves 🧤
✨ Enjoy the Spell!
______________________________________________________
o Mission 🗺
• Inspire Traders to manifest Magic in the Market.
o Vision 𐓏
• To elevate collective Energy 𐓷𐓏

My Bar IndexA simple script to display bar index at the bottom of the chart. It will be a handy tool for those who like to do bar counts.

Relative Directional Index (RDI)🔍 Overview
The Relative Directional Index (RDI) is a hybrid tool that fuses the Average Directional and the Relative Strength Indices (ADX and RSI) into a single, highly visual interface. While the former captures trend strength, the latter reveals momentum shifts and potential exhaustion. Together, they can confirm trend structure, anticipate reversals, and sharpen the timing entries and exits.
📌 Why Combine ADX with RSI?
Most indicators focus on either trend-following (like ADX) or momentum detection (like RSI)—but rarely both. Each comes with trade-offs:
- ADX alone confirms trend strength but ignores momentum.
- RSI alone signals overbought/oversold, but lacks trend context.
The RDI resolves this by integrating both, offering:
- Smarter filters for trend entries
- Early warnings of momentum breakdowns
- More confident signal validation
🧠 Design Note: Fibonacci Harmony
All default values—5, 13, 21—are Fibonacci numbers. This is intentional, as these values reflect the natural rhythm of market cycles, and promote harmonic calibration between price action and indicator logic.
🔥 Key Features
✅ ADX Histogram
- Green bars = trend gaining strength
- Red bars = trend weakening
- Adjustable transparency for visual tuning
✅ ADX Line (Orange)
- Measures trend strength over time
- Rising = accelerating trend
- Falling = trend may be fading
✅ RSI Line (Lemon Yellow)
- Captures momentum surges and slowdowns
- Above 50 = bullish control
- Below 50 = bearish pressure
✅ Trend Strength Squares
- Bright green = strong uptrend
- Bright red = strong downtrend
- Faded colors = range-bound or indecisive
✅ ADX/RSI Crossover Markers
- Yellow square = RSI crosses above ADX → momentum building
- Orange square = ADX crosses above RSI → trend still dominant
✅ Customizable Reference Lines
- Yellow (50) = strong trend threshold
- Red (30) = weak trend zone
- Green (70) = overextended, potential exhaustion
_______________________________________________________
🎯 How to Trade with the RDI
The RDI helps traders identify momentum-supported trends, catch early reversals, and avoid false signals during consolidation.
✅ Trend Confirmation Entries
🔼 Bullish → Enter long on pullbacks or resistance breakouts
- ADX rising above 30
- RSI above 50
- Green trend square visible
🔽 Bearish → Enter short on breakdowns or failed retests
- ADX rising
- RSI below 50
- Red trend square visible
🧯 Exit if RSI crosses back against trend direction or ADX flattens
🚨 Reversal Setups Using Divergence
📈 Bullish Divergence → Long entry after confirmation (e.g. engulfing bar, volume spike)
- Price prints lower low
- RSI prints higher low
- Green triangle
📉 Bearish Divergence → Short entry on breakdown
- Price prints higher high
- RSI prints lower high
- Red triangle
Tip: Stronger if ADX is declining (fading trend strength)
🔂 Breakout Detection via Cross Markers
- Yellow square = RSI > ADX → breakout brewing
- Orange square = ADX > RSI → trend continuation likely
⏸️ Avoid Choppy Markets
- RSI between 45–55
- Faded trend squares
- Flat ADX below 20–30
🧠 Pro Tips
- Combine RDI with VWAPs, moving averages and/or pitchforks
- Watch for alignment between trend and momentum
- Use divergence markers as confirmation, not stand-alone triggers
_______________________________________________________
⚠️ Hidden Divergence (Optional)
The RDI includes optional hidden divergence detection. These signals suggest trend continuation but are off by default. Use with discretion—best in established trends, not sideways markets.
🙈 Hidden Bullish
- Price prints higher low
- RSI prints lower low
🙈 Hidden Bearish
- Price prints lower high
- RSI prints higher high

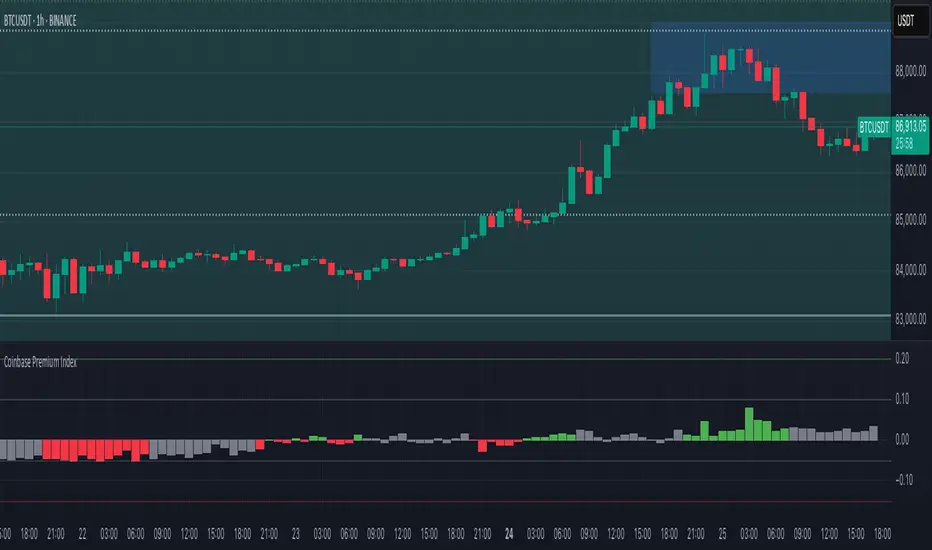
Coinbase Premium IndexThe Coinbase Premium Index is a measure of the percentage difference between the price of any coin on Coinbase Pro (USD pair) and the price on Binance (USDT trading pair). It helps differentiate between global and US-specific market sentiment
Major benefits:
Choose between USD or USDC for the Coinbase pair — they can behave differently in rare but actionable situations.
Apply it to any coin, not just BTC. Open any USDT-based chart on any exchange, and the script will automatically compare it with Coinbase’s USD or USDC price.
Highlight only active U.S. trading hours, cutting out irrelevant noise.
Display key thresholds that signal buying or selling pressure.
RSI Signal Pro[UgurTash]Introducing RSI Signal Pro for TradingView
RSI Signal Pro is a refined version of the standard Relative Strength Index (RSI) , designed to improve signal accuracy by generating alerts in real-time instead of waiting for multiple candle confirmations. This enhancement allows traders to react faster to market movements while maintaining the familiar RSI structure.
What Makes RSI Signal Pro Unique?
✅ Real-Time RSI Signals: Unlike the traditional RSI, which waits for candle confirmations, this version provides immediate buy and sell signals upon key level crossovers.
✅ Dual Trading Modes: Choose between Simple Mode (standard RSI crossovers) and Advanced Mode (momentum-adjusted signals with price validation).
✅ Customizable RSI-Based Moving Average (MA): Optionally apply SMA, EMA, WMA, or VWMA to smooth RSI fluctuations and identify longer-term trends.
✅ Adaptive Signal Filtering: The Advanced Mode reduces false signals by filtering RSI movements with a momentum threshold and historical RSI validation.
✅ User-Friendly Interface: Simple ON/OFF toggles allow easy customization of the indicator's behavior.
How This Indicator Works
🔹 Simple Mode: Identical to traditional RSI, triggering signals when RSI crosses 30 (bullish) or 70 (bearish).
🔹 Advanced Mode: Uses historical RSI pivots, momentum verification, and price confirmation to refine signal accuracy—ideal for traders looking for more precise entries.
🔹 RSI-Based MA: Optionally overlay moving averages onto the RSI, providing additional trend confirmation.
How to Use RSI Signal Pro
1️⃣ Select a mode: Use Simple Mode for frequent alerts or Advanced Mode for refined signals.
2️⃣ Enable RSI-Based MA: Apply SMA, EMA, WMA, or VWMA to smooth RSI fluctuations.
3️⃣ Set alerts: TradingView notifications allow you to react to real-time RSI movements instantly.
4️⃣ Apply to multiple markets: Effective for crypto, forex, stocks, and commodities.
Why Use RSI Signal Pro Instead of Standard RSI?
While RSI Signal Pro maintains the core functionality of the standard RSI, its real-time signal generation allows traders to make faster decisions without the typical delay caused by waiting for candle confirmations. Additionally, the optional momentum filtering and moving average smoothing ensure fewer false signals and better trade accuracy.

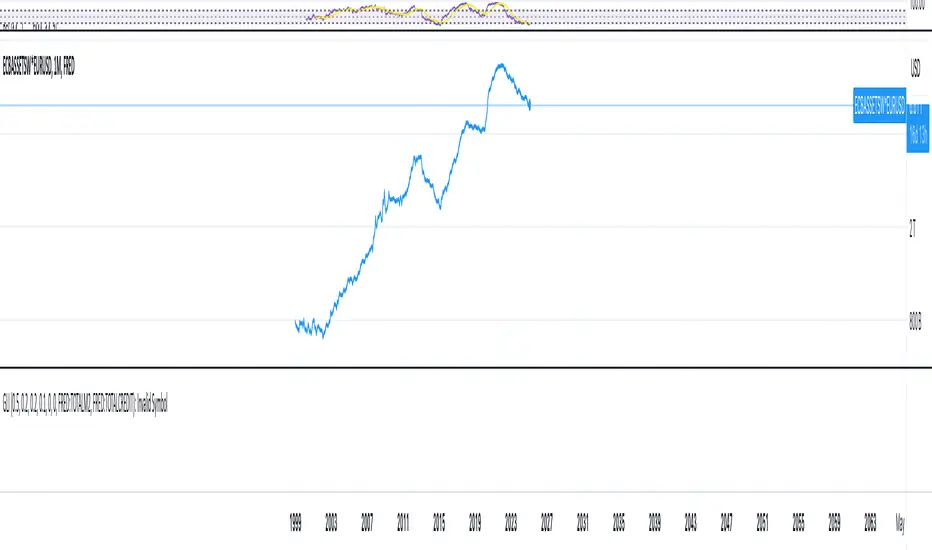
Global Liquidity IndexThis custom indicator provides a composite measure of global liquidity by combining key central bank balance sheet data with additional liquidity proxies. The script aggregates asset data from major economies—including the United States, Japan, China, and the Eurozone—converting non-USD values into U.S. dollars using real-time exchange rates. It then subtracts selected liability measures (such as reverse repurchase agreements and other adjustments) to approximate net central bank liquidity.
Key features include:
• Multi-Regional Coverage:
Incorporates data from the U.S. Federal Reserve, Bank of Japan, Chinese central bank proxies, and the European Central Bank, allowing you to gauge liquidity across major global markets.
• Dynamic Currency Conversion:
Uses live exchange rates (JPY/USD, CNY/USD, EUR/USD) to ensure that all regional figures are consistently expressed in U.S. dollars.
• Customizable Weighting:
Assign adjustable weights to each region’s data, so you can reflect economic size or your own view of their relative importance.
• Additional Liquidity Proxies:
Optionally integrates measures for global money supply and global credit/repo activity (or other proxies of your choice) with user-defined scaling factors.
• User-Friendly Configuration:
All key parameters—including weights and scaling factors—are available as inputs, making the indicator flexible and easy to tailor to your analysis needs.
This indicator is designed for traders and analysts seeking a broad view of global monetary conditions. Whether you’re tracking shifts in central bank policies or assessing global market liquidity, the Global Liquidity Index provides an insightful, customizable tool to help you visualize and interpret liquidity trends over time.
True Strength Index with Zones & AlertsKey Features:
True Strength Index (TSI) Calculation
Uses double-smoothed exponential moving averages (EMA) to calculate TSI.
A signal line (EMA of TSI) helps confirm trends.
Dynamic Color Coding for TSI Line
Green: TSI is above the signal line (Bullish).
Red: TSI is below the signal line (Bearish).
Crossover & Crossunder Signals
Bullish Crossover (TSI crosses above Signal Line) → Green Circle.
Bearish Crossunder (TSI crosses below Signal Line) → Red Circle.
Alerts for Trading Signals
Buy Alert: TSI crosses above the signal line.
Sell Alert: TSI crosses below the signal line.
Overbought & Oversold Zones
Overbought: Between 40 and 50 (Red Zone).
Oversold: Between -40 and -50 (Green Zone).
Highlighted Background when TSI enters these zones.
Neutral Line at 0
Helps determine trend direction and momentum shifts.
How to Use These Values:
• TSI Crosses Above Signal Line → Bullish entry.
• TSI Crosses Below Signal Line → Bearish entry.
• Overbought (+40 to +50) & Oversold (-40 to -50) zones → Watch for trend reversals.
• Divergence Signals → If price makes a new high/low but TSI doesn’t, momentum is weakening.
