Open Interest Stochastic Money Flow IndexThis is the improved version of Stochastic Money Flow Index script that uses Open Interest instead of volume in Future markets.
I think it will make a difference especially in Future and CFD markets.
Since the system will pull data from Quandl, CFTC reports may cause repaint when disclosed.
So if you use it during the weekly time frame (1W), it will definitely not repaint.
You can also use the volume by selecting "Others" from the menu.This option applies to each instrument, you can use it on any financial instrument with or without COT data.
Bitcoin is included in the "Futures" option.
In Futures, you can observe the difference of Open Interest's success by comparing, since it counts exchanges between the two parties singularly, it reacts more firmly to speculative movements.
This script also includes alerts and bar color options, you can use from the menu.
It is also suitable for mutable variables.This script was freed from the integer loads.You can modify it in any adaptive or fractional period.
I hope it will help your analyzes, regards .
Cari dalam skrip untuk "index"

Variable Index Dynamic Average (VIDYA) BandsThis adds volatility bands to the Variable Index Dynamic Average (VIDYA). The bands are calculated using the exponential moving average of the standard deviation of the VIDYA.
Thanks to everget for programming the VIDYA for tradingview.

Function : Stochastic Money Flow IndexThis function is similar to the stochastic rsi function.
The only difference is that Money Flow Index is used instead of rsi.
Oversold and overbought values were changed to 80 and 20.
Because the MFI's overbought and overbought zones are 20 and 80.
In MFI, I think that it can be more beneficial in liquid markets than stochastic rsi since volume is taken into account in contrast to RSI.
Regards.

Commercial Short IndexThis script takes the hedger (commercial short) from the COT report and normalize the chart for configurable time frames (e.g. 26 weeks, 152 weeks and 260 weeks).
Based on the "Commercial Index-Buschi" script by MagicEins.

[RS]Directional Index ConvergenceDisplays the Convergence of the positive and negative of the
Directional Index(DI), 0 will be generally between 20 <-> 25 on the DI.

[BACKTEST]Traders Dynamic Index Indicator Alert by JustUncleLBy request, this script is a "strategy" version of my "Traders Dynamic Index Indicator Alert" script, made available for backtesting to help find optimal trade settings for a particular asset.

Didi Index Improved with QQE | jhI was perplexed by the lack of continuation signals in trends, so I spent some time looking for a suitable indicator just for that purpose and fast indicators that can provide continuation signals tend to be too noisy as well.
I'm always intrigued by QQE (Qualitative Quantitative Estimation), so I QQE-ed almost everything I encountered.
After a while, I settled on Didi Index and enhanced it by adding an additional signal line calculated from QQE trailing line. The QQE trailing line provides additional cross overs for the short/fast Didi line, specially created for the NNFX continuation signals in the same direction.
The QQE trailing line acts as zero cross, providing an additional filter for ranging periods.
There's a few ways of identifying the cross overs:
Didi cross overs signals are highlighted with shapes at the top.
Didi long signal when fast and slow Didi crosses above zero
Didi short signal when fast and slow Didi crosses below zero
Continuation signals are highlighted with shapes at the bottom.
Continuation long signal when Didi fast line cross over QQE trailing line
Continuation short signal when Didi fast line cross under QQE trailing line
Example of continuation trades
Example of filtering bad signals from your baseline, confirmation or continuation signals.
Credits to Glaz and Shizaru for their QQE code.

Function : Relative Strength Index The relative strength index function is defined.
Now you can easily use length with mutable variables !!


Relative Candle Volatility IndexI am not certain if something similar is already available out there. However, here's my own implementation of my simple idea of using the length of the candle-body, or wicks (high-low), to derive a Relative Volatility Index / Oscillator.
In summary: When the R.CVI is significantly positive, it indicates a sudden increase in volatility; whereas, when the R.CVI drops significantly negative, it indicates a sudden decrease in volatility -- in relative to the (just prior) market trend.
If you do wish to copy, modify, and publish an alternate version base on this script, please do not plagiarize and kindly reference/link back to this original script. =D
~ * ~ * ~ * ~ * ~ * ~ * ~ * ~ * ~ * ~ * ~ * ~ * ~ * ~ * ~ * ~ * ~ * ~ * ~ * ~ * ~
Note:
In no way is this intended as a financial/investment/trading advice. You are responsible for your own investment decisions and trades.
Please exercise your own judgement for your own trades base on your own risk-aversion level and goals as an investor or a trader. The use of OTHER indicators and analysis in conjunction (tailored to your own style of investing/trading) will help improve confidence of your analysis, for you to determine your own trade decisions.
~ * ~ * ~ * ~ * ~ * ~ * ~ * ~ * ~ * ~ * ~ * ~ * ~ * ~ * ~ * ~ * ~ * ~ * ~ * ~ * ~
Please check out my other indicators sets and series, e.g.
LIVIDITIUM (dynamic levels),
AEONDRIFT (multi-levels standard deviation bands),
FUSIONGAPS (MA based oscillators),
MAJESTIC (Momentum/Acceleration/Jerk Oscillators),
PRISM (pSAR based oscillator, with RSI/StochRSI as well as Momentum/Acceleration/Jerk indicators),
PDF (parabolic SAR /w HighLow Trends Indicator/Bar-color-marking + Dynamic Fib Retrace and Extension Level)
and more to come.
Constructive feedback and suggestions are welcome.
~ JuniAiko
(=^~^=)v~

Relative Vigor IndexHere we are looking at a trend strength indicator based on the Relative Vigor Index(RVI). The RVI measures trend strength by comparing the open-close and high-low ranges for the current and three most recent periods. As a zero-centered oscillator, the RVI oscillates above and below zero to signal the strength of the trend.
As there are different ways to interpret the RVI, we have included 3 different modes for traders to choose from in the input option menu:
1. Zero-Crossing:
The RVI Histogram will turn green when it crosses above zero and red when it crosses below. Therefore, a green RVI means the trend is bullish and red means bearish. This mode is better for longer-term swing trading in comparison to the other 2 modes.
2. Increasing / Decreasing:
The RVI histogram will turn green when it is increasing(rvi >= rvi ) and red when it is decreasing. A green RVI is viewed as a bullish signal and red means bearish. This mode is a good middle-ground between the Zero-Crossing and Signal Comparison modes.
3. Signal Comparison:
Here, the RVI is compared to its signal line. If the RVI is greater than its signal line, the histogram is green, indicating a bullish trend, while red means bearish. This mode is preferred for scalping.
Hope everyone finds this one useful!
You can check out our other invite only studies/strategies at our website: profitprogrammers.com

Donald Duck Index @ LekkerCryptisch.nl [v2019-07-24]This indicator provides three series that can be used to compare to other series, based on the price of the Dutch weekly magazine Donald Duck.
1) The price in euros
2) The price index
3) The year-on-year price appreciation

Modiied Elder Ray Index(Bull or Bear)Here's a modified version of the Elder Ray Index created by the famed Dr.Alexander Elder. This indicator has proven to be especially helpful lately given the crazy state of crypto.
Slow Moving Average :
The top chart shows the moving average used to filter trends. I recommend using a higher window length(can be adjusted with the 'lenSlowMA' input option). I wanted this to be a very smooth moving average, so I used the following formula:
slow MA = ema(vwma(close, 64), 64)
This resulted in a pretty smooth line that still detects major price movements very well.
-The background and bar colors both change in response to the Slow MA's value. The background and bars change to green when a bullish trend is detected and red when bearish.
Bear and Bull Power :
To balance things out a little, I included two histogram's based on Elder's Ray. Here, a more responsive EMA with a shorter window length is used to calculate the bull and bear power values and track short-term price fluctuations.
NOTE: The length of the EMA used here can be adjusted in the input menu.
Bull Power = current high - EMA(close, 13)
Bear Power = current low - EMA(close, 13)

Colored Columns for Elder's Force Index EMAThe Elder's Force Index is an oscillator that takes into account the change of the price combined with the volume:
EFI = (close of the current day - close of the previous day) * volume of the current day
If measure the force of the price change.
If you calculate the exponential moving average of the last two days to smooth the signal EMA(EFI,2), you have a nice buy/sell indicator in the context of the "Elder Triple Screen Method":
- If you are in a long term uptrend (for example ema(13) going up), you have a buy signal if EFI(2)<0, because then you have a short term downtrend in a long term uptrend. Put a "stop buy" a bit higher in case the long term uptrend continues.
- If you are in a long term downtrend (for example ema(13) going down), you have a sell signal if EFI(2)>0, because then you have a short term uptrend in a long term downtrend. Put a "stop sell" a bit lower in case the long term downtrend continues.
This graph shows you colored columns for the EMA(EFI,2), which is more visible than the one-color indicator provided by default by TV.
You can also display the EFI itself on top of the columns. (optional, I personaly do not use it)
PS: ema(13) is to make the explanation simple. Personaly, I use MACD histogram on a weekly view to define if I am on a long term uptrend or downtrend.


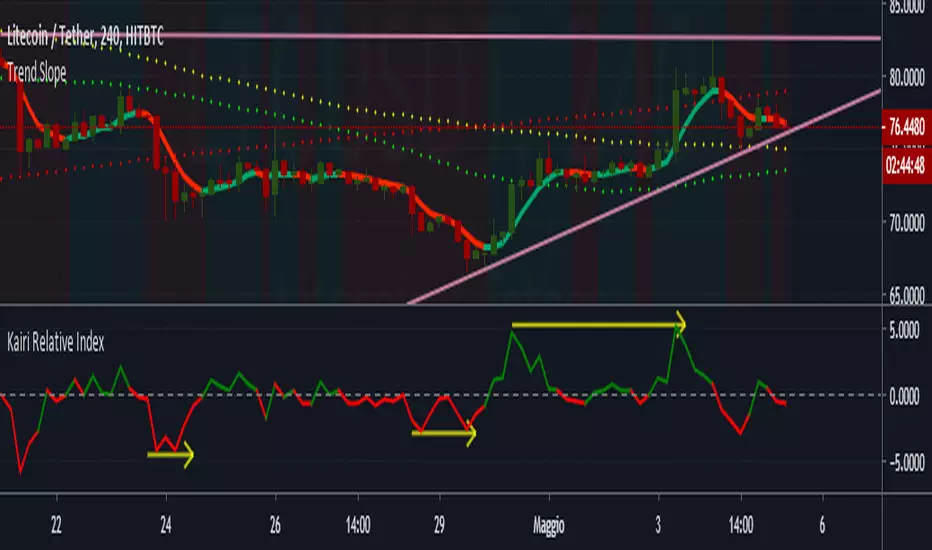
Kairi Relative Index Il Kairi Relative Index è una vecchia metrica giapponese con origini sconosciute.E' simile all'RSI ,però io trovo dia meno falsi
segnali . In origine è settato a 14 periodi però io ritengo che su tf 1H e 4H funzioni in modo migliore settato a 5 periodi.
Bisogna utilizzare questo indice per cercare divergenze sui prezzi ed in alcuni casi può confermare , aiutato da altri indicatori , l'entrata
nel mercato con l'incrocio delle linea zero.
stock gain% vs index gain %This shows the relative strength or weakness of a stock vs an index on any given candle price movement.
Negative stock candle and relative strength shows accumulation
Positive stock candle and relative weakness shows distribution
accumulation will plot an 'A'
distribution will plot a 'D'


EW Correction on choppiness with CB Composite index [yoxxx]Sometimes it is more than convenient to differ fast from a genuine high or
a B in an expanded flat (a very impulsive counter within a correction, resulting in an higher high than the genuine.)
I tried to use the typical choppiness of Bs in general to indicate them (orange box in example).
Therefore i used a momentum of close, relative to the bar's heights (=vola).
I turned out, that it works like charme to show ALL correction phases in a trend cycle. (And hence the impulses as well.)
(Credit:The choppiness of the Bs is a hint of Constance Brown, which i adopted. Bow to her.)
Note1: I tested it on all Timeframes, but mainly on D; and only in bull markets.
Note 2: I added the composite index of Constance Brown which is faster than the rsi and - special skill -
can inidcate divergences to prices where rsi fails. Use it as a hint for choppiness changes to come.
Since its strength lies in being not normalized, sometimes you may adjust the composite for fitiing it to the EW bars.I inserted a line for that in the script.
Feedback welcome!
yoxxx

Market Facilitation Index - MFIUsing Market Facilitation Index - MFI you will be able to recognise two important metrics:
Whether the current trend is strong enough to trade it.
When a new trend may start.
MFI combines changes in price (range) and volume. Here is the formula:
MFI = (High – Low) * Volume
The indicator has bars of four colours. Each colour has a specific meaning and shows how the market responds to a change in volume.
Green. A green bar forms in the situation that both MFI and the volume are up. It means that more and more traders join the market in the current direction. In other words, it points to a strong trend, so you can open trades in line with this trend.
Brown. A brown bar appears when both MFI and the volume decline. It is also called “fade”. It signals that traders are hesitating and don’t want to continue the trend anymore. As a result, it’s not recommended to join the trend. Several brown bars are a sign of the potential reversal of the trend.
Blue. A blue bar forms when MFI increases, but the volume declines. A spike in price may be short-lived a precede a change in the trend. Blue bars appear at the times when newbies enter the trend, but professional traders know that it’s already too dangerous.
Pink. A pink bar, also known as squat, appears when MFI is diminishing, but the volume is growing. It reflects an increase of trading interest and an active fight between buyers and sellers. After one of the sides wins, the price will likely make a big move breaking support or resistance levels. The MFI, however, can’t be used to determine the direction of the breakout.

Money Flow Index sensitive by FFX65Normal Money flow index with levels on 70 and 30 to select the first new trendcycle and catchig the trend quick.

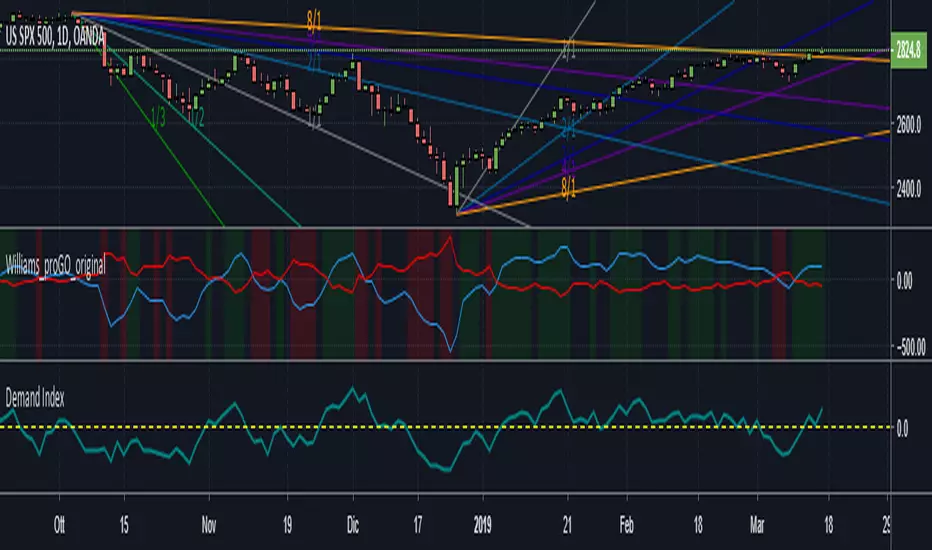
Demand Indexil demand index misura la pressione rialzista con la pressione ribassista e indica con la linea dello zero se prevale l'una o l'altra.
inoltre indica delle buone divergenze dei prezzi.Il creatore di questo indice ( James Sibbet ) usava utilizzarlo con TF settimanale , ma io trovo che
fuzioni bene anche sul Day
Herrick Payoff Index Herrick Payoff Index con quantl
indicatore usato per identificare delle divergenze con il prezzo del sottostante ed anche come segnale buy/sell con l'incrocio della linea dello zero
