RY-Parabolic Stop and ReverseParabolic Stop and Reverse with Support Resistance (PSAR-SR)
Identify dynamic support and resistance levels based on price movements.
Reduce false signals often generated by the regular PSAR.
Provide more accurate trading decisions by considering previous reversal points as support and resistance.
How Does PSAR-SR Work?
PSAR Reversal Points:
When the regular PSAR generates a reversal signal, the price at that reversal point is used as support (in an uptrend) or resistance (in a downtrend).
Support and Resistance Lines:
Support: A line drawn from the previous PSAR reversal point in an uptrend.
Resistance: A line drawn from the previous PSAR reversal point in a downtrend.
Price often moves sideways between these support and resistance levels before a breakout occurs.
Breakout Above/Below Support and Resistance:
A Buy signal is generated when the price breaks above resistance with a new candle closing above it.
A Sell signal is generated when the price breaks below support with a new candle closing below it.
Strategy Using PSAR-SR
Wait for the Breakout:
Avoid buying or selling immediately when the PSAR gives a signal.
Confirm that the price breaks past the support or resistance levels and forms a new candle outside those lines.
Use Alongside Other Indicators:
PSAR-SR is not recommended as a standalone tool. Use additional confirmation indicators such as:
Moving Average: To identify long-term trends.
RSI or MACD: To confirm momentum or overbought/oversold conditions.
Advantages of PSAR-SR
Reduces False Signals:
By focusing on previous support and resistance levels, PSAR-SR avoids invalid signals.
Helps Identify Breakouts:
It provides better insight for traders to enter the market during valid breakouts.
Limitations of PSAR-SR
Not Suitable for Sideways Markets:
If the price moves sideways for an extended period, the signals may become less effective.
Requires Additional Confirmation:
Should be used in combination with other indicators to improve accuracy.
Conclusion
PSAR-SR is a helpful tool for identifying dynamic support and resistance levels and generating buy/sell signals based on price breakouts. However, it should always be used with additional indicators for confirmation to avoid false trades.
Disclaimer:
Use this indicator at your own risk, and always perform additional analysis before making any trading decisions.
If you'd like further clarification or examples of how to apply this to a chart, feel free to ask! 😊
Cari dalam skrip untuk "indicators"

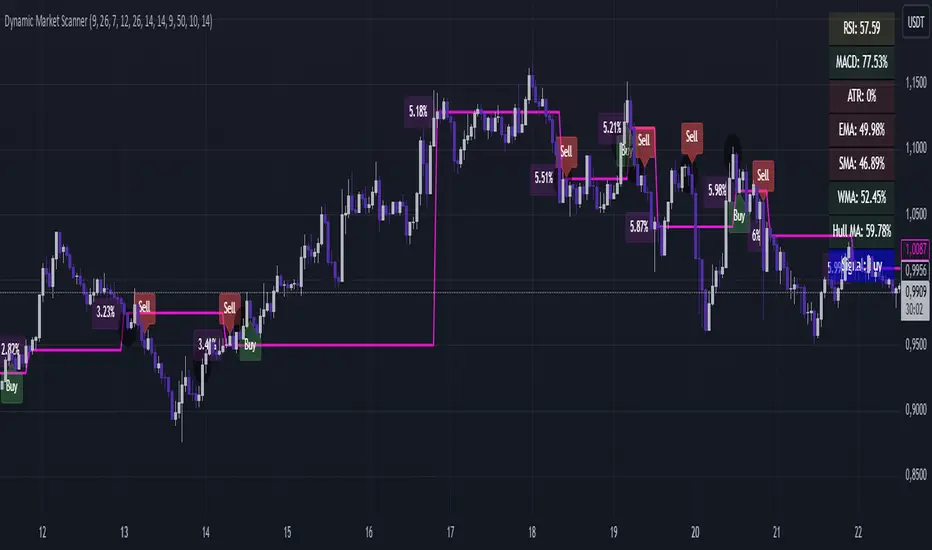
Dynamic Market ScannerDynamic Market Scanner is a powerful tool for analyzing financial markets, combining a variety of indicators to provide clear and understandable signals.
Key Features:
- Signal Generation:
The main signals "Buy", "Sell", and "Hold" are formed based on the analysis of indicators:
- MACD
- RSI
- SMA
- EMA
- WMA
- Hull MA
Additional Analytical Tools:
- ATR is used to assess volatility and helps to understand the risk of the current market situation.
- SMA Ichimoku does not generate signals but is used to assess their accuracy.
- If the price is above the SMA, "Buy" signals are more likely, as this confirms the strength of the upward movement.
- If the price is below the SMA, "Buy" signals require additional confirmations.
Dashboard:
Displays the current price position relative to the indicators, helping the trader understand how strong or weak the current signals are.
Advantages of Using:
1. Signal Filtering:
The price position relative to the SMA Ichimoku helps to assess the likelihood of successful trades.
2. Volatility Analysis:
ATR provides additional information about risks and market fluctuations.
3. Comprehensive Approach:
Signal generation is based on a combination of key indicators, offering a multifaceted view of the market.
Explanation of Percent Calculation in the Table:
- The table shows the values of indicators such as MACD, ATR, EMA, SMA, WMA, and Hull MA in percentages. Percentages are calculated based on the current value of the indicator relative to its maximum and minimum.
- Percentages are displayed for each indicator, allowing traders to assess market conditions based on their current values.
Dynamic Market Scanner will become a reliable assistant in your technical analysis toolkit, providing a comprehensive overview of market conditions and helping to make informed trading decisions.
LiquidFusion SignalPro [CHE] LiquidFusion SignalPro – Indicator Overview
The LiquidFusion SignalPro is a powerful and sophisticated TradingView indicator designed to identify high-quality trade entries and exits. By combining seven unique sub-indicators, it provides comprehensive market analysis, ensuring traders can make informed decisions. This tool is suitable for all market conditions and supports customization to fit individual trading strategies.
Key Components (Sub-Indicators):
1. RPM (Relative Price Momentum):
- Measures cumulative price momentum over a specified period.
- Provides insights into price strength and directional bias.
- Input Customization:
- Source: Data for momentum calculation.
- Period: Length for momentum measurement.
- Resolution: Timeframe for data fetching.
2. BBO (Bull-Bear Oscillator):
- Calculates the strength of bullish or bearish momentum based on price movement and RSI conditions.
- Uses a super-smoothing technique for reliable signals.
- Customizable parameters include the oscillator's period and repainting options.
3. MACD (Moving Average Convergence Divergence):
- A classic momentum indicator for trend direction and strength.
- Provides buy/sell signals based on the crossover of the MACD line and signal line.
- Input Customization:
- Fast/Slow EMA Periods.
- Signal Line Period.
- Resolution and Source Data.
4. RSI (Relative Strength Index):
- Tracks overbought and oversold conditions.
- A key tool to validate trend continuation or reversals.
- Customizable period, resolution, and source.
5. CCI (Commodity Channel Index):
- Measures the deviation of price from its average.
- Useful for identifying cyclical trends.
- Input Customization includes period, resolution, and source.
6. Stochastic Oscillator:
- Indicates momentum by comparing closing prices to a range of highs and lows.
- Includes smoothing factors for %K and %D lines.
- Customizable parameters:
- %K Length and Smoothing.
- Resolution and Repainting Options.
7. Supertrend:
- A trailing stop-and-reverse system for trend-following strategies.
- Excellent for identifying strong trends and potential reversals.
- Inputs include the multiplier factor and period for ATR-like calculations.
Inputs Overview:
The indicator supports extensive customization for each sub-indicator, grouped under intuitive categories:
- Color Settings: Define bullish and bearish plot colors.
- RPM, BBO, MACD, RSI, CCI, Stochastic, and Supertrend Settings: Tailor each sub-indicator's behavior with adjustable parameters.
- UI Options: Toggle features such as bar coloring, indicator names, and plotted candles.
Trade Signals:
- Long Signal:
- All indicators align in a bullish state:
- RPM > 0, MACD > 0, RSI > 50, Stochastic > 50, CCI > 0, BBO > 0, Supertrend below price.
- Plot: Green triangle below the candle.
- Alert: Notifies the trader of a potential long entry.
- Short Signal:
- All indicators align in a bearish state:
- RPM < 0, MACD < 0, RSI < 50, Stochastic < 50, CCI < 0, BBO < 0, Supertrend above price.
- Plot: Red triangle above the candle.
- Alert: Notifies the trader of a potential short entry.
Features:
- Enhanced Visuals: Plots sub-indicator statuses using labels and color-coded shapes for clarity.
- Alerts: Integrated alert conditions for both long and short trades.
- Bar Coloring: Provides overall trend bias with green (bullish), red (bearish), or gray (neutral) bars.
- Customizable Table: Displays the indicator's status in the chart’s top-right corner.
Trading Benefits:
The LiquidFusion SignalPro excels in generating high-quality entries and exits by:
- Reducing noise through multiple indicator alignment.
- Supporting multiple timeframes and resolutions for flexibility.
- Offering customizable inputs for personalized trading strategies.
Use this tool to enhance your market analysis and improve your trading performance.
Disclaimer:
The content provided, including all code and materials, is strictly for educational and informational purposes only. It is not intended as, and should not be interpreted as, financial advice, a recommendation to buy or sell any financial instrument, or an offer of any financial product or service. All strategies, tools, and examples discussed are provided for illustrative purposes to demonstrate coding techniques and the functionality of Pine Script within a trading context.
Any results from strategies or tools provided are hypothetical, and past performance is not indicative of future results. Trading and investing involve high risk, including the potential loss of principal, and may not be suitable for all individuals. Before making any trading decisions, please consult with a qualified financial professional to understand the risks involved.
By using this script, you acknowledge and agree that any trading decisions are made solely at your discretion and risk.
This indicator is inspired by the Super 6x Indicators: RSI, MACD, Stochastic, Loxxer, CCI, and Velocity . A special thanks to Loxx for their relentless effort, creativity, and contributions to the TradingView community, which served as a foundation for this work.
Happy trading and best regards
Chervolino

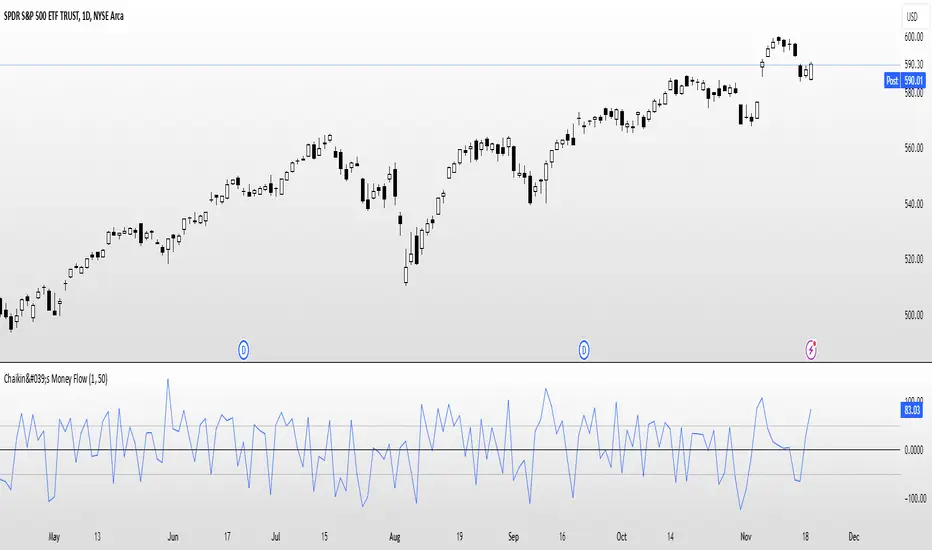
Chaikin's Money FlowOverview : Chaikin's Money Flow (CMF) is a momentum indicator that measures the buying and selling pressure of a financial instrument over a specified period. By incorporating both price and volume, CMF provides a comprehensive view of market sentiment, helping traders identify potential trend reversals and confirm the strength of existing trends.
Key Features:
Volume-Weighted : Unlike price-only indicators, CMF accounts for trading volume, offering deeper insights into the forces driving price movements.
Oscillatory Nature : CMF oscillates between positive and negative values, typically ranging from -100 to +100, indicating the balance between buying and selling pressure.
Trend Confirmation : Positive CMF values suggest accumulating buying pressure, while negative values indicate distributing selling pressure. This aids in confirming the direction and strength of trends.
Calculation Details :
Intraday Intensity (II) = 100 × (2×Close−High−Low) / (High−Low) × Volume
Condition: If High=Low, II is set to 0 to prevent division by zero.
II_smoothed = SMA(II, lookback)
Applies a Simple Moving Average (SMA) to the Intraday Intensity over the defined lookback period to smooth out short-term fluctuations.
Volume Smoothing:
V_smoothed = EMA(Volume, Volume Smoothing Period)
Utilizes an Exponential Moving Average (EMA) to smooth the volume over the specified smoothing period, giving more weight to recent data.
Money Flow Calculation:
Money Flow = II_smoothed / V_smoothed
Condition: If Vsmoothed=0Vsmoothed=0, Money Flow is set to 0 to avoid division by zero.
Usage Instructions:
Parameters Configuration:
Lookback Period: Determines the number of periods over which Intraday Intensity is averaged. A higher value results in a smoother indicator, reducing sensitivity to short-term price movements.
Volume Smoothing Period: Defines the period for the EMA applied to Volume. Adjusting this parameter affects the responsiveness of the Money Flow indicator to changes in trading volume.
Interpreting the Indicator:
Positive Values (>0): Indicate buying pressure. The higher the value, the stronger the buying interest.
Negative Values (<0): Signal selling pressure. The lower the value, the more intense the selling activity.
Crossovers: Watch for Money Flow crossing above the zero line as potential buy signals and crossing below as potential sell signals.
Divergence: Identify divergences between Money Flow and price movements to anticipate possible trend reversals.
Complementary Analysis:
Confluence with Other Indicators: Use CMF in conjunction with trend indicators like Moving Averages or oscillators like RSI to enhance signal reliability.
Volume Confirmation: CMF's volume-weighted approach makes it a powerful tool for confirming the validity of price trends and breakouts.
Acknowledgment: This implementation of Chaikin's Money Flow Indicator is inspired by and derived from the methodologies presented in "Statistically Sound Indicators" by Timothy Masters. The indicator has been meticulously translated to Pine Script to maintain the statistical integrity and effectiveness outlined in the source material.
Disclaimer: The Chaikin's Money Flow Indicator is a tool designed to assist in trading decisions. It does not guarantee profits and should be used in conjunction with other analysis methods. Trading involves risk, and it's essential to perform thorough testing and validation before deploying any indicator in live trading environments.
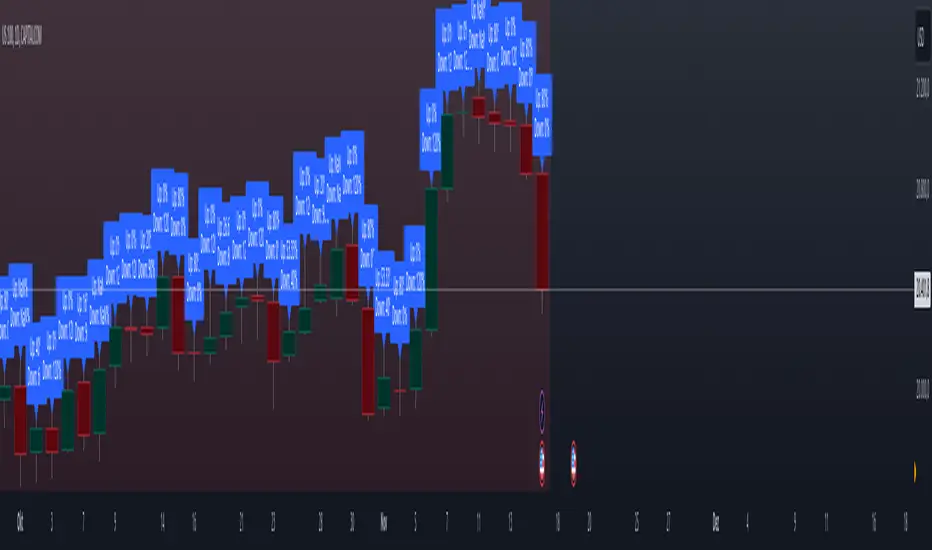
Previous High and Low Count with Probabilities + Risk On/Off1. Purpose of the Script:
This trading script combines two important concepts:
Previous High and Low Count: It tracks whether the current price exceeds the previous day’s high or low and calculates probabilities for the next price movement (up or down).
Risk On / Risk Off Indicator: It evaluates market sentiment through various indicators (such as the Fear & Greed Index, VIX, and others) and shows whether the market is in a risk-on or risk-off state. This information impacts the probabilities of price movement.
2. How it Works:
Previous High and Low:
The script tracks how often the price exceeds the previous day’s high or low and calculates the probability of an upward or downward movement based on that. This gives you an idea of how often the market reacts at the previous day's high or low.
Risk On / Risk Off:
Based on various market factors (Fear & Greed Index, VIX, Put-Call Ratio, etc.), the script calculates the Risk On or Risk Off state.
In Risk On, the probability of an upward movement increases, and the probability of a downward movement decreases. In Risk Off, it’s the opposite.
Adjusted Probabilities:
The probabilities for an Up or Down movement are adjusted based on the current Risk On / Risk Off state. In a Risk On environment, the probability for an upward move increases, while in a Risk Off environment, the probability for a downward move increases.
3. How to Use the Script:
Add the Script in TradingView:
TradingView:
Click on "Add to Chart" to apply the script to your chart.
Manual Input of Indicators:
For the Fear & Greed Index, VIX, and other indicators, you need to manually enter the current values. You can get these values from various publicly available sources:
Fear & Greed Index: CNN Fear & Greed Index
VIX (Volatility Index): VIX Index
Other indicators like Put-Call Ratio, Bitcoin Volatility, Oil Prices, and US Dollar Index can also be manually inputted, and they can be found on finance websites like Yahoo Finance, MarketWatch, and Bloomberg.
Observe the Colors and Symbols:
If the market is in a Risk On state, the background will turn green, and a green triangle will appear below the candle.
If the market is in a Risk Off state, the background will turn red, and a red triangle will appear above the candle.
Track the Probabilities:
A label will appear on the chart showing the calculated probabilities for Up and Down movements. These probabilities are adjusted based on the current market state (Risk On/Off).
4. Meaning of the Probabilities:
Up Probability: Indicates the probability that the price will rise.
Down Probability: Indicates the probability that the price will fall.
The probabilities are dynamic and adjust based on the Risk On / Risk Off state, helping you make better decisions based on the current market conditions.
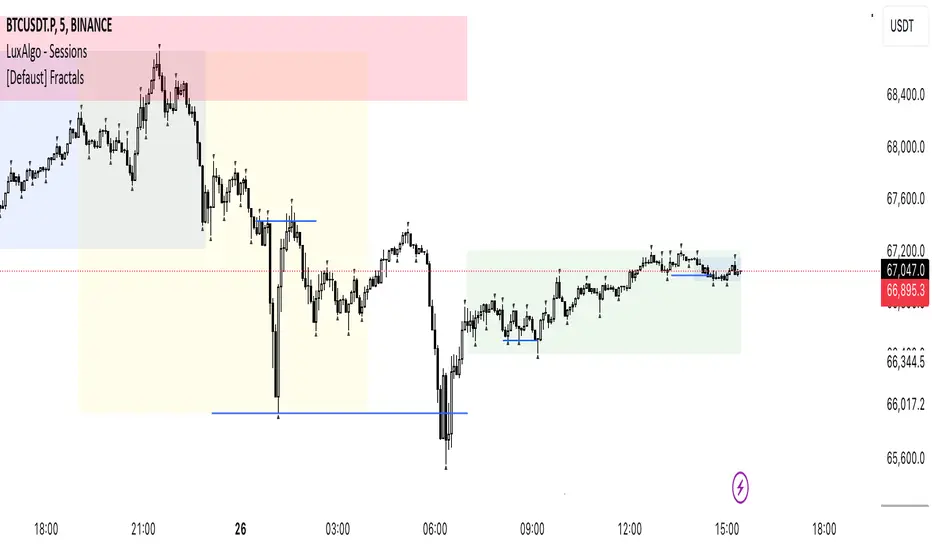
[Defaust] Fractals Fractals Indicator
Overview
The Fractals Indicator is a technical analysis tool designed to help traders identify potential reversal points in the market by detecting fractal patterns. This indicator is a fork of the original fractals indicator, with adjustments made to the plotting for enhanced visual clarity and usability.
What Are Fractals?
In trading, a fractal is a pattern consisting of five consecutive bars (candlesticks) that meet specific conditions:
Up Fractal (Potential Sell Signal): Occurs when a high point is surrounded by two lower highs on each side.
Down Fractal (Potential Buy Signal): Occurs when a low point is surrounded by two higher lows on each side.
Fractals help traders identify potential tops and bottoms in the market, signaling possible entry or exit points.
Features of the Indicator
Customizable Periods (n): Allows you to define the number of periods to consider when detecting fractals, offering flexibility to adapt to different trading strategies and timeframes.
Enhanced Plotting Adjustments: This fork introduces adjustments to the plotting of fractal signals for better visual representation on the chart.
Visual Signals: Plots up and down triangles on the chart to signify down fractals (potential bullish signals) and up fractals (potential bearish signals), respectively.
Overlay on Chart: The fractal signals are overlaid directly on the price chart for immediate visualization.
Adjustable Precision: You can set the precision of the plotted values according to your needs.
Pine Script Code Explanation
Below is the Pine Script code for the Fractals Indicator:
//@version=5 indicator(" Fractals", shorttitle=" Fractals", format=format.price, precision=0, overlay=true)
// User input for the number of periods to consider for fractal detection n = input.int(title="Periods", defval=2, minval=2)
// Initialize flags for up fractal detection bool upflagDownFrontier = true bool upflagUpFrontier0 = true bool upflagUpFrontier1 = true bool upflagUpFrontier2 = true bool upflagUpFrontier3 = true bool upflagUpFrontier4 = true
// Loop through previous and future bars to check conditions for up fractals for i = 1 to n // Check if the highs of previous bars are less than the current bar's high upflagDownFrontier := upflagDownFrontier and (high < high ) // Check various conditions for future bars upflagUpFrontier0 := upflagUpFrontier0 and (high < high ) upflagUpFrontier1 := upflagUpFrontier1 and (high <= high and high < high ) upflagUpFrontier2 := upflagUpFrontier2 and (high <= high and high <= high and high < high ) upflagUpFrontier3 := upflagUpFrontier3 and (high <= high and high <= high and high <= high and high < high ) upflagUpFrontier4 := upflagUpFrontier4 and (high <= high and high <= high and high <= high and high <= high and high < high )
// Combine the flags to determine if an up fractal exists flagUpFrontier = upflagUpFrontier0 or upflagUpFrontier1 or upflagUpFrontier2 or upflagUpFrontier3 or upflagUpFrontier4 upFractal = (upflagDownFrontier and flagUpFrontier)
// Initialize flags for down fractal detection bool downflagDownFrontier = true bool downflagUpFrontier0 = true bool downflagUpFrontier1 = true bool downflagUpFrontier2 = true bool downflagUpFrontier3 = true bool downflagUpFrontier4 = true
// Loop through previous and future bars to check conditions for down fractals for i = 1 to n // Check if the lows of previous bars are greater than the current bar's low downflagDownFrontier := downflagDownFrontier and (low > low ) // Check various conditions for future bars downflagUpFrontier0 := downflagUpFrontier0 and (low > low ) downflagUpFrontier1 := downflagUpFrontier1 and (low >= low and low > low ) downflagUpFrontier2 := downflagUpFrontier2 and (low >= low and low >= low and low > low ) downflagUpFrontier3 := downflagUpFrontier3 and (low >= low and low >= low and low >= low and low > low ) downflagUpFrontier4 := downflagUpFrontier4 and (low >= low and low >= low and low >= low and low >= low and low > low )
// Combine the flags to determine if a down fractal exists flagDownFrontier = downflagUpFrontier0 or downflagUpFrontier1 or downflagUpFrontier2 or downflagUpFrontier3 or downflagUpFrontier4 downFractal = (downflagDownFrontier and flagDownFrontier)
// Plot the fractal symbols on the chart with adjusted plotting plotshape(downFractal, style=shape.triangleup, location=location.belowbar, offset=-n, color=color.gray, size=size.auto) plotshape(upFractal, style=shape.triangledown, location=location.abovebar, offset=-n, color=color.gray, size=size.auto)
Explanation:
Input Parameter (n): Sets the number of periods for fractal detection. The default value is 2, and it must be at least 2 to ensure valid fractal patterns.
Flag Initialization: Boolean variables are used to store intermediate conditions during fractal detection.
Loops: Iterate through the specified number of periods to evaluate the conditions for fractal formation.
Conditions:
Up Fractals: Checks if the current high is greater than previous highs and if future highs are lower or equal to the current high.
Down Fractals: Checks if the current low is lower than previous lows and if future lows are higher or equal to the current low.
Flag Combination: Logical and and or operations are used to combine the flags and determine if a fractal exists.
Adjusted Plotting:
The plotting of fractal symbols has been adjusted for better alignment and visual clarity.
The offset parameter is set to -n to align the plotted symbols with the correct bars.
The color and size have been fine-tuned for better visibility.
How to Use the Indicator
Adding the Indicator to Your Chart
Open TradingView:
Go to TradingView.
Access the Chart:
Click on "Chart" to open the main charting interface.
Add the Indicator:
Click on the "Indicators" button at the top.
Search for " Fractals".
Select the indicator from the list to add it to your chart.
Configuring the Indicator
Periods (n):
Default value is 2.
Adjust this parameter based on your preferred timeframe and sensitivity.
A higher value of n considers more bars for fractal detection, potentially reducing the number of signals but increasing their significance.
Interpreting the Signals
– Up Fractal (Downward Triangle): Indicates a potential price reversal to the downside. May be used as a signal to consider exiting long positions or tightening stop-loss orders.
– Down Fractal (Upward Triangle): Indicates a potential price reversal to the upside. May be used as a signal to consider entering long positions or setting stop-loss orders for short positions.
Trading Strategy Suggestions
Up Fractal Detection:
The high of the current bar (n) is higher than the highs of the previous two bars (n - 1, n - 2).
The highs of the next bars meet certain conditions to confirm the fractal pattern.
An up fractal symbol (downward triangle) is plotted above the bar at position n - n (due to the offset).
Down Fractal Detection:
The low of the current bar (n) is lower than the lows of the previous two bars (n - 1, n - 2).
The lows of the next bars meet certain conditions to confirm the fractal pattern.
A down fractal symbol (upward triangle) is plotted below the bar at position n - n.
Benefits of Using the Fractals Indicator
Early Signals: Helps in identifying potential reversal points in price movements.
Customizable Sensitivity: Adjusting the n parameter allows you to fine-tune the indicator based on different market conditions.
Enhanced Visuals: Adjustments to plotting improve the clarity and readability of fractal signals on the chart.
Limitations and Considerations
Lagging Indicator: Fractals require future bars to confirm the pattern, which may introduce a delay in the signals.
False Signals: In volatile or ranging markets, fractals may produce false signals. It's advisable to use them in conjunction with other analysis tools.
Not a Standalone Tool: Fractals should be part of a broader trading strategy that includes other indicators and fundamental analysis.
Best Practices for Using This Indicator
Combine with Other Indicators: Use in combination with trend indicators, oscillators, or volume analysis to confirm signals.
Backtesting: Before applying the indicator in live trading, backtest it on historical data to understand its performance.
Adjust Periods Accordingly: Experiment with different values of n to find the optimal setting for the specific asset and timeframe you are trading.
Disclaimer
The Fractals Indicator is intended for educational and informational purposes only. Trading involves significant risk, and you should be aware of the risks involved before proceeding. Past performance is not indicative of future results. Always conduct your own analysis and consult with a professional financial advisor before making any investment decisions.
Credits
This indicator is a fork of the original fractals indicator, with adjustments made to the plotting for improved visual representation. It is based on standard fractal patterns commonly used in technical analysis and has been developed to provide traders with an effective tool for detecting potential reversal points in the market.
Post-Open Long Strategy with ATR-based Stop Loss and Take ProfitThe "Post-Open Long Strategy with ATR-Based Stop Loss and Take Profit" is designed to identify buying opportunities after the German and US markets open. It combines various technical indicators to filter entry signals, focusing on breakout moments following price lateralization periods.
Key Components and Their Interaction:
Bollinger Bands (BB):
Description: Uses BB with a 14-period length and standard deviation multiplier of 1.5, creating narrower bands for lower timeframes.
Role in the Strategy: Identifies low volatility phases (lateralization). The lateralization condition is met when the price is near the simple moving average of the BB, suggesting an imminent increase in volatility.
Exponential Moving Averages (EMA):
10-period EMA: Quickly detects short-term trend direction.
200-period EMA: Filters long-term trends, ensuring entries occur in a bullish market.
Interaction: Positions are entered only if the price is above both EMAs, indicating a consolidated positive trend.
Relative Strength Index (RSI):
Description: 7-period RSI with a threshold above 30.
Role in the Strategy: Confirms the market is not oversold, supporting the validity of the buy signal.
Average Directional Index (ADX):
Description: 7-period ADX with 7-period smoothing and a threshold above 10.
Role in the Strategy: Assesses trend strength. An ADX above 10 indicates sufficient momentum to justify entry.
Average True Range (ATR) for Dynamic Stop Loss and Take Profit:
Description: 14-period ATR with multipliers of 2.0 for Stop Loss and 4.0 for Take Profit.
Role in the Strategy: Adjusts exit levels based on current volatility, enhancing risk management.
Resistance Identification and Breakout:
Description: Analyzes the highs of the last 20 candles to identify resistance levels with at least two touches.
Role in the Strategy: A breakout above this level signals a potential continuation of the bullish trend.
Time Filters and Market Conditions:
Trading Hours: Operates only during the opening of the German market (8:00 - 12:00) and US market (15:30 - 19:00).
Panic Candle: The current candle must close negative, leveraging potential emotional reactions in the market.
Avoiding Entry During Pullbacks:
Description: Checks that the two previous candles are not both bearish.
Role in the Strategy: Avoids entering during a potential pullback, improving trade success probability.
Post-Open Long Strategy with ATR-Based Stop Loss and Take Profit
The "Post-Open Long Strategy with ATR-Based Stop Loss and Take Profit" is designed to identify buying opportunities after the German and US markets open. It combines various technical indicators to filter entry signals, focusing on breakout moments following price lateralization periods.
Key Components and Their Interaction:
Bollinger Bands (BB):
Description: Uses BB with a 14-period length and standard deviation multiplier of 1.5, creating narrower bands for lower timeframes.
Role in the Strategy: Identifies low volatility phases (lateralization). The lateralization condition is met when the price is near the simple moving average of the BB, suggesting an imminent increase in volatility.
Exponential Moving Averages (EMA):
10-period EMA: Quickly detects short-term trend direction.
200-period EMA: Filters long-term trends, ensuring entries occur in a bullish market.
Interaction: Positions are entered only if the price is above both EMAs, indicating a consolidated positive trend.
Relative Strength Index (RSI):
Description: 7-period RSI with a threshold above 30.
Role in the Strategy: Confirms the market is not oversold, supporting the validity of the buy signal.
Average Directional Index (ADX):
Description: 7-period ADX with 7-period smoothing and a threshold above 10.
Role in the Strategy: Assesses trend strength. An ADX above 10 indicates sufficient momentum to justify entry.
Average True Range (ATR) for Dynamic Stop Loss and Take Profit:
Description: 14-period ATR with multipliers of 2.0 for Stop Loss and 4.0 for Take Profit.
Role in the Strategy: Adjusts exit levels based on current volatility, enhancing risk management.
Resistance Identification and Breakout:
Description: Analyzes the highs of the last 20 candles to identify resistance levels with at least two touches.
Role in the Strategy: A breakout above this level signals a potential continuation of the bullish trend.
Time Filters and Market Conditions:
Trading Hours: Operates only during the opening of the German market (8:00 - 12:00) and US market (15:30 - 19:00).
Panic Candle: The current candle must close negative, leveraging potential emotional reactions in the market.
Avoiding Entry During Pullbacks:
Description: Checks that the two previous candles are not both bearish.
Role in the Strategy: Avoids entering during a potential pullback, improving trade success probability.
Entry and Exit Conditions:
Long Entry:
The price breaks above the identified resistance.
The market is in a lateralization phase with low volatility.
The price is above the 10 and 200-period EMAs.
RSI is above 30, and ADX is above 10.
No short-term downtrend is detected.
The last two candles are not both bearish.
The current candle is a "panic candle" (negative close).
Order Execution: The order is executed at the close of the candle that meets all conditions.
Exit from Position:
Dynamic Stop Loss: Set at 2 times the ATR below the entry price.
Dynamic Take Profit: Set at 4 times the ATR above the entry price.
The position is automatically closed upon reaching the Stop Loss or Take Profit.
How to Use the Strategy:
Application on Volatile Instruments:
Ideal for financial instruments that show significant volatility during the target market opening hours, such as indices or major forex pairs.
Recommended Timeframes:
Intraday timeframes, such as 5 or 15 minutes, to capture significant post-open moves.
Parameter Customization:
The default parameters are optimized but can be adjusted based on individual preferences and the instrument analyzed.
Backtesting and Optimization:
Backtesting is recommended to evaluate performance and make adjustments if necessary.
Risk Management:
Ensure position sizing respects risk management rules, avoiding risking more than 1-2% of capital per trade.
Originality and Benefits of the Strategy:
Unique Combination of Indicators: Integrates various technical metrics to filter signals, reducing false positives.
Volatility Adaptability: The use of ATR for Stop Loss and Take Profit allows the strategy to adapt to real-time market conditions.
Focus on Post-Lateralization Breakout: Aims to capitalize on significant moves following consolidation periods, often associated with strong directional trends.
Important Notes:
Commissions and Slippage: Include commissions and slippage in settings for more realistic simulations.
Capital Size: Use a realistic trading capital for the average user.
Number of Trades: Ensure backtesting covers a sufficient number of trades to validate the strategy (ideally more than 100 trades).
Warning: Past results do not guarantee future performance. The strategy should be used as part of a comprehensive trading approach.
With this strategy, traders can identify and exploit specific market opportunities supported by a robust set of technical indicators and filters, potentially enhancing their trading decisions during key times of the day.

Enhanced Local Polynomial Regression [Yosiet]Local Polynomial Regression (LPR) is an advanced statistical method that offers a flexible approach to estimating the underlying trend in financial time series data.
The Mathematical Explanation
The core idea of LPR is to fit a polynomial of degree p at each point x using weighted least squares. The weight of each data point decreases with its distance from x, controlled by a kernel function and a bandwidth parameter.
The general form of the local polynomial estimator is:
β̂(x) = argmin Σ K((Xi - x) / h) (Yi - β0 - β1(Xi - x) - ... - βp(Xi - x)^p)^2
Where:
β̂(x) is the vector of estimated coefficients
K is the kernel function
h is the bandwidth
Xi and Yi are the predictor and response variables
p is the degree of the polynomial
Our implementation uses the Epanechnikov kernel:
K(u) = 3/4 * (1 - u^2) for |u| ≤ 1, 0 otherwise
The Implementation
This script implements LPR for the easier way to interpret its values with the following key components:
Input Parameters: Can adjust the lookback period, bandwidth, and polynomial degree.
Kernel Function: The Epanechnikov kernel is used for weighting.
LPR Function: Implements the core algorithm using matrix operations.
Signal Generation: Generates buy/sell signals based on crossovers of smoothed price and LPR results.
How to Use
Apply the indicator to your chart in TradingView.
Adjust the input parameters:
Lookback Period: Controls how many past bars are considered.
Bandwidth: Affects the smoothness of the regression line.
Polynomial Degree: Determines the complexity of the local fit.
Signal Smoothing Length: Adjusts the responsiveness of buy/sell signals.
Monitor buy/sell signals for potential trade entries.
Limitations
Sensitivity to Parameters: The choice of bandwidth and polynomial degree significantly impacts the results.
Lag: Like all trend-following indicators, LPR may lag behind rapid price movements.
Edge Effects: The indicator may be less reliable at the edges of the data (recent bars).
Recommendations
Parameter Optimization: Experiment with different lookback periods, bandwidths, and polynomial degrees to find the best fit for your trading style and timeframe.
Combine with Other Indicators: Use LPR in conjunction with momentum oscillators or volume indicators for confirmation.
Multiple Timeframes: Apply LPR on different timeframes to gain a more comprehensive view of the trend.
Avoid Overfitting: Be cautious of using high polynomial degrees, as they may lead to overfitting on historical data.
Consider Market Conditions: LPR works best in trending markets; be aware of its limitations in ranging or highly volatile conditions.
Backtest Thoroughly: Always backtest strategies based on LPR across different market conditions before live trading.
Conclusion
Local Polynomial Regression offers a sophisticated approach to trend analysis in financial markets. By providing a flexible, adaptive trend line, it can help traders identify potential entry and exit points with greater precision than traditional moving averages. However, like all technical indicators, it should be used as part of a comprehensive trading strategy that includes proper risk management and consideration of fundamental factors.
if you have an strategy or idea and need to make it real through an indicator or trading bot, you can DM or comment

Entropy Indicator [CHE]Entropy in Technical Analysis Using TradingView
Slide 1: Title
Entropy in Technical Analysis Using TradingView
Introduction to the concept of entropy
Application in technical analysis
Understanding the use of entropy as a market indicator
Slide 2: What is Entropy?
Definition and Origins:
Entropy originates from thermodynamics and information theory.
In thermodynamics, entropy describes the degree of disorder or randomness in a system.
In information theory, entropy quantifies the uncertainty or unpredictability of information content.
Mathematical Definition:
Entropy measures the unpredictability of a system.
The basic idea: Higher entropy means more randomness; lower entropy indicates more predictability.
Formula: Entropy is calculated using the probabilities of different outcomes, based on how frequently certain price levels are reached.
Slide 3: Entropy in Financial Markets
Why Entropy Matters:
Market Uncertainty: Entropy can measure the level of uncertainty or randomness in financial markets.
Volatility Indicator: High entropy may indicate a volatile, unpredictable market, while low entropy suggests a stable, predictable market.
Applications in Trading:
Trend Analysis: Identifying periods of high entropy can help detect potential trend reversals or periods of market consolidation.
Risk Management: Using entropy to adjust trading strategies based on the perceived level of market uncertainty.
Slide 4: How Entropy is Calculated in Trading
Step-by-Step Process:
Data Collection:
The first step is to gather the relevant price data over a specific period, such as 200 closing prices. This data forms the basis of the entropy calculation, representing the market's recent behavior.
Defining Bins:
The price range within the collected data is divided into a fixed number of bins or intervals. These bins represent different price levels. For instance, if you choose 5 bins, the price range will be split into 5 equal segments.
Assigning Data to Bins:
The next step is to assign each price within the data to one of these bins. This step helps in understanding how frequently the price falls within specific ranges, indicating the distribution of prices over the period.
Calculating Probabilities:
After assigning the data to bins, calculate the probability for each bin by dividing the number of data points in each bin by the total number of data points. These probabilities reflect how often prices fall into each range.
Computing Entropy:
Entropy is then calculated based on the distribution of these probabilities. The formula involves summing the products of each probability and the logarithm of that probability. This calculation tells us how evenly the prices are distributed across the bins.
Interpretation for Traders:
High entropy indicates that the prices are spread evenly across the bins, suggesting a highly random and uncertain market. Low entropy, on the other hand, shows that prices are concentrated in fewer bins, indicating more predictable and stable market conditions.
Slide 5: Implementing and Using Entropy in TradingView
How It Works in TradingView:
Data Period: Typically, entropy is calculated over a specific number of bars (e.g., 200), representing recent market activity. The longer the period, the broader the market behavior considered.
Bin Division: The price range during this period is divided into a set number of bins. These bins help to categorize price levels and assess how spread out the market’s activity is.
Entropy Calculation: The indicator evaluates the spread of prices across these bins to determine the level of market disorder. This is visualized on the chart as an entropy line, helping traders to see fluctuations in market uncertainty.
Practical Application:
As a trader, you can use the entropy indicator to gauge when the market is in a state of high uncertainty (high entropy) or low uncertainty (low entropy). This insight can inform decisions on when to take riskier trades or when to stay conservative.
Slide 6: Interpreting the Entropy Indicator
High Entropy:
Characteristics:
Indicates a high level of market disorder, where price movements are more random and less predictable.
Suggests volatile or unpredictable market conditions.
Implications for Traders:
During periods of high entropy, traders might need to exercise greater caution, reduce position sizes, or employ more defensive trading strategies.
High entropy could signal potential trend reversals or significant market movements, making it a critical period to watch closely.
Low Entropy:
Characteristics:
Suggests that the market is more predictable, with prices showing less variation and more consistent trends.
Typically associated with trending markets where price movement is more orderly.
Implications for Traders:
In a low entropy environment, traders might favor trend-following strategies, as the market shows clearer directional movement.
Low entropy can also suggest more reliable trading opportunities, where the risk of sudden, unpredictable price swings is reduced.
Slide 7: Use Cases and Strategy Integration
Practical Use Cases:
Trend Reversals: Use entropy to identify potential points where a market may shift from trending to consolidating, or vice versa. A sudden increase in entropy might indicate the end of a stable trend and the start of a more volatile period.
Volatility Detection: Detect periods of increased market volatility by observing spikes in entropy. These periods can be critical for adjusting your trading strategy, either by scaling back or by taking advantage of the increased movement.
Strategy Integration:
Risk Management: Incorporate entropy into your risk management strategy by adjusting position sizes, leverage, or stop-loss levels based on the current entropy reading. In high entropy conditions, it might be wise to take smaller, more conservative positions.
Combining Indicators: Entropy can be effectively combined with other indicators, such as moving averages or RSI, to provide a more comprehensive view of market conditions. For example, using entropy alongside a trend indicator can help confirm whether a trend is strong and likely to continue, or if it's weakening and at risk of reversal.
Slide 8: Advantages and Limitations of Entropy
Advantages:
Unique Perspective: Entropy offers a unique way to measure market uncertainty that complements traditional volatility measures. It provides traders with insights into the randomness and predictability of price movements, which can be crucial for strategic decision-making.
Dynamic Analysis: Entropy adapts to changes in market conditions, offering real-time insights into the level of market disorder. This makes it a valuable tool for traders who need to stay responsive to the market's evolving dynamics.
Limitations:
Complex Interpretation: Unlike more straightforward indicators, entropy requires a deeper understanding to interpret correctly. Traders need to be familiar with how entropy levels relate to market behavior and what actions to take in response.
Sensitivity to Parameters: The results can vary significantly depending on the number of bins and the data period chosen, requiring careful parameter selection. Traders may need to experiment with different settings to find the most informative configuration for their specific market or trading style.
Slide 9: Conclusion
Key Takeaways:
Entropy as a Tool: Provides a unique perspective on market dynamics by measuring unpredictability. This can help traders better understand the nature of market conditions and tailor their strategies accordingly.
Practical Application: Can enhance trading strategies, particularly in volatile markets, by helping to identify periods of high uncertainty and adjusting risk management practices.
Further Exploration: Experimenting with different bin sizes and periods can help fine-tune the entropy indicator for specific markets and trading strategies. Traders are encouraged to combine entropy with other indicators to build a more robust trading framework.
Final Thoughts:
Entropy is a powerful concept that, when applied correctly, can offer valuable insights into market behavior. It should be used in conjunction with other tools and indicators to make informed trading decisions, particularly in markets where unpredictability plays a significant role.
This presentation provides a comprehensive overview of entropy, its significance in financial markets, and how it can be practically applied as an indicator in TradingView. The focus is on how traders can use entropy to enhance their trading strategies and improve their understanding of market conditions.
Best regards
Chervolino

Uptrick: Adaptive Trend Strength Index (ATSI)### **Adaptive Trend Strength Index (ATSI): Trend Detection Tool**
---
### Introduction
The **Adaptive Trend Strength Index (ATSI)** is a state-of-the-art indicator designed to offer traders an unparalleled view into market trends. By combining the principles of adaptive trend analysis with advanced volatility filtering, ATSI provides a powerful and visually intuitive method for identifying and following market trends. Its unique algorithm and customizable features make it an essential tool for traders across all markets—whether you're trading stocks, forex, commodities, or cryptocurrencies.
### The Purpose and Design Philosophy
At its core, the ATSI was built with the understanding that financial markets are dynamic, ever-changing entities influenced by a multitude of factors, including market sentiment, economic data, geopolitical events, and, critically, volatility. Traditional trend indicators often fall short by either over-smoothing price data (thus lagging behind the actual trend) or reacting too quickly to minor price fluctuations, resulting in false signals.
**ATSI solves this dilemma by adapting to market conditions in real-time.** It effectively filters out market noise while being sensitive enough to detect meaningful shifts in trend direction. The result is a trend line that is both responsive and smooth, providing traders with a clear, actionable view of the market's current trajectory.
### Key Features and Functionality
#### 1. **Adaptive Trend Calculation**
The heart of ATSI is its adaptive trend algorithm, which adjusts based on market conditions. It leverages a combination of price action analysis and volatility filtering to determine the strength and direction of the trend. Here’s how it works:
- **Volatility Sensitivity:** ATSI incorporates the Average True Range (ATR) to measure market volatility. This volatility measure is then adjusted by a user-defined sensitivity factor. This ensures that the indicator responds dynamically to different market environments—be it high-volatility breakouts or low-volatility consolidations.
- **Adaptive Smoothing:** The trend calculation is further enhanced by an exponential moving average (EMA) applied not just to the raw price data, but also to the resulting trend line itself. This dual-layer smoothing process helps to eliminate noise, resulting in a cleaner and more reliable trend line.
- **Real-Time Adaptation:** Unlike rigid indicators that require constant tweaking to stay relevant in changing market conditions, ATSI adapts in real-time. This adaptability makes it particularly valuable in fast-moving markets where conditions can change rapidly.
#### 2. **Visual Clarity**
In trading, visual clarity can make the difference between spotting a lucrative trend and missing out. ATSI excels in this regard by offering a clear, color-coded trend line that provides instant feedback on market conditions:
- **Thicker and Smoother Line:** ATSI’s trend line is designed to be visually prominent. By default, it is thicker than most standard indicators, making it easy to spot even in dense charts. Additionally, the smoothing applied to the line ensures that it flows smoothly, avoiding the jagged, noisy appearance that can plague other indicators.
- **Color-Coded Trends:** The trend line changes color based on the direction and strength of the trend:
- **Green Line**: Indicates a bullish trend, suggesting upward momentum in the market.
- **Red Line**: Indicates a bearish trend, signaling downward momentum.
- **Gold Line**: Represents a neutral or weak trend, where the market is consolidating or where there is no clear direction.
This color-coding is not just for aesthetics—it’s a critical feature that allows traders to quickly assess market conditions at a glance.
#### 3. **Customizable Parameters**
ATSI is built with the understanding that every trader’s strategy is unique. Whether you’re a day trader looking for short-term trends or a swing trader interested in catching longer moves, ATSI can be tailored to fit your needs:
- **Trend Length:** The length parameter controls how much historical data is considered in the trend calculation. A shorter length will make the indicator more sensitive to recent price changes, while a longer length will smooth out short-term fluctuations, focusing on the broader trend.
- **Smoothing Factor:** This parameter controls the level of smoothing applied to the trend line. A higher smoothing factor will result in a smoother, more stable trend line, while a lower factor will make the line more responsive to quick changes in price.
- **Volatility Sensitivity:** By adjusting the volatility sensitivity, you can control how reactive the indicator is to market volatility. A higher sensitivity makes the indicator more likely to detect trends in volatile markets, while a lower sensitivity helps to filter out noise in calmer markets.
- **Line Width:** ATSI allows you to adjust the thickness of the trend line, ensuring that it stands out on your chart. This is particularly useful when trading on charts with a lot of overlays or when you need a clear, bold line to guide your trading decisions.
- **Color Customization:** The colors for bullish, bearish, and neutral trends can be fully customized to match your personal preferences or to integrate seamlessly with your existing chart setup.
### Practical Applications
ATSI is a versatile indicator that can be applied to a wide range of trading strategies. Here’s how it can enhance your trading:
#### 1. **Trend Following**
For traders who thrive on catching and riding trends, ATSI is a game-changer. Its adaptive nature ensures that you stay in the trend for as long as possible without being shaken out by minor fluctuations. The clear color-coded line makes it easy to identify when a trend starts and ends, providing clear entry and exit signals.
#### 2. **Risk Management**
One of the biggest challenges in trading is managing risk, particularly in volatile markets. ATSI’s volatility sensitivity feature helps traders adjust their strategies based on current market conditions. For example, in a high-volatility environment, the indicator will become more sensitive, allowing you to tighten your stop losses or take profits earlier. Conversely, in a low-volatility market, the indicator will smooth out minor fluctuations, reducing the risk of being stopped out prematurely.
#### 3. **Trend Reversals and Consolidations**
ATSI is also highly effective in identifying trend reversals and periods of consolidation. The neutral (gold) line indicates periods where the market is undecided, which can often precede significant moves. Recognizing these periods can help you avoid getting caught in choppy markets and position yourself for the next big move.
#### 4. **Market Timing**
Timing the market is often seen as the holy grail of trading. While no indicator can predict the future with 100% accuracy, ATSI’s real-time adaptation gives you a significant edge. By responding to changes in market conditions as they happen, ATSI helps you make timely decisions, whether you’re entering a trade, exiting a position, or adjusting your risk parameters.
### Comparative Advantage
What sets ATSI apart from other trend indicators is its combination of adaptability, visual clarity, and ease of use:
- **Adaptability:** Most trend indicators are static—they apply the same calculations regardless of market conditions. ATSI, however, adapts to the market in real-time, ensuring that it remains relevant and reliable across different market environments.
- **Visual Clarity:** The thicker, smoother, color-coded line is not just aesthetically pleasing—it’s a functional design choice that helps you quickly interpret market conditions. Whether you’re glancing at your chart or conducting an in-depth analysis, the ATSI line stands out, providing immediate insight.
- **Ease of Use:** Despite its advanced features, ATSI is incredibly easy to use. The default settings are optimized for general use, but the indicator offers a high degree of customization for those who want to tailor it to their specific trading strategy.
### Conclusion
The **Adaptive Trend Strength Index (ATSI)** is more than just another trend indicator—it’s a comprehensive tool designed to give traders an edge in today’s fast-paced, volatile markets. By combining adaptive trend analysis with advanced volatility filtering, ATSI offers a unique blend of responsiveness and reliability. Its clear, color-coded visual representation of trends makes it easy to use, even for traders who are new to technical analysis, while its customizable parameters provide the flexibility that experienced traders demand.
Whether you’re looking to ride the next big trend, manage your risk more effectively, or simply get a clearer picture of the market’s current direction, ATSI is an invaluable addition to your trading toolkit. With its cutting-edge design and powerful functionality, ATSI is poised to become the go-to indicator for traders seeking to enhance their market analysis and improve their trading outcomes.

Multi-Step FlexiSuperTrend - Strategy [presentTrading]At the heart of this endeavor is a passion for continuous improvement in the art of trading
█ Introduction and How it is Different
The "Multi-Step FlexiSuperTrend - Strategy " is an advanced trading strategy that integrates the well-known SuperTrend indicator with a nuanced and dynamic approach to market trend analysis. Unlike conventional SuperTrend strategies that rely on static thresholds and fixed parameters, this strategy introduces multi-step take profit mechanisms that allow traders to capitalize on varying market conditions in a more controlled and systematic manner.
What sets this strategy apart is its ability to dynamically adjust to market volatility through the use of an incremental factor applied to the SuperTrend calculation. This adjustment ensures that the strategy remains responsive to both minor and major market shifts, providing a more accurate signal for entries and exits. Additionally, the integration of multi-step take profit levels offers traders the flexibility to scale out of positions, locking in profits progressively as the market moves in their favor.
BTC 6hr Long/Short Performance
█ Strategy, How it Works: Detailed Explanation
The Multi-Step FlexiSuperTrend strategy operates on the foundation of the SuperTrend indicator, but with several enhancements that make it more adaptable to varying market conditions. The key components of this strategy include the SuperTrend Polyfactor Oscillator, a dynamic normalization process, and multi-step take profit levels.
🔶 SuperTrend Polyfactor Oscillator
The SuperTrend Polyfactor Oscillator is the heart of this strategy. It is calculated by applying a series of SuperTrend calculations with varying factors, starting from a defined "Starting Factor" and incrementing by a specified "Increment Factor." The indicator length and the chosen price source (e.g., HLC3, HL2) are inputs to the oscillator.
The SuperTrend formula typically calculates an upper and lower band based on the average true range (ATR) and a multiplier (the factor). These bands determine the trend direction. In the FlexiSuperTrend strategy, the oscillator is enhanced by iteratively applying the SuperTrend calculation across different factors. The iterative process allows the strategy to capture both minor and significant trend changes.
For each iteration (indexed by `i`), the following calculations are performed:
1. ATR Calculation: The Average True Range (ATR) is calculated over the specified `indicatorLength`:
ATR_i = ATR(indicatorLength)
2. Upper and Lower Bands Calculation: The upper and lower bands are calculated using the ATR and the current factor:
Upper Band_i = hl2 + (ATR_i * Factor_i)
Lower Band_i = hl2 - (ATR_i * Factor_i)
Here, `Factor_i` starts from `startingFactor` and is incremented by `incrementFactor` in each iteration.
3. Trend Determination: The trend is determined by comparing the indicator source with the upper and lower bands:
Trend_i = 1 (uptrend) if IndicatorSource > Upper Band_i
Trend_i = 0 (downtrend) if IndicatorSource < Lower Band_i
Otherwise, the trend remains unchanged from the previous value.
4. Output Calculation: The output of each iteration is determined based on the trend:
Output_i = Lower Band_i if Trend_i = 1
Output_i = Upper Band_i if Trend_i = 0
This process is repeated for each iteration (from 0 to 19), creating a series of outputs that reflect different levels of trend sensitivity.
Local
🔶 Normalization Process
To make the oscillator values comparable across different market conditions, the deviations between the indicator source and the SuperTrend outputs are normalized. The normalization method can be one of the following:
1. Max-Min Normalization: The deviations are normalized based on the range of the deviations:
Normalized Value_i = (Deviation_i - Min Deviation) / (Max Deviation - Min Deviation)
2. Absolute Sum Normalization: The deviations are normalized based on the sum of absolute deviations:
Normalized Value_i = Deviation_i / Sum of Absolute Deviations
This normalization ensures that the oscillator values are within a consistent range, facilitating more reliable trend analysis.
For more details:
🔶 Multi-Step Take Profit Mechanism
One of the unique features of this strategy is the multi-step take profit mechanism. This allows traders to lock in profits at multiple levels as the market moves in their favor. The strategy uses three take profit levels, each defined as a percentage increase (for long trades) or decrease (for short trades) from the entry price.
1. First Take Profit Level: Calculated as a percentage increase/decrease from the entry price:
TP_Level1 = Entry Price * (1 + tp_level1 / 100) for long trades
TP_Level1 = Entry Price * (1 - tp_level1 / 100) for short trades
The strategy exits a portion of the position (defined by `tp_percent1`) when this level is reached.
2. Second Take Profit Level: Similar to the first level, but with a higher percentage:
TP_Level2 = Entry Price * (1 + tp_level2 / 100) for long trades
TP_Level2 = Entry Price * (1 - tp_level2 / 100) for short trades
The strategy exits another portion of the position (`tp_percent2`) at this level.
3. Third Take Profit Level: The final take profit level:
TP_Level3 = Entry Price * (1 + tp_level3 / 100) for long trades
TP_Level3 = Entry Price * (1 - tp_level3 / 100) for short trades
The remaining portion of the position (`tp_percent3`) is exited at this level.
This multi-step approach provides a balance between securing profits and allowing the remaining position to benefit from continued favorable market movement.
█ Trade Direction
The strategy allows traders to specify the trade direction through the `tradeDirection` input. The options are:
1. Both: The strategy will take both long and short positions based on the entry signals.
2. Long: The strategy will only take long positions.
3. Short: The strategy will only take short positions.
This flexibility enables traders to tailor the strategy to their market outlook or current trend analysis.
█ Usage
To use the Multi-Step FlexiSuperTrend strategy, traders need to set the input parameters according to their trading style and market conditions. The strategy is designed for versatility, allowing for various market environments, including trending and ranging markets.
Traders can also adjust the multi-step take profit levels and percentages to match their risk management and profit-taking preferences. For example, in highly volatile markets, traders might set wider take profit levels with smaller percentages at each level to capture larger price movements.
The normalization method and the incremental factor can be fine-tuned to adjust the sensitivity of the SuperTrend Polyfactor Oscillator, making the strategy more responsive to minor market shifts or more focused on significant trends.
█ Default Settings
The default settings of the strategy are carefully chosen to provide a balanced approach between risk management and profit potential. Here is a breakdown of the default settings and their effects on performance:
1. Indicator Length (10): This parameter controls the lookback period for the ATR calculation. A shorter length makes the strategy more sensitive to recent price movements, potentially generating more signals. A longer length smooths out the ATR, reducing sensitivity but filtering out noise.
2. Starting Factor (0.618): This is the initial multiplier used in the SuperTrend calculation. A lower starting factor makes the SuperTrend bands closer to the price, generating more frequent trend changes. A higher starting factor places the bands further away, filtering out minor fluctuations.
3. Increment Factor (0.382): This parameter controls how much the factor increases with each iteration of the SuperTrend calculation. A smaller increment factor results in more gradual changes in sensitivity, while a larger increment factor creates a wider range of sensitivity across the iterations.
4. Normalization Method (None): The default is no normalization, meaning the raw deviations are used. Normalization methods like Max-Min or Absolute Sum can make the deviations more consistent across different market conditions, improving the reliability of the oscillator.
5. Take Profit Levels (2%, 8%, 18%): These levels define the thresholds for exiting portions of the position. Lower levels (e.g., 2%) capture smaller profits quickly, while higher levels (e.g., 18%) allow positions to run longer for more significant gains.
6. Take Profit Percentages (30%, 20%, 15%): These percentages determine how much of the position is exited at each take profit level. A higher percentage at the first level locks in more profit early, reducing exposure to market reversals. Lower percentages at higher levels allow for a portion of the position to benefit from extended trends.

Entropy Volatility Index [CHE]I Entropy Volatility Index (EVI)
II An Experimental Script for Measuring Market Volatility
III Introduction
The Entropy Volatility Index (EVI) is an experimental indicator based on concepts from thermodynamics and information theory. The goal of the EVI is to quantify market uncertainty and volatility by calculating the entropy of price changes.
IV Basic Concepts
Entropy in Thermodynamics
Entropy is a measure of disorder or randomness in a system.
The second law of thermodynamics states that entropy in a closed system tends to increase over time.
Entropy in Information Theory
In information theory, entropy measures the uncertainty or information content of a random variable.
The entropy H of a random variable X with probability distribution P(x) is calculated as:
H(X) = -∑ P(x) log P(x)
V Derivation of the EVI
Calculation of Price Changes
Absolute price changes are calculated to serve as the basis for probability calculations.
Creation of the Histogram
A histogram is created and initialized to count the frequency of price changes.
Updating the Histogram
The histogram is updated by counting the frequency of each price change.
Calculation of Probabilities
The probabilities of the price changes are calculated based on their frequencies in the histogram.
Calculation of Entropy
Entropy is calculated using the probabilities of price changes. Higher entropy indicates higher uncertainty or disorder in the market.
Plotting the Indicator
The EVI is plotted to visually represent market volatility and uncertainty.
VI Interpretation of the EVI
High EVI Values
High Volatility: Strong and irregular price movements.
High Uncertainty: Increased market uncertainty.
Possible Market Turning Points: Indicators of potential trend changes.
Low EVI Values
Low Volatility: More consistent and predictable price movements.
Stability: More stable market phases.
Trend Consistency: Indicators of stable trends or sideways movements.
VII Conclusion
The Entropy Volatility Index (EVI) is an experimental script that applies concepts from thermodynamics and information theory to measure market volatility. It offers a new perspective on market uncertainty and can be used as an additional tool for traders.
VIII Example Use Cases
Identifying Volatile Phases: Use the EVI to identify periods of high volatility and prepare for potential rapid price movements.
Risk Management: Adjust your risk management strategy based on the EVI. During high EVI periods, consider hedging positions or adjusting position sizes.
Complementing Other Indicators: Combine the EVI with other technical indicators (e.g., RSI, MACD) for a more comprehensive view of market conditions.
I hope this experimental script provides valuable insights. Thank you for your feedback and suggestions for improvement.
Best regards,
Chervolino
PKJ StrategyWelcome to the Daily Price Action Mastery Strategy, a powerful approach to navigating the financial markets using the purest form of market analysis – price action. This trading view strategy is meticulously crafted for those seeking a method that harnesses the daily price movements to make informed and strategic trading decisions.
Key Features:
Daily Candlestick Analysis: Dive into the daily candlestick patterns to identify key support and resistance levels, trend reversals, and potential breakout points. The strategy leverages the valuable information encapsulated in each day's price action to discern market sentiment.
Trend Identification: Utilize trend analysis tools and indicators to pinpoint the prevailing market direction. By understanding the dynamics of daily trends, traders can align their positions with the broader market movement for higher probability trades.
Dynamic Support and Resistance: Implement dynamic support and resistance levels derived from daily price action. These levels act as crucial markers for entry and exit points, helping traders set effective stop-loss and take-profit orders.
Chart Patterns Recognition: Uncover chart patterns such as head and shoulders, flags, and triangles on the daily timeframe. The strategy incorporates pattern recognition techniques to identify potential trend continuation or reversal scenarios, offering traders a comprehensive view of market dynamics.
Volatility Analysis: Gauge market volatility by studying daily price ranges and fluctuations. Volatility indicators are integrated to help traders adjust their risk management strategies in response to varying market conditions.
Confirmation through Indicators: Supplement price action analysis with carefully selected indicators for additional confirmation signals. These indicators are chosen to align with the philosophy of the Daily Price Action Mastery Strategy, enhancing the precision of trade entries and exits.
Risk Management Guidelines: Discover effective risk management practices tailored to the daily timeframe. Learn how to optimize position sizes, set appropriate stop-loss levels, and manage capital to ensure long-term success and sustainability in your trading journey.
Whether you are a seasoned trader or a newcomer to the markets, the Daily Price Action Mastery Strategy provides a comprehensive framework to navigate the complexities of daily price movements. Elevate your trading experience by incorporating this strategy into your analysis, and empower yourself to make well-informed decisions in the dynamic world of finance.

Market Health MonitorThe Market Health Monitor is a comprehensive tool designed to assess and visualize the economic health of a market, providing traders with vital insights into both current and future market conditions. This script integrates a range of critical economic indicators, including unemployment rates, inflation, Federal Reserve funds rates, consumer confidence, and housing market indices, to form a robust understanding of the overall economic landscape.
Drawing on a variety of data sources, the Market Health Monitor employs moving averages over periods of 3, 12, 36, and 120 months, corresponding to quarterly, annual, three-year, and ten-year economic cycles. This selection of timeframes is specifically chosen to capture the nuances of economic movements across different phases, providing a balanced view that is sensitive to both immediate changes and long-term trends.
Key Features:
Economic Indicators Integration: The script synthesizes crucial economic data such as unemployment rates, inflation levels, and housing market trends, offering a multi-dimensional perspective on market health.
Adaptability to Market Conditions: The inclusion of both short-term and long-term moving averages allows the Market Health Monitor to adapt to varying market conditions, making it a versatile tool for different trading strategies.
Oscillator Thresholds for Recession and Growth: The script sets specific thresholds that, when crossed, indicate either potential economic downturns (recessions) or periods of growth (expansions), allowing traders to anticipate and react to changing market conditions proactively.
Color-Coded Visualization: The Market Health Monitor employs a color-coding system for ease of interpretation:
-- A red background signals unhealthy economic conditions, cautioning traders about potential risks.
-- A bright red background indicates a confirmed recession, as declared by the NBER, signaling a critical time for traders to reassess risk exposure.
-- A green background suggests a healthy market with expected economic expansion, pointing towards growth-oriented opportunities.
Comprehensive Market Analysis: By combining various economic indicators, the script offers a holistic view of the market, enabling traders to make well-informed decisions based on a thorough understanding of the economic environment.
Key Criteria and Parameters:
Economic Indicators:
Labor Market: The unemployment rate is a critical indicator of economic health.
High or rising unemployment indicates reduced consumer spending and economic stress.
Inflation: Key for understanding monetary policy and consumer purchasing power.
Persistent high inflation can lead to economic instability, while deflation can signal weak
demand.
Monetary Policy: Reflected by the Federal Reserve funds rate.
Changes in the rate can influence economic activity, borrowing costs, and investor
sentiment.
Consumer Confidence: A predictor of consumer spending and economic activity.
Reflects the public’s perception of the economy
Housing Market: The housing market often leads the economy into recession and recovery.
Weakness here can signal broader economic problems.
Market Data:
Stock Market Indices: Reflect overall investor sentiment and economic
expectations. No gains in a stock market could potentially indicate that economy is
slowing down.
Credit Conditions: Indicated by the tightness of bank lending, signaling risk
perception.
Commodity Insight:
Crude Oil Prices: A proxy for global economic activity.
Indicator Timeframe:
A default monthly timeframe is chosen to align with the release frequency of many economic indicators, offering a balanced view between timely data and avoiding too much noise from short-term fluctuations. Surely, it can be chosen by trader / analyst.
The Market Health Monitor is more than just a trading tool—it's a comprehensive economic guide. It's designed for traders who value an in-depth understanding of the economic climate. By offering insights into both current conditions and future trends, it encourages traders to navigate the markets with confidence, whether through turbulent times or in periods of growth. This tool doesn't just help you follow the market—it helps you understand it.

Megabar Breakout (Range & Volume & RSI)Hey there,
This strategy is based on the idea that certain events lead to what are called Megabars. Megabars are bars that have a very large range and volume. I wanted to verify whether these bars indicate the start of a trend and whether one should follow the trend.
Summary of the Code:
The code is based on three indicators: the range of the bar, the volume of the bar, and the RSI. When certain values of these indicators are met, a Megabar is identified. The direction of the Megabar indicates the direction in which we should trade.
Why do I combine these indicators?
I want to identify special bars that have the potential to mark the beginning of a breakout. Therefore, a bar needs to exhibit high volume, have a large range (huge price movement), and we also use the Relative Strength Index (RSI) to assess potential momentum. Only if all three criteria are met within one candle, do we use this as an identifier for a megabar.
Explanation of Drawings on the Chart:
As you can see, there is a green background on my chart. The green background symbolizes the time when I'm entering a trade. Only if a Megabar happens during that time, I'm ready to enter a trade. The time is between 6 AM and 4 PM CET. It's just because I prefer that time. Also, the strategy draws an error every time a Megabar happens based on VOL and Range only (not on the RSI). That makes it pretty easy to go through your chart and check the biggest bars manually. You can activate or deactivate these settings via the input data of the strategy.
When Do We Enter a Trade?
We wait for a Megabar to happen during our trading session. If the Megabar is bullish, we open a LONG trade at the opening price of the next candle. If the Megabar is bearish, we open a SHORT trade at the opening price of the next candle.
Where Do We Put Our Take Profit & Stop Loss?
The default setting is TP = 40 Pips and SL = 30 Pips. In that case, we are always trading with a risk-reward ratio of 1.33 by default. You can easily change these settings via the input data of the strategy.
Strategy Results
The criteria for Megabars were chosen by me in a way that makes Megabars something special. They are not intended to occur too frequently, as the fundamental idea of this strategy would otherwise not hold. This results in only 37 closed trades within the last 12 months. If you change the criterias for a megabar to a milder one, you will create more Megabars and therefore more trades. It's up to you. I have adapted this strategy to the 30-minute chart of the EURUSD. In the evaluation, we consider a period of 12 months, which I believe is sufficient.
My default settings for the indicators look like this:
Avg Length Vol 20
Avg Multiplier Vol 3
Avg Length Range 20
Avg Multiplier Range 4
Value SMA RSI for Long Trades 50
Value SMA RSI for Short Trades 70
IMPORTANT: The current performance overview does not display the results of these settings. Please change the settings to my default ones so that you can see how I use this strategy.
I do not recommend trading this strategy without further testing. The script is meant to reflect a basic idea and be used as a tool to identify Megabars. I have made this strategy completely public so that it can be further developed. One can take this framework and test it on different timeframes and different markets.

Philpose's Binary Turbo 1.2Hello there,
I'm thrilled to introduce my very first TradingView indicator - "Philpose's Binary Turbo 1.0." This indicator isn't just another tool; it's my unique take on binary options trading, powered by the Relative Strength Index (RSI).
Differences from Other Indicators:
This indicator is designed for traders who prefer short-term trading, as it uses a 1-minute timeframe.
It assumes that RSI crossovers of overbought and oversold levels can be used to generate binary options signals.
Users should backtest and evaluate the indicator's performance in different market conditions and consider risk management strategies.
Custom Logic: This indicator implements a custom trading logic based on RSI crossovers of overbought and oversold levels. Many indicators on TradingView use standard indicators, but this script incorporates unique logic.
Signal Tracking: It tracks and displays the last buy and sell signals on the chart. This visual representation can be helpful for traders to see when signals were generated.
Streak Tracking: The script keeps track of winning and losing streaks, which can provide traders with insights into their trading performance over time.
Table Summary: It creates a table summarizing various statistics related to the signals generated, such as total signals, wins, losses, and streaks. This tabular representation can be useful for traders to assess the indicator's performance.
How to Use:
To use this indicator effectively, follow these steps:
Add the Indicator: Copy and paste the script into TradingView's Pine Script editor. Then, apply the indicator to the chart.
Customize Parameters: Adjust the RSI parameters (period, overbought, and oversold levels) and the minimum bars between signals according to your trading strategy and preferences.
Interpret Signals: Buy signals are generated when the RSI crosses above the oversold level, and sell signals occur when it crosses below the overbought level.
Analyze Streaks: Keep an eye on the win and loss streaks to assess the indicator's performance and your trading strategy.
Review Table: The table at the top-right corner of the chart provides a summary of important statistics related to signals, wins, losses, and streaks.
Markets and Conditions:
The script can be used in various financial markets, including stocks, forex, commodities, and indices. However, it's important to note that binary options trading has a distinct risk profile and is available on certain platforms. Therefore, you should ensure that your chosen binary options platform supports TradingView indicators and that you understand the specific conditions of binary options trading.
Conditions for Use:
This indicator is designed for traders who prefer short-term trading, as it uses a 1-minute timeframe.
It assumes that RSI crossovers of overbought and oversold levels can be used to generate binary options signals.
Users should backtest and evaluate the indicator's performance in different market conditions and consider risk management strategies.
Please exercise caution when using any trading indicator or strategy, especially in binary options trading, as it involves a high level of risk, and you may lose your entire investment. It's advisable to thoroughly test any strategy on a demo account before trading with real funds and to seek the advice of a qualified financial advisor if you are unsure about your trading decisions.

Composite Momentum IndicatorComposite Momentum Indicator" combines the signals from several oscillators, including Stochastic, RSI, Ultimate Oscillator, and Commodity Channel Index (CCI) by averaging the standardized values (Z-Scores). Since it is a Z-Score based indicators the values will be typically be bound between +3 and -3 oscillating around 0. Here's a summary of the code:
Input Parameters: Users can customize the look-back period and set threshold values for overbought and oversold conditions. They can also choose which oscillators to include in the composite calculation.
Oscillator Calculations: The code calculates four separate oscillators - Stochastic, RSI, Ultimate Oscillator, and CCI - each measuring different aspects of market momentum.
Z-Scores Calculation: For each oscillator, the code calculates a Z-Score, which normalizes the oscillator's values based on its historical standard deviation and mean. This allows for a consistent comparison of oscillator values across different timeframes.
Composite Z-Score: The code aggregates the Z-Scores from the selected oscillators, taking into account user preferences (whether to include each oscillator). It then calculates an average Z-Score to create the "Composite Momentum Oscillator."
Conditional Color Coding: The composite oscillator is color-coded based on its average Z-Score value. It turns green when it's above the overbought threshold, red when it's below the oversold threshold, and blue when it's within the specified range.
Horizontal Lines: The code plots horizontal lines at key levels, including 0, ±3, ±2, and ±1, to help users identify important momentum levels.
Gradient Fills: It adds gradient fills above the overbought threshold and below the oversold threshold to visually highlight extreme momentum conditions.
Combining the Stochastic, RSI, Ultimate Oscillator, and Commodity Channel Index (CCI) into one composite indicator offers several advantages for traders and technical analysts:
Comprehensive Insight: Each of these oscillators measures different aspects of market momentum and price action. Combining them into one indicator provides a more comprehensive view of the market's behavior, as it takes into account various dimensions of momentum simultaneously.
Reduced Noise: Standalone oscillators can generate conflicting signals and produce noisy readings, especially during choppy market conditions. A composite indicator smoothes out these discrepancies by averaging the signals from multiple indicators, potentially reducing false signals.
Confirmation and Divergence: By combining multiple oscillators, traders can seek confirmation or divergence signals. When multiple oscillators align in the same direction, it can strengthen a trading signal. Conversely, divergence between the oscillators can warn of potential reversals or weakening trends.
Customization: Traders can tailor the composite indicator to their specific trading strategies and preferences. They have the flexibility to include or exclude specific oscillators, adjust look-back periods, and set threshold levels. This adaptability allows for a more personalized approach to technical analysis.
Clarity and Efficiency: Rather than cluttering the chart with multiple individual oscillators, a composite indicator condenses the information into a single plot. This enhances the clarity of the chart and makes it easier for traders to quickly interpret market conditions.
Overbought/Oversold Identification: Combining these oscillators can improve the identification of overbought and oversold conditions. It reduces the likelihood of false signals since multiple indicators must align to trigger these extreme conditions.
Educational Tool: For novice traders and analysts, a composite indicator can serve as an educational tool by demonstrating how different oscillators interact and influence each other's signals. It allows users to learn about multiple technical indicators in one glance.
Efficient Use of Screen Space: A single composite indicator occupies less screen space compared to multiple separate indicators. This is especially beneficial when analyzing multiple markets or timeframes simultaneously.
Holistic Approach: Instead of relying on a single indicator, a composite approach encourages a more holistic assessment of market conditions. Traders can consider a broader range of factors before making trading decisions.
Increased Confidence: A composite indicator can boost traders' confidence in their decisions. When multiple reliable indicators align, it can provide a stronger basis for taking action in the market.
In summary, combining the Stochastic, RSI, Ultimate Oscillator, and CCI into one composite indicator enhances the depth and reliability of technical analysis. It simplifies the decision-making process, reduces noise, and offers a more complete picture of market momentum, ultimately helping traders make more informed and well-rounded trading decisions.
* Feel free to compare against individual oscillatiors*

DTR & ATR
Description
This ATR and DTR label is update of Existing Label provided by © ssksubam
Please See Notes on original Script Here :
Original Code is not mine but I have done few code changes which I believe will help everyone who are looking to add more labels together and save space on the chart
ATR & DTR Script is very helpful for Day Traders as I will explain in detail bellow
Following are changes I have incorporated
Previous Label took more space on the charts with Header and Footer.
I removed the Header and moved both DTR vs ATR descriptions on the same line, saving space on the chart.
I updated the code to remove => signs, which are self-explanatory as I will explain below.
I made the label in 1 single compact line for maximum space efficiency and aesthetics.
These changes improve the content's clarity and conciseness while optimizing space on the charts. If you have any further requests or need additional assistance, feel free to let me know!
What Does DTR Signify?
Stock ATR stands for Average True Range, which is a technical indicator used in trading and investment analysis. The Average True Range measures the volatility of a stock over a given period of time. It provides insights into the price movement and potential price ranges of the stock.
The ATR is calculated as the average of the true ranges over a specific number of periods. The true range is the greatest of the following three values:
The difference between the current high and the current low.
The absolute value of the difference between the current high and the previous close.
The absolute value of the difference between the current low and the previous close.
Traders and investors use ATR to assess the potential risk and reward of a stock. A higher ATR value indicates higher volatility and larger price swings, while a lower ATR value suggests lower volatility and smaller price movements. By understanding the ATR, traders can set appropriate stop-loss levels and make informed decisions about position sizing and risk management.
It's important to note that the ATR is not a directional indicator like moving averages or oscillators. Instead, it provides a measure of volatility, helping traders adapt their strategies to suit the current market conditions.
What Does ATR Signify?
The Average True Range (ATR) signifies the level of volatility or price variability in a particular financial asset, such as a stock, currency pair, or commodity, over a specific period of time. It provides valuable information to traders and investors regarding the potential risk and reward associated with the asset.
Here are the key significances of ATR:
Volatility Measurement: ATR measures the average price range between high and low prices over a specified timeframe. Higher ATR values indicate greater volatility, while lower values suggest lower volatility. Traders use this information to gauge the potential price movements and adjust their strategies accordingly.
Risk Assessment: A higher ATR value implies larger price swings, indicating increased market uncertainty and risk. Traders can use ATR to set appropriate stop-loss levels and manage risk by adjusting position sizes based on the current volatility.
Trend Strength: ATR can also be used to assess the strength of a trend. In an uptrend or downtrend, ATR tends to increase, indicating a more powerful price movement. Conversely, a declining ATR might signify a weakening trend or a consolidation period.
Range-Bound Market Identification: In a range-bound or sideways market, the ATR value tends to be relatively low, reflecting the lack of significant price movements. This information can be helpful for range-trading strategies.
Volatility Breakouts: Traders often use ATR to identify potential breakouts from consolidation patterns. When the ATR value expands significantly, it may indicate the beginning of a new trend or a breakout move.
Comparison between Assets: ATR allows traders to compare the volatility of different
How to use DTR & ATR for Trading
Using Average True Range (ATR) and Daily Trading Range (DTR) can be beneficial for day trading to assess potential price movements, manage risk, and identify trading opportunities. Here's how you can use both indicators effectively:
Calculate ATR and DTR: First, calculate the ATR and DTR values for the asset you are interested in trading. ATR is the average of true ranges over a specified period (e.g., 14 days), while DTR is the difference between the high and low prices of a single trading day.
Assess Volatility: Compare the ATR and DTR values to understand the current volatility of the asset. Higher values indicate increased volatility, while lower values suggest reduced volatility.
Setting Stop-Loss: Use ATR to set appropriate stop-loss levels. For example, you might decide to set your stop-loss a certain number of ATR points away from your entry point. This approach allows you to factor in market volatility when determining your risk tolerance.
Identify Trading Range: Analyze DTR to determine the typical daily price range of the asset. This information can help you identify potential support and resistance levels, which are essential for day trading strategies such as breakout or range trading.
Breakout Strategies: ATR can assist in identifying potential breakout opportunities. When ATR values increase significantly, it suggests an expansion in volatility, which may indicate an upcoming breakout from a trading range. Look for breakouts above resistance or below support levels with higher than usual ATR values.
Scalping Strategies: For scalping strategies, where traders aim to profit from small price movements within a single trading session, knowing the typical DTR can help set reasonable profit targets and stop-loss levels.
Confirming Trend Strength: In day trading, you may encounter short-term trends. Use ATR to assess the strength of these trends. If the ATR is rising, it suggests a strong trend, while a declining ATR may indicate a weakening trend or potential reversal.
Risk Management: Both ATR and DTR can aid in risk management. Determine your position size based on the current ATR value to align it with your risk tolerance. Additionally, understanding the DTR can help you avoid overtrading during periods of low volatility.
Combine with Other Indicators: ATR and DTR work well when used in conjunction with other technical indicators like moving averages, Bollinger Bands, or RSI. Combining multiple indicators can provide a mor

Any Screener (Multiple)I suppose it's time to publish something relatively useful :). Here's the first try, Any Screener.
This script is an advanced version of the Alphatrend - Screener that I've coded as a humble "thank you" to Kıvanç Özbilgiç (KivancOzbilgic), who always inspired me.
INTRODUCTION
I developed this version with a unique method because I couldn't find an example with the following features:
It presents the valid signal status of multiple indicators for 15 different symbols in the form of a report.
It indicates how many bars have passed after the signal has occurred.
It indicates the signal direction with dynamic colors and chars.
It can also be used for data (just indicator value) that is only intended to be displayed as text. (Default color is grey).
Long and short signals can optionally be ploted on the chart.
It includes advanced configuration settings.
USAGE OF PANEL
The screener panel is simple to use. On the far left, assets are listed. The names of the indicators appear at the top. In the column with the name of each indicator, the signals of that indicator appear as green or red. The green ones represent the long signals (uptrend) and the red ones represent the short signals (down trend). The numbers in square brackets indicate how many bars have passed after the last signal has occurred. (For example: According to the indicator at the top, when the green bullish triangle and 21 appeared on allign of BTCUSDT, Bitcoin switched to buy signal 21 bars ago. A tip : If the signal distance is 0, the signal occurred at the current bar. It is recommended to wait for the bar to close before entering the trade). Signal distance is an essential output for both manual and algorithmic trading. Users often require mentioned data the most during real time trading.
THE SCRIPT
There are two sections in the script; indicators and screener.
SECTION 1 : "INDICATORS"
In the indicator section, you'll find efficient details about switch methods, normalization, avoid pyramyding (in momentum oscillators) etc. On the other hand, I intended to present a "how to example" of a multiple screener, so it has to include more than one indicator.
OTT : Optimized Trend Tracker is developed by dear Anıl Özekşi, known as the "Old Fisherman" :). In my opinion, it is a pretty cool trend-following indicator that offers a mathematical elegance. This indicator aim to detect the current market trend direction, the indicator detect an up-trending market when the support line is superior to the OTT, and a down trending market when the support line is inferior to the OTT. It has three parameters; moving average type, length and percentage. In this version when the percentage parameter is set to 0.0, OTT turns into the selected moving average. And the signals are generated by the crossing of the closing price. It means, this screener is able to compile and present status of moving averages as well. Also VAR (VIDYA) and EVWMA has been re-designed, both moving averages no longer start at zero at the beginning of the chart (That was a big problem for backtests).
PSAR : J. Welles Wilder's Parabolic Stop And Reversal is an important trend following indicator. PSAR detects an up-trending market when below the market price and a down-trend when above. It can work in harmony with OTT according to the parameter combinations.
OSCILLATORS : Also optional three momentum oscillators have been added. MFI (Money Flow Index), RSI (Relative Strength Index) and STOCH (Stochastic %k). All three oscillators are widely used in markets and quite successful in explaining price movements by using different sources. Oscillators generate long and short signals based on oversold and overbought parameters.
VOLATILITY & TREND : There are three optional indicators. ADX (Average Directional Index), BBW-N (Normalized Bollinger Bandwidth) and REG-N (Normalized value of standard error of linear regression). These three indicators don't generate any long or short signals. Instead, they are used to measure the strength of trends and volatility. Therefore, only the numerical results (0-100) are displayed in screener panel and it is grey. (Note : The second length parameter of ADX has the same value with the first one. Bollinger Bandwith's multiplier is 2.0. REG-N is a variable that developed by Paul Kirshenbaum for Kirshenbaum Bands.)
SECTION 2 : "SCREENER"
The second section processes the main idea. This Screener model is based on generating an integer direction variable from boolean signals. The direction value serves multiple purposes: calculating the distance of signal, determining the color based on the direction, and creating "clean" data for the security function. The final step is to present the obtained data as text to the user.
HOW CAN I "SCREEN" MY CONDITIONS?
That's piece a cake, delete the Section 1 in the script :). If you change totally 11 variables according to your own strategy, you can create your new screener! The method is explained at lines 169-171.
SINCERELY THANKS
To allanster for patiently answering my primitive questions,
And to KivancOzbilgic for mind blowing suggestions (especially while we're drinking Raki) :)...
DISCLEIMER
This is just an indicator, nothing more. The script is for informational and educational purposes only. The use of the script does not constitute professional and/or financial advice. The responsibility for risks associated with the use of the script is solely owned by the user. Do not forget to manage your risk. And trade as safely as possible. Good luck!
1m Divergence Radar v.1 === Version 1 Beta, Revision 400 ===
=== Divergence Radar ===
=== Jason Tang ===
DESCRIPTION:
This script monitors several other indicators in the background, and when it detects certain combinations that indicate bullish or bearish divergences, it will create a buy or sell signal and shade the background green or red.
The indicators that this script monitors:
- 1m, 3m, 5m MACDS
- Higher Lows (Bullish Divergence) on the 3m and 5m MACD
- Lower Highs (Bearish Divergence) on the 3m and 5m MACD
- Lower Highs on the 3m and 5m DMI for buying strength (Bearish Divergence)
- Lower Highs on the 3m and 5m DMI for selling strength (Bullish Divergence)
- The 1m and 3m Keltner channel (shown as orange backgrounds only), to detect extremes in price.
The indicator will also watch for "squeeze" or "crash" conditions, at which time it will avoid sending a sell or buy signal. I have had many frustrations from shorting into a squeeze, and coded in a "don't catch the knife" safety mechanism.
To see these internal calculations, you can go to settings and check "Show Internals". Then you can check the Style tab for a label for each internal indicator.
WHY I MADE THIS:
I often watch multiple timeframes while day trading and it can be a mentally difficult task to keep track of all of the indicators on each timeframe. 1m, 3m, 5m, price candles, MACD, DMI, and more. This indicator is meant to "offload" much of the routine mental calculation like "Is there a MACD divergence on this timeframe?". It also provides me a way to visually backtest the strength of combinations of divergences. This is an ongoing project.
USAGE:
- This indicator should mainly be used on the 1m ES chart. It is meant to assist me with day trading the ES futures contract.
- Please keep in mind this is a BETA script and is in ongoing development. I tune it almost every day or week and will update it on a regular basis.
- The "buy" and "sell" zones this indicator shows are COUNTER-TREND indicators. Please keep that in mind.
- If price is RISING into a RED background, I would consider selling, if my other systems agree and if I find the risk/reward acceptable.
- If price is FALLING into a GREEN background, I would consider buying, if my other systems agree and if I find the risk/reward acceptable.
A dim RED background:
- The presence of lower highs on the 3m MACD, 5m MACD, 3m DMI Buying Strength, or 5m DMI Buying Strength
A bright RED background:
- An extremely overdone price move that is also showing some divergences. My best effort at algorithmically detecting a place to sell.
A dim GREEN background:
- The presence of higher lows on the 3m MACD, 5m MACD
- The presence of lower highs on the 3m DMI Selling Strength, or 5m DMI Selling Strength.
A bright GREEN background:
- An extremely oversold price that is also showing some divergences. My best effort at algorithmically detecting a place a buy.
A bright green dot above price (if Show Internals is checked):
- A SQUEEZE signal that cuts off any sell signal. In these conditions technical indicators do not seem to matter as forced buyers are dominating the price action. Do not be tempted to short the rip.
A bright red dot below price (if Show Internals is checked):
- A CRASH signal that cuts off any buy signal. In these conditions technical indicators do not seem to matter as forced sellers are dominating the price action. Do not be tempted to catch the knife.

RSI-CCI Fusion + AlertsThe "RSI-CCI Fusion" indicator combines the Relative Strength Index (RSI) and Commodity Channel Index (CCI) from TradingView.
RSI-CCI Fusion: Unlocking Synergies in Technical Analysis
Technical analysis plays a crucial role in understanding market dynamics and making informed trading decisions. I often rely on a combination of indicators to gain insights into price movements and identify potential trade opportunities. In the lines below, I will explore the "RSI-CCI Fusion" indicator, a powerful tool that combines the strengths of the Relative Strength Index (RSI) and the Commodity Channel Index (CCI) to provide enhanced trading insights.
1. Understanding the RSI and CCI Indicators
Before delving into the fusion of these indicators, let's briefly review their individual characteristics. The RSI is a widely used momentum oscillator that measures the speed and change of price movements. It oscillates between 0 and 100, with readings above 70 indicating overbought conditions and readings below 30 indicating oversold conditions.
On the other hand, the CCI is a versatile indicator designed to identify cyclical trends in prices. It measures the distance between the price and its statistical average, thereby providing valuable insights into overbought and oversold levels.
2. The Concept of RSI-CCI Fusion
The RSI-CCI Fusion indicator is born out of my desire to harness the collective power of the RSI and CCI. By combining these indicators, I can benefit from a more comprehensive trading signal that captures both momentum and cyclical trend dynamics.
The fusion process involves assigning weights to the RSI and CCI, creating a blended indicator that reflects their relative importance. The weighted combination ensures that both indicators contribute meaningfully to the final result.
To maintain consistency, the RSI and CCI values are standardized using the z-score technique. This normalization process brings the values to a common scale, making them directly comparable. Rescaling is then applied to bring the combined indicator back to its original scale, facilitating intuitive interpretation.
3. Interpreting the RSI-CCI Fusion Indicator
When plotting the RSI-CCI Fusion indicator on a chart, I gain valuable insights into market dynamics and potential trading opportunities. The indicator's plot typically includes dynamic upper and lower bands, which are calculated based on the indicator's standard deviation. These bands provide boundaries for evaluating overbought and oversold conditions.
When the RSI-CCI Fusion indicator crosses above the lower band, it suggests oversold conditions and potential buying opportunities. Conversely, when the indicator crosses below the upper band, it indicates overbought conditions and potential selling opportunities. I also pay attention to the baseline, which represents the neutral level and may signal potential trend reversals.
4. Utilizing Alerts for Trading Decisions
The RSI-CCI Fusion indicator can be further enhanced by incorporating alerts. These alerts notify me when the indicator generates buy or sell signals, enabling me to take prompt action. I can customize the alerts based on my preferred thresholds and timeframes.
However, it is crucial to remember that the RSI-CCI Fusion indicator should not be relied upon in isolation. To increase the robustness of my trading decisions, it is recommended to combine the indicator with other analysis techniques such as trend lines, support and resistance levels, or additional indicators. This convergence of analysis methodologies enhances the overall accuracy of my trade signals.
Conclusion: The RSI-CCI Fusion indicator represents a compelling approach to technical analysis by synergizing the strengths of the RSI and CCI. By combining momentum and cyclical trend dynamics, I gain a more comprehensive view of market conditions. The fusion of these indicators, accompanied by timely alerts, equips me with valuable insights and facilitates well-informed trading decisions.
As with any technical analysis tool, it is essential for me to backtest the RSI-CCI Fusion indicator to evaluate its performance across different market conditions and timeframes. Additionally, applying proper risk management strategies is crucial to ensure consistent and disciplined trading practices.

Nonlinear Regression, Zero-lag Moving Average [Loxx]Nonlinear Regression and Zero-lag Moving Average
Technical indicators are widely used in financial markets to analyze price data and make informed trading decisions. This indicator presents an implementation of two popular indicators: Nonlinear Regression and Zero-lag Moving Average (ZLMA). Let's explore the functioning of these indicators and discuss their significance in technical analysis.
Nonlinear Regression
The Nonlinear Regression indicator aims to fit a nonlinear curve to a given set of data points. It calculates the best-fit curve by minimizing the sum of squared errors between the actual data points and the predicted values on the curve. The curve is determined by solving a system of equations derived from the data points.
We define a function "nonLinearRegression" that takes two parameters: "src" (the input data series) and "per" (the period over which the regression is calculated). It calculates the coefficients of the nonlinear curve using the least squares method and returns the predicted value for the current period. The nonlinear regression curve provides insights into the overall trend and potential reversals in the price data.
Zero-lag Moving Average (ZLMA)
Moving averages are widely used to smoothen price data and identify trend directions. However, traditional moving averages introduce a lag due to the inclusion of past data. The Zero-lag Moving Average (ZLMA) overcomes this lag by dynamically adjusting the weights of past values, resulting in a more responsive moving average.
We create a function named "zlma" that calculates the ZLMA. It takes two parameters: "src" (the input data series) and "per" (the period over which the ZLMA is calculated). The ZLMA is computed by first calculating a weighted moving average (LWMA) using a linearly decreasing weight scheme. The LWMA is then used to calculate the ZLMA by applying the same weight scheme again. The ZLMA provides a smoother representation of the price data while reducing lag.
Combining Nonlinear Regression and ZLMA
The ZLMA is applied to the input data series using the function "zlma(src, zlmaper)". The ZLMA values are then passed as input to the "nonLinearRegression" function, along with the specified period for nonlinear regression. The output of the nonlinear regression is stored in the variable "out".
To enhance the visual representation of the indicator, colors are assigned based on the relationship between the nonlinear regression value and a signal value (sig) calculated from the previous period's nonlinear regression value. If the current "out" value is greater than the previous "sig" value, the color is set to green; otherwise, it is set to red.
The indicator also includes optional features such as coloring the bars based on the indicator's values and displaying signals for potential long and short positions. The signals are generated based on the crossover and crossunder of the "out" and "sig" values.
Wrapping Up
This indicator combines two important concepts: Nonlinear Regression and Zero-lag Moving Average indicators, which are valuable tools for technical analysis in financial markets. These indicators help traders identify trends, potential reversals, and generate trading signals. By combining the nonlinear regression curve with the zero-lag moving average, this indicator provides a comprehensive view of the price dynamics. Traders can customize the indicator's settings and use it in conjunction with other analysis techniques to make well-informed trading decisions.

RSI Exponential Smoothing (Expo)█ Background information
The Relative Strength Index (RSI) and the Exponential Moving Average (EMA) are two popular indicators. Traders use these indicators to understand market trends and predict future price changes. However, traders often wonder which indicator is better: RSI or EMA.
What if these indicators give similar results? To find out, we wanted to study the relationship between RSI and EMA. We focused on a hypothesis: when the RSI goes above 50, it might be similar to the price crossing above a certain length of EMA. Similarly, when the RSI goes below 50, it might be similar to the price crossing below a certain length of EMA.
Our goal was simple: to figure out if there is any connection between RSI and EMA.
Conclusion: Yes, it seems that there is a correlation between RSI and EMA, and this indicator clearly displays that relationship. Read more about the study here:
█ Overview of the indicator
The RSI Exponential Smoothing indicator displays RSI levels with clear overbought and oversold zones, shown as easy-to-understand moving averages, and the RSI 50 line as an EMA. Another excellent feature is the added FIB levels. To activate, open the settings and click on "FIB Bands." These levels act as short-term support and resistance levels which can be used for scalping.
█ Benefits of using this indicator instead of regular RSI
The findings about the Relative Strength Index (RSI) and the Exponential Moving Average (EMA) highlight that both indicators are equally accurate (when it comes to crossings), meaning traders can choose either one without compromising accuracy. This empowers traders to pick the indicator that suits their personal preferences and trading style.
█ How it works
Crossings over/under the value of 50
The EMA line in the indicator acts as the corresponding 50 line in the RSI. When the RSI crosses the value 50 equals when Close crosses the EMA line.
Bouncess from the value 50
In this example, we can see that the EMA line on the chart acts as support/resistance equals when RSI rejects the 50 level.
Overbought and Oversold
The indicator comes with overbought and oversold bands equal when RSI becomes overbought or oversold.
█ How to use
This visual representation helps traders to apply RSI strategies directly on the price chart, potentially making RSI trading easier for traders.
-----------------
Disclaimer
The information contained in my Scripts/Indicators/Ideas/Algos/Systems does not constitute financial advice or a solicitation to buy or sell any securities of any type. I will not accept liability for any loss or damage, including without limitation any loss of profit, which may arise directly or indirectly from the use of or reliance on such information.
All investments involve risk, and the past performance of a security, industry, sector, market, financial product, trading strategy, backtest, or individual's trading does not guarantee future results or returns. Investors are fully responsible for any investment decisions they make. Such decisions should be based solely on an evaluation of their financial circumstances, investment objectives, risk tolerance, and liquidity needs.
My Scripts/Indicators/Ideas/Algos/Systems are only for educational purposes!
