MACD & RSI Overlay (Expo)█ Overview
The MACD & RSI Overlay (Expo) trading indicator is a technical analysis tool that combines two popular indicators, the Relative Strength Index (RSI ) and the Moving Average Convergence Divergence (MACD ), and overlays them onto the price chart. The indicator oscillates relative to price, so it plots the RSI and MACD around price while still displaying the same insights as the regular MACD and RSI indicators. This feature gives traders a unique perspective, allowing them to see the relationship between price, momentum, and trend in a single chart.
This indicator is a valuable addition to any trader's technical analysis toolkit, whether they are a beginner or an experienced trader.
█ MACD
█ RSI
The RSI comes with overbought and oversold areas, which can be set by the trader.
█ MACD & RSI
█ Trend Feature
What sets the MACD & RSI Overlay indicator apart is its ability to factor in the underlying trend. This feature makes the indicator more useful than ever before, as traders can use it to filter trades in the direction of the trend. By considering the underlying trend, traders can gain valuable insights into market trends.
█ Benefits
One of the primary benefits of having the MACD and RSI plotted directly on the price chart is that it provides a more intuitive understanding of the relationship between price, momentum, and trend. Traders can quickly identify the direction of the trend by observing the price movement relative to the MACD and RSI lines. In addition, by having these indicators plotted on the chart, traders can quickly identify potential buy and sell signals and develop new trading strategies.
█ How to use
One of the most popular strategies is to use the MACD & RSI Overlay indicator to look for crossings. A crossing occurs when the MACD and RSI lines cross over each other or when they cross over the signal line. These crossings can signal potential trend reversals and momentum shifts. For example, if the MACD line crosses over the signal line from below, it could indicate a bullish signal, while a cross from above could indicate a bearish signal.
-----------------
Disclaimer
The information contained in my Scripts/Indicators/Ideas/Algos/Systems does not constitute financial advice or a solicitation to buy or sell any securities of any type. I will not accept liability for any loss or damage, including without limitation any loss of profit, which may arise directly or indirectly from the use of or reliance on such information.
All investments involve risk, and the past performance of a security, industry, sector, market, financial product, trading strategy, backtest, or individual's trading does not guarantee future results or returns. Investors are fully responsible for any investment decisions they make. Such decisions should be based solely on an evaluation of their financial circumstances, investment objectives, risk tolerance, and liquidity needs.
My Scripts/Indicators/Ideas/Algos/Systems are only for educational purposes!
Cari dalam skrip untuk "indicators"
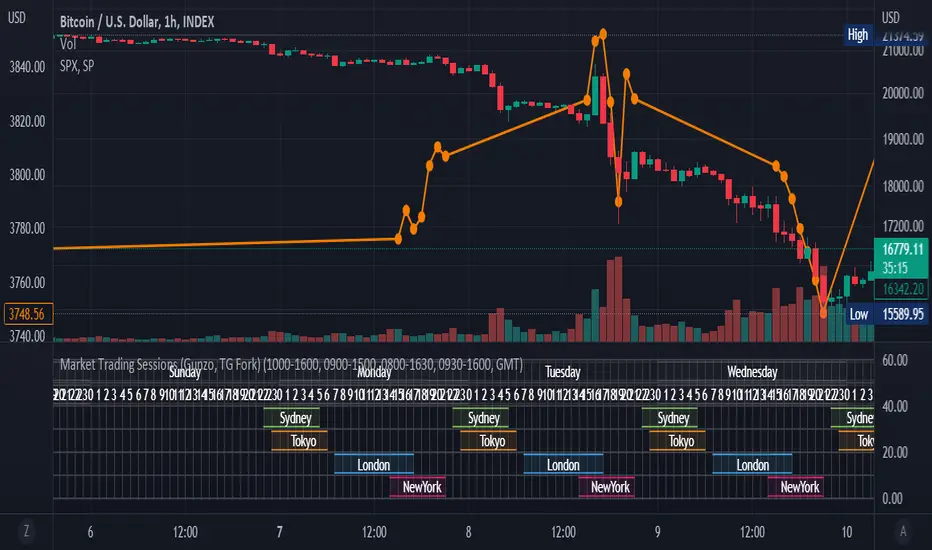
Market Trading Sessions (TG Fork)Visualize trading sessions opening hours of several international exchanges on a grid. Contrary to other indicators, this one automatically aligns the session with the current chart's timezone.
This is helpful for bar replay or manual backtesting, to spot patterns of correlations (this can also be used in conjunction with correlation indicators, see my other indicators).
Original indicator by Gunzo, if you like this indicator, please show the original author some love:
This indicator is also inspired by the following indicators:
ZenAndTheArtOfTrading with
UnknownUnicorn468659 with
This fork implements the following features:
Converted to PineScript v5.
Adapted default color palette to dark mode, as is the default in TradingView now.
Fix drawing issues, now the design shows as it was originally meant to be.
Fixed mistiming issue that made some sessions display with a delay compared to the real session, especially the first session was bar at the start of the session was not displayed.
Inputted the accurate timings for each session, instead of the default 0800-1600 in the original indicator.
Essentially, you can just add this indicator and it should work out of the box. If not, please let me know, and I'll try to fix it!
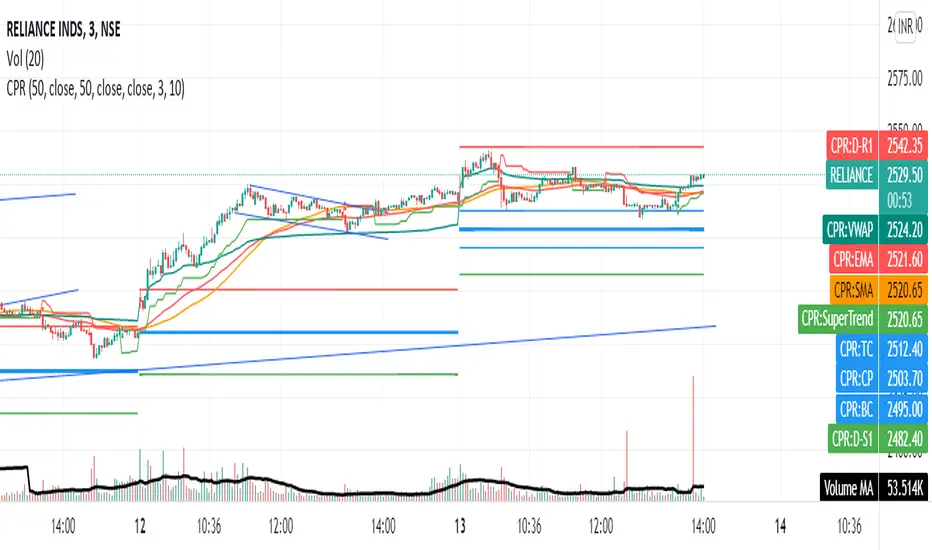
CPR with MAs, Super Trend & VWAP by MackraniThis script will allow to add CPR with Standard Pivots and 4 Indicators.
Standard Pivot has 9 levels of support and 9 levels of resistance lines. It has CPR , 3 levels of Day-wise pivots , 3 levels of Weekly pivots and 3 Levels of Monthly Pivots .
In Addition to the CPR and Pivot , this script will allow user to Add 4 more Indicators - SMA , EMA , VWAP and SuperTrend as well.
All the Support and resistance levels can be enabled / disabled from settings. It will allow to select multiple combinations of support and resistance levels across 3 levels at any of the 3 time-frames individually and combined.
All 4 Indicators can be can be enabled / disabled from settings. This will allow the indicators to be plotted individually and combined along with any combination of CPR & Pivots .
These number of combinations will allow user to visualize the charts with desired indicators, pivot support & resistance levels on all or any of the 3 time frames.
For Ease of access, listed few points on how the script works..
- CPR and day-wise level 1 & 2 (S1 & R1) enabled by default and can be changed from settings
- Day-wise Level 2 & 3 (S2, R2, S3 & L3) can be enabled from settings
- Weekly 3 levels and Monthly 3 levels can be enabled from settings
- CPR & pivot levels colored in blue lines
- All support levels colored in Green
- All resistance levels Colored in Red
- Day-wise pivot , support & resistance are straight lines
- Weekly pivot , support & resistance are cross (+) lines
- Weekly pivot , support & resistance are circle (o) lines
- SMA , EMA , VWAP and SuperTrend Enabled by Default
- SMA Colored in Orange
- EMA Colored in Red
- EMA Colored in Teal
- SuperTrend Colored in standard Red & Green with triangle arrows
- Any combinations can be selected from settings-> Inputs & style

Damiani Volatmeter [loxx]I wasn't going to publish this since it's one my go to private indicators, but I decided to push this out anyway. This is a variation on Damiani Volatmeter to make it easier to understand what's going on. Damiani Volatmeter uses ATR and Standard deviation to tease out ticker volatility so you can better understand when it's the ideal time to trade. The idea here is that you only take trades when volatility is high so this indicator is to be coupled with various other indicators to validate the other indicator's signals. This is also useful for detecting crabbing and chopping markets.
Shoutout to user @xinolia for the DV function used here.
Anything red means that volatility is low. Remember volatility doesn't have a direction. Anything green means volatility high despite the direction of price. The core signal line here is the green and red line that dips below two while threshold lines to "recharge". Maximum recharge happen when the core signal line shows a yellow ping. Soon after one or many yellow pings you should expect a massive upthrust of volatility. The idea here is you don't trade unless volatility is rising or green. This means that the Volatmeter has to dip into the recharge zone, recharge and then spike upward. You can also attempt to buy or sell reversals with confluence indicators when volatility is in the recharge zone, but I wouldn't recommend this. However, if you so choose to do this, then use the following indicator for confluence.
And last reminder, volatility doesn't have a direction ! Red doesn't mean short, and green doesn't mean long, Red means don't trade period regardless of direction long/short, and green means trade no matter the direction long/short. This means you'll have to add an indicator that does show direction such as a mean reversion indicator like Fisher Transform or a Gaussian Filter. You can search my public scripts for various Fisher Transform and Gaussian Filter indicators.
Price-Filtered Spearman Rank Correl. w/ Floating Levels is considered the Mercedes Benz of reversal indcators
How signals work
RV = Rising Volatility
VD = Volatility Dump
Plots
White line is signal
Thick red/green line is the Volatmeter line
The dotted lower lines are the zero line and minimum recharging line
Included
Bar coloring
Alerts
Signals
Related indicators
Variety Moving Average Waddah Attar Explosion (WAE)

APA Adaptive Fisher Transform [Loxx]APA Adaptive Fisher Transform is an adaptive cycle Fisher Transform using Ehlers Autocorrelation Periodogram Algorithm to calculate the dominant cycle period.
What is an adaptive cycle, and what is Ehlers Autocorrelation Periodogram Algorithm?
From Ehlers' book Cycle Analytics for Traders Advanced Technical Trading Concepts by John F. Ehlers , 2013, page 135:
"Adaptive filters can have several different meanings. For example, Perry Kaufman’s adaptive moving average ( KAMA ) and Tushar Chande’s variable index dynamic average ( VIDYA ) adapt to changes in volatility . By definition, these filters are reactive to price changes, and therefore they close the barn door after the horse is gone.The adaptive filters discussed in this chapter are the familiar Stochastic , relative strength index ( RSI ), commodity channel index ( CCI ), and band-pass filter.The key parameter in each case is the look-back period used to calculate the indicator. This look-back period is commonly a fixed value. However, since the measured cycle period is changing, it makes sense to adapt these indicators to the measured cycle period. When tradable market cycles are observed, they tend to persist for a short while.Therefore, by tuning the indicators to the measure cycle period they are optimized for current conditions and can even have predictive characteristics.
The dominant cycle period is measured using the Autocorrelation Periodogram Algorithm. That dominant cycle dynamically sets the look-back period for the indicators. I employ my own streamlined computation for the indicators that provide smoother and easier to interpret outputs than traditional methods. Further, the indicator codes have been modified to remove the effects of spectral dilation.This basically creates a whole new set of indicators for your trading arsenal."
What is Fisher Transform?
The Fisher Transform is a technical indicator created by John F. Ehlers that converts prices into a Gaussian normal distribution.
The indicator highlights when prices have moved to an extreme, based on recent prices. This may help in spotting turning points in the price of an asset. It also helps show the trend and isolate the price waves within a trend.
Included:
Zero-line and signal cross options for bar coloring
Customizable overbought/oversold thresh-holds
Alerts
Signals

Jurik CFB Adaptive QQE [Loxx]Jurik CFB Adaptive QQE is a Double Jurik-Filtered, Composite Fractal Behavior (CFB) adaptive, Qualitative Quantitative Estimation indicator. This indicator includes both fixed and the CFB adaptive calculations as well as three different types of RSI calculations including Jurik's RSX.
What is Qualitative Quantitative Estimation (QQE)?
The Qualitative Quantitative Estimation (QQE) indicator works like a smoother version of the popular Relative Strength Index ( RSI ) indicator. QQE expands on RSI by adding two volatility based trailing stop lines. These trailing stop lines are composed of a fast and a slow moving Average True Range (ATR).
There are many indicators for many purposes. Some of them are complex and some are comparatively easy to handle. The QQE indicator is a really useful analytical tool and one of the most accurate indicators. It offers numerous strategies for using the buy and sell signals. Essentially, it can help detect trend reversal and enter the trade at the most optimal positions.
What is Wilders' RSI?
The Relative Strength Index ( RSI ) is a well versed momentum based oscillator which is used to measure the speed (velocity) as well as the change (magnitude) of directional price movements. Essentially RSI , when graphed, provides a visual mean to monitor both the current, as well as historical, strength and weakness of a particular market. The strength or weakness is based on closing prices over the duration of a specified trading period creating a reliable metric of price and momentum changes. Given the popularity of cash settled instruments (stock indexes) and leveraged financial products (the entire field of derivatives); RSI has proven to be a viable indicator of price movements.
What is RSX RSI?
RSI is a very popular technical indicator, because it takes into consideration market speed, direction and trend uniformity. However, the its widely criticized drawback is its noisy (jittery) appearance. The Jurk RSX retains all the useful features of RSI , but with one important exception: the noise is gone with no added lag.
What is Rapid RSI?
Rapid RSI Indicator, from Ian Copsey's article in the October 2006 issue of Stocks & Commodities magazine.
RapidRSI resembles Wilder's RSI , but uses a SMA instead of a WilderMA for internal smoothing of price change accumulators.
What is Composite Fractal Behavior (CFB)?
All around you mechanisms adjust themselves to their environment. From simple thermostats that react to air temperature to computer chips in modern cars that respond to changes in engine temperature, r.p.m.'s, torque, and throttle position. It was only a matter of time before fast desktop computers applied the mathematics of self-adjustment to systems that trade the financial markets.
Unlike basic systems with fixed formulas, an adaptive system adjusts its own equations. For example, start with a basic channel breakout system that uses the highest closing price of the last N bars as a threshold for detecting breakouts on the up side. An adaptive and improved version of this system would adjust N according to market conditions, such as momentum, price volatility or acceleration.
Since many systems are based directly or indirectly on cycles, another useful measure of market condition is the periodic length of a price chart's dominant cycle, (DC), that cycle with the greatest influence on price action.
The utility of this new DC measure was noted by author Murray Ruggiero in the January '96 issue of Futures Magazine. In it. Mr. Ruggiero used it to adaptive adjust the value of N in a channel breakout system. He then simulated trading 15 years of D-Mark futures in order to compare its performance to a similar system that had a fixed optimal value of N. The adaptive version produced 20% more profit!
This DC index utilized the popular MESA algorithm (a formulation by John Ehlers adapted from Burg's maximum entropy algorithm, MEM). Unfortunately, the DC approach is problematic when the market has no real dominant cycle momentum, because the mathematics will produce a value whether or not one actually exists! Therefore, we developed a proprietary indicator that does not presuppose the presence of market cycles. It's called CFB (Composite Fractal Behavior) and it works well whether or not the market is cyclic.
CFB examines price action for a particular fractal pattern, categorizes them by size, and then outputs a composite fractal size index. This index is smooth, timely and accurate
Essentially, CFB reveals the length of the market's trending action time frame. Long trending activity produces a large CFB index and short choppy action produces a small index value. Investors have found many applications for CFB which involve scaling other existing technical indicators adaptively, on a bar-to-bar basis.
What is Jurik Volty used in the Juirk Filter?
One of the lesser known qualities of Juirk smoothing is that the Jurik smoothing process is adaptive. "Jurik Volty" (a sort of market volatility ) is what makes Jurik smoothing adaptive. The Jurik Volty calculation can be used as both a standalone indicator and to smooth other indicators that you wish to make adaptive.
What is the Jurik Moving Average?
Have you noticed how moving averages add some lag (delay) to your signals? ... especially when price gaps up or down in a big move, and you are waiting for your moving average to catch up? Wait no more! JMA eliminates this problem forever and gives you the best of both worlds: low lag and smooth lines.
Ideally, you would like a filtered signal to be both smooth and lag-free. Lag causes delays in your trades, and increasing lag in your indicators typically result in lower profits. In other words, late comers get what's left on the table after the feast has already begun.
Included
-Toggle bar color on/off

Ehlers Adaptive Relative Strength Index (RSI) [Loxx]Ehlers Adaptive Relative Strength Index (RSI) is an implementation of RSI using Ehlers Autocorrelation Periodogram Algorithm to derive the length input for RSI. Other implementations of Ehers Adaptive RSI rely on the inferior Hilbert Transformer derive the dominant cycle.
In his book "Cycle Analytics for Traders Advanced Technical Trading Concepts", John F. Ehlers describes an implementation for Adaptive Relative Strength Index in order to solve for varying length inputs into the classic RSI equation.
What is an adaptive cycle, and what is the Autocorrelation Periodogram Algorithm?
From his Ehlers' book mentioned above, page 135:
"Adaptive filters can have several different meanings. For example, Perry Kaufman’s adaptive moving average (KAMA) and Tushar Chande’s variable index dynamic average (VIDYA) adapt to changes in volatility. By definition, these filters are reactive to price changes, and therefore they close the barn door after the horse is gone.The adaptive filters discussed in this chapter are the familiar Stochastic, relative strength index (RSI), commodity channel index (CCI), and band-pass filter.The key parameter in each case is the look-back period used to calculate the indicator.This look-back period is commonly a fixed value. However, since the measured cycle period is changing, as we have seen in previous chapters, it makes sense to adapt these indicators to the measured cycle period. When tradable market cycles are observed, they tend to persist for a short while.Therefore, by tuning the indicators to the measure cycle period they are optimized for current conditions and can even have predictive characteristics.
The dominant cycle period is measured using the autocorrelation periodogram algorithm. That dominant cycle dynamically sets the look-back period for the indicators. I employ my own streamlined computation for the indicators that provide smoother and easier to interpret outputs than traditional methods. Further, the indicator codes have been modified to remove the effects of spectral dilation.This basically creates a whole new set of indicators for your trading arsenal."
What is Adaptive RSI?
From his Ehlers' book mentioned above, page 137:
"The adaptive RSI starts with the computation of the dominant cycle using the autocorrelation periodogram approach. Since the objective is to use only those frequency components passed by the roofing filter, the variable "filt" is used as a data input rather than closing prices. Rather than independently taking the averages of the numerator and denominator, I chose to perform smoothing on the ratio using the SuperSmoother filter. The coefficients for the SuperSmoother filters have previously been computed in the dominant cycle measurement part of the code."
Happy trading!

COG SSMACD COL combo with ADX Filter [orion35]This indicator consists of a combination of indicators produced by the most valuable developers in the market.
These are: Center of Gravity (COG) and Super Smoothed MACD (SSMACD) shared by @KivancOzbilgic and Center of Linearity (COL) shared by @alexgrover
I produced this indicator by writing new conditions that compare the signals given by these indicators with each other. I re-coded the change in the thickness of the cloud from the COL indicator as the middle horizontal line with varying color intensity and type. I have provided options for switching between these three indicators when desired.
Note: The strongest signals in the indicator are the blue colored triangles. Moderately strong ones are yellow signals. White colored signals are considered as the weakest signals.
Some minor fixes:
Some confusing words were thrown in the alarms section,
Added new alarm codes for any Triple or Double signals.
Major changes have been made with this update.
It is very important to know the direction and strength of the trend in financial markets. Therefore, ADX (Average Directional movement index) was developed by J. Welles Wilder in 1978 as an indicator of the trend strength in the prices of a financial instrument.
Especially in sideways markets, most indicators produce many false signals. However, these signals can be filtered with the ADX indicator. The price is considered sideways when the ADX is less than 20 as the threshold value.
With this update,
ADX filter can be activated when desired, and signals can be filtered flexibly according to the "threshold" value determined by the user. When the ADX filter is active, it will also reflect on the alarm conditions. Therefore, if an alarm is to be set according to the ADX filter, the filter must be activated first.
The colors of the lines and signals have been made changeable.
The visual level and thickness of the COL line has been made adjustable.
With this update, signals can be filtered according to the MavilimW indicator developed by @KivancOzbilgic
Filter Methods:
Normal: If the price is below the BlueW line, "bull" signals are filtered out, and above "bear" signals are filtered out.
Reverse : Applies the opposite of the normal method.
Fixed some visual bugs in switching between indicators.

MFI + RSI + MOM With Bull & Bear Trend LabelMOMENTUM + MONEY FLOW INDEX + RELATIVE STRENGTH INDEX WITH BULL & BEAR LABELS
This is a combination of 3 popular indicators. Momentum(MOM), Money Flow Index(MFI) and Relative Strength Index(RSI) along with color changing labels that tell you each indicator's current trend.
The middle white line shows the level that each indicator needs to stay above to be bullish and below for bearish. Watch for all three indicators to cross and hold above or below the mid line for big moves.
It is important to note that these indicators do not need to be going up to be bullish or down to be bearish. They just need to hold above or below the mid line to understand the overall trend.
The momentum indicator is the most relevant in my opinion. If it is holding above the mid line steadily, usually the overall trend will continue upwards so look to buy the dips if the momentum cloud is staying above the white line and vice versa.
It is also important to note that the default settings for this indicator are the 100 period as I find it to be super relevant across most charts but these numbers can be changed in the indicator settings.
Since momentum swings wildly past the normal 0-100 range, it is important to note that the momentum line has been “normalized” to stay within this same range as the rsi and mfi. So if you look at a normal momentum indicator side by side with this indicator it will not look the same however, I find it to be a very good indicator of overall direction so I know the current market sentiment even when price is diverging from the indicator directions.
All of the colors, sources and lengths can be easily customized in the indicator settings input tab.
***HOW TO USE***
When Momentum is above the mid line, it is bullish. When Momentum is below the mid line, it is bearish.
A label on the right side will update in real time to tell you if momentum is Bullish or Bearish for faster recognition of the trend.
When RSI is above the mid line, it is bullish. When Momentum is below the mid line it is bearish.
A label on the right side will update in real time to tell you if RSI is Bullish or Bearish for faster recognition of the trend.
When MFI is above the mid line, it is bullish. When MFI is below the mid line it is bearish.
A label on the right side will update in real time to tell you if MFI is Bullish or Bearish for faster recognition of the trend.
This indicator was built to help you quickly identify the Bullish or Bearish nature of the current trend with a live color changing label so you can glance at the label and understand it's direction without analyzing the indicator data.
***MARKETS***
This indicator can be used as a signal on all markets, including stocks, crypto, futures and forex.
***TIMEFRAMES***
This mom + mfi + rsi indicator can be used on all timeframes.
***TIPS***
Try using numerous indicators of ours on your chart so you can instantly see the bullish or bearish trend of multiple indicators in real time without having to analyze the data. Some of our favorites are our Auto Fibonacci, Directional Movement Index, Volume Profile, Auto Support And Resistance and Money Flow Index in combination with this indicator. They all have real time Bullish and Bearish labels as well so you can immediately understand each indicator's trend.

Share market aasan hai CPR with MA & VWAP This script will allow to add CPR with Standard Pivots and 4 Indicators.
Standard Pivot has 9 levels of support and 9 levels of resistance lines. It has CPR , 3 levels of Day-wise pivots , 3 levels of Weekly pivots and 3 Levels of Monthly Pivots .
In Addition to the CPR and Pivot , this script will allow user to Add 4 more Indicators - SMA , EMA , VWAP and SuperTrend as well.
All the Support and resistance levels can be enabled / disabled from settings. It will allow to select multiple combinations of support and resistance levels across 3 levels at any of the 3 time-frames individually and combined.
All 4 Indicators can be can be enabled / disabled from settings. This will allow the indicators to be plotted individually and combined along with any combination of CPR & Pivots .
These number of combinations will allow user to visualize the charts with desired indicators, pivot support & resistance levels on all or any of the 3 time frames.
For Ease of access, listed few points on how the script works..
- CPR and day-wise level 1 & 2 (S1 & R1) enabled by default and can be changed from settings
- Day-wise Level 2 & 3 (S2, R2, S3 & L3) can be enabled from settings
- Weekly 3 levels and Monthly 3 levels can be enabled from settings
- CPR & pivot levels colored in blue lines
- All support levels colored in Green
- All resistance levels Colored in Red
- Day-wise pivot , support & resistance are straight lines
- Weekly pivot , support & resistance are cross (+) lines
- Weekly pivot , support & resistance are circle (o) lines
- SMA , EMA , VWAP and SuperTrend Enabled by Default
- SMA
- EMA
- SuperTrend
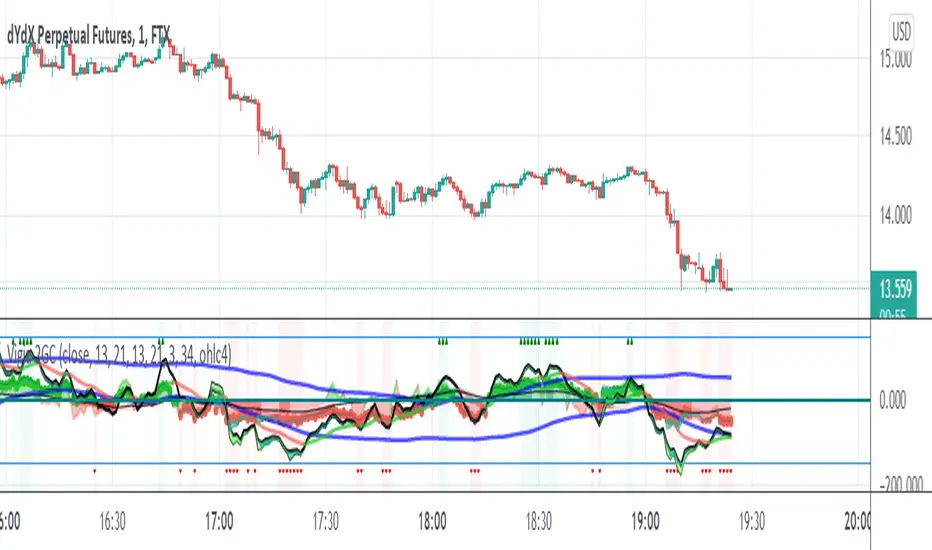
Vigia blai5VIGÍA is the latest and current version of this weighted indicator that collects, combines and harmonizes the values of four other classic indicators: RSI, MFI, Bollinger Bands and Stochastic.
It is a 2nd Generation indicator, as it does not base its algorithm on pure price data, but on its evolution (volatility, volume differences, power variations, cycle phase ...) working from first generation indicators included and mixed in the algorithm.
With the RSI we detect current power or depletion; the MFI adds the harmonization between price and volume; Bollinger Bands warn us of positions in areas close to support and resistance, and Stochastic informs us of the favorable and unfavorable phases of its cycle. VIGÍA tries to gather all this information in a single value and signal. This is how the curve of this indicator emerges.
The layout of this curve is its own and different from that of the other four separately. But the key idea of this complex indicator is to harmonize the signals.
By "harmonizing" we mean that an exaggerated value of one of the individual indicators, being part of a set, is nuanced. On the other hand, a simultaneous good look in two or more, enhances the resulting signal making it more visible and clear for trading.
One of the main effects that I have tried to enhance in the various versions of VIGÍA is its geometry, so one of the best ways to operate the indicator is divergences, which are generally quite reliable.
But, unlike so many conventional indicators, VIGÍA allows us a relatively large number of operations, which can satisfy both lovers of the most daring techniques and those who are more prudent in their trading.
In the first place, the black line is properly the Watch Signal (SV), the soul and central element of this entire invention.
On it you will see that a red line is oscillating. It is an Exponential Average of the indicator itself (by default, value 20). It is of enormous interest for trading since the SV cuts on its Average can be taken as entry and exit signals. (To check it, you just have to check it on the history of any value or index).
But there are more elements. An important change is the transformation of fixed levels into variable trading bands. This system allows the environment to adapt to changes in the asset price, recognizing and transforming itself according to the trend or laterality phases through which it runs. The signal moves above and below a central zero value and (as always) with no extreme limits, because it is important to remember that VIGÍA is not an oscillator and that prevents it from reaching a predefined extreme and being 'keyed in'.
On the upper variable band, we enter the overload zone, in Vigía's own jargon, while under the lower variable band, the situation of the indicator is on discharge. It is interesting to observe how, precisely the crossing of these variable bands by Vigía coincides on many occasions with the fastest and most productive phase of the entire price shift, far from concepts that in this phase we should already abandon as outdated and unreliable such as "overbought" or "oversold."
The last two elements remain to be described: a timid blue dashed line and that flickering central area of color called the Astro.
The blue dashed line is named Filter. It is a much more useful element than its smooth and modest journey appears. The Filter has some really fascinating features. Notice, for example, that it is the only line that I keep in visible numerical value, to know exactly when it has a positive and negative value. In periods of laterality, it is a good ally to help us make decisions. It does more things, but that is a prize reserved for whoever pays some attention to it… :-))
We will finish by Astro. Astro is an indicator with its own personality that I designed separately, it is available independently, but I ended up incorporating it into Watcher, which also happens with the Medium Proportional Volume (MPV). Both can be presented or hidden, according to the tastes or needs of the user.
Astro is an adjustable trend indicator, a very useful little tool that will help us identify the critical points where we must consider entries or changes in position. Its default value is 8 cycles, which is a good fit for daily stocks, but I have left open the possibility of modifying its period to be able to take advantage of all its power in intraday temporalities. Once again, I invite you to DO NOT believe me, but to launch the indicator on any asset and evaluate the signals that Astro has offered on its history.
[PX] MTF OverviewHello everyone,
the new table-functions came out, so I wanted to give it a try. With this indicator you can get an overview for your chart by looking at multiple timeframes and different type of indicators for each timeframe.
How does it work?
The indicator uses 3 different timeframes, which you can select in the settings-tab. For each timeframe it will look at the following indicators:
- Volume for the Volume column
- Relative Strength Index (RSI) for the Momentum column
- Average True Range (ATR) for the Volatility column
- Parabolic SAR (PSAR) for the Trend column
Increasing values will be shown in green, decreasing values in red. For the trend it prints a nice little symbol. I'm planning to add more indicators for each indicator category, so that you can choose, which indicators you want to use.
Hope that might be useful to some of you :)
Please click the "Like"-button and follow me for future open-source script publications.
If you are looking for help with your custom PineScript development, don't hesitate to contact me directly here on Tradingview or through the link in my signature :)

Realtime Delta Volume Action [LucF]█ OVERVIEW
This indicator displays on-chart, realtime, delta volume and delta ticks information for each bar. It aims to provide traders who trade price action on small timeframes with volume and tick information gathered as updates come in the chart's feed. It builds its own candles, which are optimized to display volume delta information. It only works in realtime.
█ WARNING
This script is intended for traders who can already profitably trade discretionary on small timeframes. The high cost in fees and the excitement of trading at small timeframes have ruined many newcomers to trading. While trading at small timeframes can work magic for adrenaline junkies in search of thrills rather than profits, I DO NOT recommend it to most traders. Only seasoned discretionary traders able to factor in the relatively high cost of such a trading practice can ever hope to take money out of markets in that type of environment, and I would venture they account for an infinitesimal percentage of traders. If you are a newcomer to trading, AVOID THIS TOOL AT ALL COSTS — unless you are interested in experimenting with the interpretation of volume delta combined with price action. No tool currently available on TradingView provides this type of close monitoring of volume delta information, but if you are not already trading small timeframes profitably, please do not let yourself become convinced that it is the missing piece you needed. Avoid becoming a sucker who only contributes by providing liquidity to markets.
The information calculated by the indicator cannot be saved on charts, nor can it be recalculated from historical bars.
If you refresh the chart or restart the script, the accumulated information will be lost.
█ FEATURES
Key values
The script displays the following key values:
• Above the bar: ticks delta (DT), the total ticks for the bar, the percentage of total ticks that DT represents (DT%)
• Below the bar: volume delta (DV), the total volume for the bar, the percentage of total volume that DV represents (DV%).
Candles
Candles are composed of four components:
1. A top shaped like this: ┴, and a bottom shaped like this: ┬ (picture a normal Japanese candle without a body outline; the values used are the same).
2. The candle bodies are filled with the bull/bear color representing the polarity of DV. The intensity of the body's color is determined by the DV% value.
When DV% is 100, the intensity of the fill is brightest. This plays well in interpreting the body colors, as the smaller, less significant DV% values will produce less vivid colors.
3. The bright-colored borders of the candle bodies occur on "strong bars", i.e., bars meeting the criteria selected in the script's inputs, which you can configure.
4. The POC line is a small horizontal line that appears to the left of the candle. It is the volume-weighted average of all price updates during the bar.
Calculations
This script monitors each realtime update of the chart's feed. It first determines if price has moved up or down since the last update. The polarity of the price change, in turn, determines the polarity of the volume and tick for that specific update. If price does not move between consecutive updates, then the last known polarity is used. Using this method, we can calculate a running volume delta and ticks delta for the bar, which becomes the bar's final delta values when the bar closes (you can inspect values of elapsed realtime bars in the Data Window or the indicator's values). Note that these values will all reset if the script re-executes because of a change in inputs or a chart refresh.
While this method of calculating is not perfect, it is by far the most precise way of calculating volume delta available on TradingView at the moment. Calculating more precise results would require scripts to have access to tick data from any chart timeframe. Charts at seconds timeframes do use exchange/broker ticks when the feeds you are using allow for it, and this indicator will run on them, but tick data is not yet available from higher timeframes. Also, note that the method used in this script is far superior to the intrabar inspection technique used on historical bars in my other "Delta Volume" indicators. This is because volume and ticks delta here are calculated from many more realtime updates than the available intrabars in history. Unfortunately, the calculation method used here cannot be used on historical bars, where intrabar inspection remains, in my opinion, the optimal method.
Inputs
The script's inputs provide many ways to personalize all the components: what is displayed, the colors used to display the information, and the marker conditions. Tooltips provide details for many of the inputs; I leave their exploration to you.
Markers
Markers provide a way for you to identify the points of interest of your choice on the chart. You control the set of conditions that trigger each of the five available markers.
You select conditions by entering, in the field for each marker, the number of each condition you want to include, separated by a comma. The conditions are:
1 — The bar's polarity is up/dn.
2 — `close` rises/falls ("rises" means it is higher than its value on the previous bar).
3 — DV's polarity is +/–.
4 — DV% rises (↕).
5 — POC rises/falls.
6 — The quantity of realtime updates rises (↕).
7 — DV > limit (You specify the limit in the inputs. Since DV can be +/–, DV– must be less than `–limit` for a short marker).
8 — DV% > limit (↕).
9 — DV+ rises for a long marker, DV– falls for a short.
10 — Consecutive DV+/DV– on two bars.
11 — Total volume rises (↕).
12 — DT's polarity is +/–.
13 — DT% rises (↕).
14 — DT+ rises for a long marker, DT– falls for a short.
Conditions showing the (↕) symbol do not have symmetrical states; they act more like filters. If you only include condition 4 in a marker's setup, for example, both long and short markers will trigger on bars where DV% rises. To trigger only long or short markers, you must add a condition providing directional differentiation, such as conditions 1 or 2. Accordingly, you would enter "1,4" or "2,4".
For a marker to trigger, ALL the conditions you specified for it must be met. Long markers appear on the chart as "Mx▲" signs under the values displayed below candles. Short markers display "Mx▼" over the number of updates displayed above candles. The marker's number will replace the "x" in "Mx▲". The script loads with five markers that will not trigger because no conditions are associated with them. To activate markers, you will need to select and enter the set of conditions you require for each one.
Alerts
You can configure alerts on this script. They will trigger whenever one of the configured markers triggers. Alerts do not repaint, so they trigger at the bar's close—which is also when the markers will appear.
█ HOW TO USE IT
As a rule, I do not prescribe expected use of my indicators, as traders have proved to be much more creative than me in using them. Additionally, I tend to think that if you expect detailed recommendations from me to be able to use my indicators, it's a sign you are in a precarious situation and should go back to the drawing board and master the necessary basics that will allow you to explore and decide for yourself if my indicators can be useful to you, and how you will use them. I will make an exception for this thing, as it presents fairly novel information. I will use simple logic to surmise potential uses, as contrary to most of my other indicators, I have NOT used this one to actually trade. Markets have a way of throwing wrenches in our seemingly bullet-proof rationalizing, so drive cautiously and please forgive me if the pointers I share here don't pan out.
The first thing to do is to disable your normal bars. You can do this by clicking on the eye icon that appears when you hover over the symbol's name in the upper-left corner of your chart.
The absolute value and polarity of DV mean little without perspective; that's why I include both total volume for the bar and the percentage that DV represents of that total volume. I interpret a low DV% value as indecision. If you share that opinion, you could, let's say, configure one of the markers on "DV% > 80%", for example (to do so you would enter "8" in the condition field of any marker, and "80" in the limit field for condition 8, below the marker conditions).
I also like to analyze price action on the bar with DV%. Small DV% values should often produce small candle bodies. If a small DV% value occurs on a bar with much movement and high volume, I'm thinking "tough battle with potential explosive power when one side wins". Conversely, large bodies with high DV% mean that large volume is breaching through multiple levels, or that nobody is suddenly willing to take the other side of a normal volume of trades.
I find the POC lines really interesting. First, they tell us the price point where the most significant action (taking into account both price occurrences AND volume) during the bar occurred. Second, they can be useful when compared against past values. Third, their color helps us in figuring out which ones are the most significant. Unsurprisingly, bunches of orange POCs tend to appear in consolidation zones, in pauses, and before reversals. It may be useful to often focus more on POC progression than on `close` values. This is not to say that OHLC values are not useful; looking, as is customary, for higher highs or lower lows, or for repeated tests of precise levels can of course still be useful. I do like how POCs add another dimension to chart readings.
What should you do with the ticks delta above bars? Old-time ticker tape readers paid attention to the sounds coming from it (the "ticker" moniker actually comes from the sound they made). They knew activity was picking up when the frequency of the "ticks" increased. My thinking is that the total number of ticks will help you in the same way, since increasing updates usually mean growing interest—and thus perhaps price movement, as increasing volatility or volume would lead us to surmise. Ticks delta can help you figure out when proportionally large, random orders come in from traders with other perspectives than the short-term price action you are typically working with when you use this tool. Just as volume delta, ticks delta are one more informational component that can help you confirm convergence when building your opinions on price action.
What are strong bars? They are an attempt to identify significance. They are like a default marker, except that instead of displaying "Mx▲/▼" below/above the bar, the candle's body is outlined in bright bull/bear color when one is detected. Strong bars require a respectable amount of conditions to be met (you can see and re-configure them in the inputs). Think of them as pushes rather than indications of an upcoming, strong and multi-bar move. Pushes do, for sure, often occur at the beginning of strong trends. You will often see a few strong bars occur at 2-3 bar intervals at the beginning or middle of trends. But they also tend to occur at tops/bottoms, which makes their interpretation problematic. Another pattern that you will see quite frequently is a final strong bar in the direction of the trend, followed a few bars later by another strong bar in the reverse direction. My summary analyses seemed to indicate these were perhaps good points where one could make a bet on an early, risky reversal entry.
The last piece of information displayed by the indicator is the color of the candle bodies. Three possible colors are used. Bull/bear is determined by the polarity of DV, but only when the bar's polarity matches that of DV. When it doesn't, the color is the divergence color (orange, by default). Whichever color is used for the body, its intensity is determined by the DV% value. Maximum intensity occurs when DV%=100, so the more significant DV% values generate more noticeable colors. Body colors can be useful when looking to confirm the convergence of other components. The visual effect this creates hopefully makes it easier to detect patterns on the chart.
One obvious methodology that comes to mind to trade with this tool would be to use another indicator like Technical Ratings at a higher timeframe to identify the larger context's trend, and then use this tool to identify entries for short-term trades in that direction.
█ NOTES AND RAMBLINGS
Instant Calculations
This indicator uses instant values calculated on the bar only. No moving averages or calculations involving historical periods are used. The only exception to this rule is in some of the marker conditions like "Two consecutive DV+ values", where information from the previous bar is used.
Trading Small vs Long Timeframes
I never trade discretionary at the 5sec–5min timeframes this indicator was designed to be used with; I trade discretionary at 1D, 1W and 1M timeframes, and let systems trade at smaller timeframes. The higher the timeframe you trade at, the fewer fees you will pay because you trade less and are not churning trading volume, as is inevitable at smaller timeframes. Trading at higher timeframes is also a good way to gain an instant edge on most of the trading crowd that has its nose to the ground and often tends to forget the big picture. It also makes for a much less demanding trading practice, where you have lots of time to research and build your long-term opinions on potential future outcomes. While the future is always uncertain, I believe trades riding on long-term trends have stronger underlying support from the reality outside markets.
To traders who will ask why I publish an indicator designed for small timeframes, let me say that my main purpose here is to showcase what can be done with Pine. I often see comments by coders who are obviously not aware of what Pine is capable of in 2021. Since its humble beginnings seven years ago, Pine has grown and become a serious programming language. TradingView's growing popularity and its ongoing commitment to keep Pine accessible to newcomers to programming is gradually making Pine more and more of a standard in indicator and strategy programming. The technical barriers to entry for traders interested in owning their trading practice by developing their personal tools to trade have never been so low. I am also publishing this script because I value volume delta information, and I present here what I think is an original way of analyzing it.
Performance
The script puts a heavy load on the Pine runtime and the charting engine. After running the script for a while, you will often notice your chart becoming less responsive, and your chart tab can take longer to activate when you go back to it after using other tabs. That is the reason I encourage you to set the number of historical values displayed on bars to the minimum that meets your needs. When your chart becomes less responsive because the script has been running on it for many hours, refreshing the browser tab will restart everything and bring the chart's speed back up. You will then lose the information displayed on elapsed bars.
Neutral Volume
This script represents a departure from the way I have previously calculated volume delta in my scripts. I used the notion of "neutral volume" when inspecting intrabar timeframes, for bars where price did not move. No longer. While this had little impact when using intrabar inspection because the minimum usable timeframe was 1min (where bars with zero movement are relatively infrequent), a more precise way was required to handle realtime updates, where multiple consecutive prices often have the same value. This will usually happen whenever orders are unable to move across the bid/ask levels, either because of slow action or because a large-volume bid/ask level is taking time to breach. In either case, the proper way to calculate the polarity of volume delta for those updates is to use the last known polarity, which is how I calculate now.
The Order Book
Without access to the order book's levels (the depth of market), we are limited to analyzing transactions that come in the TradingView feed for the chart. That does not mean the volume delta information calculated this way is irrelevant; on the contrary, much of the information calculated here is not available in trading consoles supplied by exchanges/brokers. Yet it's important to realize that without access to the order book, you are forfeiting the valuable information that can be gleaned from it. The order book's levels are always in movement, of course, and some of the information they contain is mere posturing, i.e., attempts to influence the behavior of other players in the market by traders/systems who will often remove their orders when price comes near their order levels. Nonetheless, the order book is an essential tool for serious traders operating at intraday timeframes. It can be used to time entries/exits, to explain the causes of particular price movements, to determine optimal stop levels, to get to know the traders/systems you are betting against (they tend to exhibit behavioral patterns only recognizable through the order book), etc. This tool in no way makes the order book less useful; I encourage all intraday traders to become familiar with it and avoid trading without one.

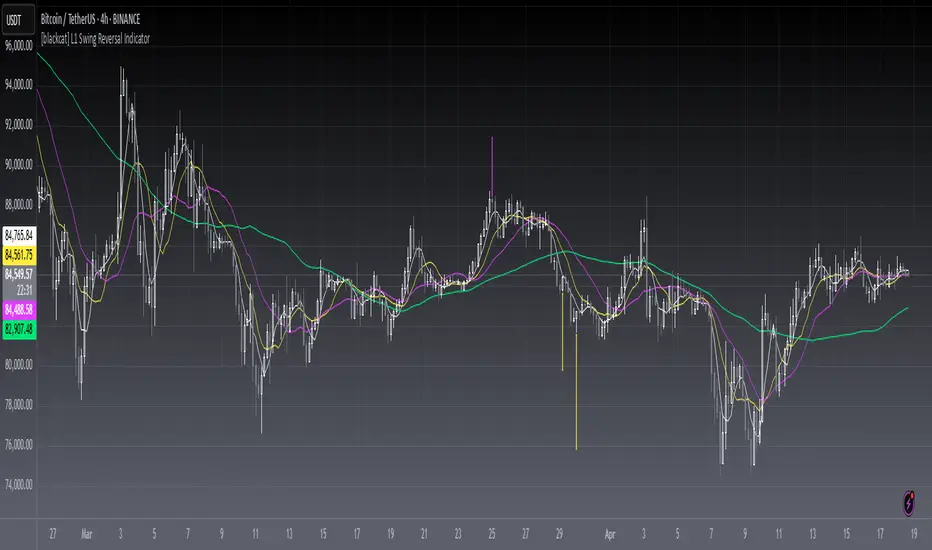
[blackcat] L1 Swing Reversal IndicatorLevel: 1
Background
Many asked me about swing reversal indicators. There are many but less of them can guarantee high win rate. Because market is complex, the reversals can be nested together, which means sub level reversals will be contained in higher level waves. This can be well explained by Elloit wave theory.
Function
Here it is a simple moving average based swing reversal indicator as an example for many others to improve it. Although it simple, it could be very powerful to dedicated trading pairs in specific time frame. One can adjust N1~N4 as SMA peiords from short to long to customized this indicator or even by trying different moving average types to enhance its accuracy.
Key Signal
N1~N4 --> SMA look back periods
OB --> Overbought Threshold
OS --> Oversold Threshold
Pros and Cons
Simpe but powerful. More feedbacks are appreciated.
Remarks
Easy to be customized or integrated to your trading system.
Readme
In real life, I am a prolific inventor. I have successfully applied for more than 60 international and regional patents in the past 12 years. But in the past two years or so, I have tried to transfer my creativity to the development of trading strategies. Tradingview is the ideal platform for me. I am selecting and contributing some of the hundreds of scripts to publish in Tradingview community. Welcome everyone to interact with me to discuss these interesting pine scripts.
The scripts posted are categorized into 5 levels according to my efforts or manhours put into these works.
Level 1 : interesting script snippets or distinctive improvement from classic indicators or strategy. Level 1 scripts can usually appear in more complex indicators as a function module or element.
Level 2 : composite indicator/strategy. By selecting or combining several independent or dependent functions or sub indicators in proper way, the composite script exhibits a resonance phenomenon which can filter out noise or fake trading signal to enhance trading confidence level.
Level 3 : comprehensive indicator/strategy. They are simple trading systems based on my strategies. They are commonly containing several or all of entry signal, close signal, stop loss, take profit, re-entry, risk management, and position sizing techniques. Even some interesting fundamental and mass psychological aspects are incorporated.
Level 4 : script snippets or functions that do not disclose source code. Interesting element that can reveal market laws and work as raw material for indicators and strategies. If you find Level 1~2 scripts are helpful, Level 4 is a private version that took me far more efforts to develop.
Level 5 : indicator/strategy that do not disclose source code. private version of Level 3 script with my accumulated script processing skills or a large number of custom functions. I had a private function library built in past two years. Level 5 scripts use many of them to achieve private trading strategy.
[blackcat] L2 Ehlers Early Onset TrendLevel: 2
Background
John F. Ehlers introuced Early Onset Trend Indicator in Aug, 2014.
Function
In “The Quotient Transform” in Aug, 2014, John Ehlers described an early trend detection method, the idea of the quotient transform, that was designed to reduce the lag often found in other trend indicators. I provided a script with pine v4 code here for the early-onset trend-detection indicator and also describes an approach for creating a strategy based on this indicator as an example.
The entry points displayed in blue on the price chart are defined by the top Onset Trend Detector upper quotient crossing above a threshold value e.g zero or 0.25/-0.25 here in this script. In the article, Ehlers suggested using a different K value for the exit, so the exit points are determined by the lower Onset Trend Detector quotient crossing below a threshold e.g. zero or -0.25/0.25 here in this script.
Key Signal
Quotient1 --> upper quotient in yellow which determines long entry
Quotient2 --> lower quotient in fuchsia which determines short entry
long ---> long entry signal
short ---> short entry signal
Pros and Cons
100% John F. Ehlers definition translation, even variable names are the same. This help readers who would like to use pine to read his book.
Remarks
The 82th script for Blackcat1402 John F. Ehlers Week publication.
Readme
In real life, I am a prolific inventor. I have successfully applied for more than 60 international and regional patents in the past 12 years. But in the past two years or so, I have tried to transfer my creativity to the development of trading strategies. Tradingview is the ideal platform for me. I am selecting and contributing some of the hundreds of scripts to publish in Tradingview community. Welcome everyone to interact with me to discuss these interesting pine scripts.
The scripts posted are categorized into 5 levels according to my efforts or manhours put into these works.
Level 1 : interesting script snippets or distinctive improvement from classic indicators or strategy. Level 1 scripts can usually appear in more complex indicators as a function module or element.
Level 2 : composite indicator/strategy. By selecting or combining several independent or dependent functions or sub indicators in proper way, the composite script exhibits a resonance phenomenon which can filter out noise or fake trading signal to enhance trading confidence level.
Level 3 : comprehensive indicator/strategy. They are simple trading systems based on my strategies. They are commonly containing several or all of entry signal, close signal, stop loss, take profit, re-entry, risk management, and position sizing techniques. Even some interesting fundamental and mass psychological aspects are incorporated.
Level 4 : script snippets or functions that do not disclose source code. Interesting element that can reveal market laws and work as raw material for indicators and strategies. If you find Level 1~2 scripts are helpful, Level 4 is a private version that took me far more efforts to develop.
Level 5 : indicator/strategy that do not disclose source code. private version of Level 3 script with my accumulated script processing skills or a large number of custom functions. I had a private function library built in past two years. Level 5 scripts use many of them to achieve private trading strategy.
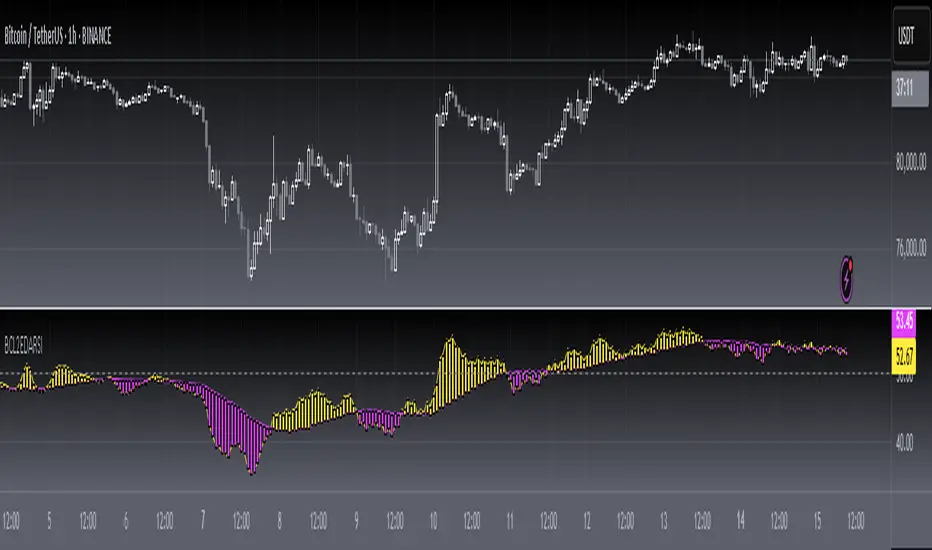
[blackcat] L2 Ehlers DFT-Adapted RSILevel: 2
Background
John F. Ehlers introuced his DFT-ADAPTED RELATIVE STRENGTH INDEX (RSI) in Jan, 2007.
Function
In "Fourier Transform For Traders" in Jan, 2007, John Ehlers presented an interesting technique of improving the resolution of spectral analysis that could be used to effectively measure market cycles. Better resolution is obtained by a surprisingly simple modification of the discrete Fourier transform. John Ehlers suggests using the discrete Fourier transform (DFT) to tune indicators. Here, I demonstrate this by building a DFT-adapted relative strength index (RSI) strategy.
Rather than display the RSI for a single cycle length across the entire chart, Ehlers DFT adaptive RSI value reflects the DFT-calculated dominant cycle length RSI. If the dominant cycle changes from 14 to 18 bars, the RSI length parameter changes accordingly. Computationally, this requires the strategy to continuously update values for all possible RSI cycle lengths via a "for" loop and array.
In details, a full-featured formula that implements a high-pass filter (HP) and a six-tap low-pass finite impulse response (FIR) filter on input, then does discrete Fourier transform calculations. I has taken liberty of adding extra parameters so the user can modify the analysis window length and the high-pass filter cutoff frequency in real time using the parameters window. Once the suite of possible RSI values is calculated, we use the DFT to select the relevant RSI for the current bar. The strategy then trades according to J. Welles Wilder's original rules for the RSI.
Key Signal
fastline--> DFT-ADAPTED RELATIVE STRENGTH INDEX (RSI) fast line
slowline--> DFT-ADAPTED RELATIVE STRENGTH INDEX (RSI) slow line
Pros and Cons
100% John F. Ehlers definition translation, even variable names are the same. This help readers who would like to use pine to read his book.
Remarks
The 71th script for Blackcat1402 John F. Ehlers Week publication.
Based on original work of Ehlers, I added ALMA smoothing on DFT-adapted relative strength index (RSI) so that clearer trend can be observed.
Readme
In real life, I am a prolific inventor. I have successfully applied for more than 60 international and regional patents in the past 12 years. But in the past two years or so, I have tried to transfer my creativity to the development of trading strategies. Tradingview is the ideal platform for me. I am selecting and contributing some of the hundreds of scripts to publish in Tradingview community. Welcome everyone to interact with me to discuss these interesting pine scripts.
The scripts posted are categorized into 5 levels according to my efforts or manhours put into these works.
Level 1 : interesting script snippets or distinctive improvement from classic indicators or strategy. Level 1 scripts can usually appear in more complex indicators as a function module or element.
Level 2 : composite indicator/strategy. By selecting or combining several independent or dependent functions or sub indicators in proper way, the composite script exhibits a resonance phenomenon which can filter out noise or fake trading signal to enhance trading confidence level.
Level 3 : comprehensive indicator/strategy. They are simple trading systems based on my strategies. They are commonly containing several or all of entry signal, close signal, stop loss, take profit, re-entry, risk management, and position sizing techniques. Even some interesting fundamental and mass psychological aspects are incorporated.
Level 4 : script snippets or functions that do not disclose source code. Interesting element that can reveal market laws and work as raw material for indicators and strategies. If you find Level 1~2 scripts are helpful, Level 4 is a private version that took me far more efforts to develop.
Level 5 : indicator/strategy that do not disclose source code. private version of Level 3 script with my accumulated script processing skills or a large number of custom functions. I had a private function library built in past two years. Level 5 scripts use many of them to achieve private trading strategy.
[blackcat] L2 Ehlers Hilbert Channel Breakout Trading SystemLevel: 2
Background
John F. Ehlers introuced Hilbert Channel Breakout Trading System in Nov, 2000.
Function
This indicator will show how the adaptive filter is being applied to a trading strategy. After the Hilbert Channel Breakout Signal is optimized, set the inputs for this indicator to match the corresponding inputs for the signal.
In the March 2000 STOCKS & COMMODITIES, John Ehlers published a algorithm for the Hilbert cycle period, an indicator that plots the length of the current market cycle. The Hilbert transform achieved computational efficiency by using a two-dimensional numbering system. Unfortunately, this introduces amplitude error in calculating the quadrature component. Dr. Ehlers compensated for this error. He have updated the method of compensating for the amplitude error by applying a straight-line compensation term using the frequency calculation from one bar ago. This is possible because the cycle period cannot change drastically from bar to bar. The slowly varying cycle period is adequate to do a good job of amplitude compensation.
In addition, Dr. Ehlers have used a different way to compute the cycle period. He used a homodyne discriminator because it exhibits superior performance in a low signal-to-noise environment. Homodyne means he used the signal multiplied by itself one bar ago to produce a zero-frequency beat note. This beat note carries the phase angle of the one-bar change. Still using the basic definition of a cycle, the one-bar rate of change of phase is exactly the cycle period.
Here is the pine v4 code to generate the signals in the Hilbert channel breakout trading system, as discussed in Dr. Ehlers article in this issue, "Optimizing With Hilbert Indicators." The signal itself is a simple channel breakout system that generates buy and exit signals, that shows whether the system is long or flat; the high of the bar and the value of the entry channel; and the low of the bar and the value of the exit channel. This helps you see on a bar-by-bar basis exactly how the system is behaving.
Key Signal
longcond--> when high breakouts EntryChannel to long
shortcond--> when low breakouts ExitChannel to short
Pros and Cons
100% John F. Ehlers definition translation, even variable names are the same. This help readers who would like to use pine to read his book.
Remarks
The 66th script for Blackcat1402 John F. Ehlers Week publication.
I tested it and believe it work better in small time frame e.g. 15m than large time frames.
Readme
In real life, I am a prolific inventor. I have successfully applied for more than 60 international and regional patents in the past 12 years. But in the past two years or so, I have tried to transfer my creativity to the development of trading strategies. Tradingview is the ideal platform for me. I am selecting and contributing some of the hundreds of scripts to publish in Tradingview community. Welcome everyone to interact with me to discuss these interesting pine scripts.
The scripts posted are categorized into 5 levels according to my efforts or manhours put into these works.
Level 1 : interesting script snippets or distinctive improvement from classic indicators or strategy. Level 1 scripts can usually appear in more complex indicators as a function module or element.
Level 2 : composite indicator/strategy. By selecting or combining several independent or dependent functions or sub indicators in proper way, the composite script exhibits a resonance phenomenon which can filter out noise or fake trading signal to enhance trading confidence level.
Level 3 : comprehensive indicator/strategy. They are simple trading systems based on my strategies. They are commonly containing several or all of entry signal, close signal, stop loss, take profit, re-entry, risk management, and position sizing techniques. Even some interesting fundamental and mass psychological aspects are incorporated.
Level 4 : script snippets or functions that do not disclose source code. Interesting element that can reveal market laws and work as raw material for indicators and strategies. If you find Level 1~2 scripts are helpful, Level 4 is a private version that took me far more efforts to develop.
Level 5 : indicator/strategy that do not disclose source code. private version of Level 3 script with my accumulated script processing skills or a large number of custom functions. I had a private function library built in past two years. Level 5 scripts use many of them to achieve private trading strategy.

[blackcat] L2 Ehlers FRAMALevel: 2
Background
John F. Ehlers introuced Fractal Adaptive Moving Average (FRAMA) in 2004.
Function
The objective of using filters is to separate the desired signals from the undesired signals (or noise). The practical application of moving averages often involves a tradeoff between the amount of smoothness required and the amount of lag that can be tolerated. Moving averages have this problem because the price data is not stationary, and may have different bandwidths over different time intervals. Various momentum-adaptive filtering techniques have been developed to take advantage of the nonstationary structure of prices. Adaptive filters have also been developed based on price statistics and the cyclic content of the price data . Dr. Ehlers described a different class of filters that monitor a different measure of temporal nonstationarity and alters their bandwidth in response to this measure.
There is no argument that market prices are fractal. Fractal shapes are self-similar because they tend to have the same roughness and sparseness regardless of the magnification used to view them. If you remove the labels from a 5 minute chart, a daily chart, and a weekly chart you would have difficulty telling them apart. This is the characteristic that makes them fractal. The self-similarity can be defined by the fractal dimension that describes the sparseness at all magnification levels.
To determine the fractal dimension of a generalized pattern, Dr. Ehlers cover the pattern with a number “N” of small objects of several various sizes “s”. As with any moving average, we are forced to compromise between responsiveness and smoothness. FRAMA can be a valuable weapon in your arsenal of technical indicators. It rapidly follows significant changes in price but becomes very flat in congestion zones so that bad whipsaw trades can be eliminated.
Key Signal
Filt --> FRAMA fast line
Trigger --> FRAMA slow line
Pros and Cons
100% John F. Ehlers definition translation, even variable names are the same. This help readers who would like to use pine to read his book.
Remarks
The 63th script for Blackcat1402 John F. Ehlers Week publication.
Readme
In real life, I am a prolific inventor. I have successfully applied for more than 60 international and regional patents in the past 12 years. But in the past two years or so, I have tried to transfer my creativity to the development of trading strategies. Tradingview is the ideal platform for me. I am selecting and contributing some of the hundreds of scripts to publish in Tradingview community. Welcome everyone to interact with me to discuss these interesting pine scripts.
The scripts posted are categorized into 5 levels according to my efforts or manhours put into these works.
Level 1 : interesting script snippets or distinctive improvement from classic indicators or strategy. Level 1 scripts can usually appear in more complex indicators as a function module or element.
Level 2 : composite indicator/strategy. By selecting or combining several independent or dependent functions or sub indicators in proper way, the composite script exhibits a resonance phenomenon which can filter out noise or fake trading signal to enhance trading confidence level.
Level 3 : comprehensive indicator/strategy. They are simple trading systems based on my strategies. They are commonly containing several or all of entry signal, close signal, stop loss, take profit, re-entry, risk management, and position sizing techniques. Even some interesting fundamental and mass psychological aspects are incorporated.
Level 4 : script snippets or functions that do not disclose source code. Interesting element that can reveal market laws and work as raw material for indicators and strategies. If you find Level 1~2 scripts are helpful, Level 4 is a private version that took me far more efforts to develop.
Level 5 : indicator/strategy that do not disclose source code. private version of Level 3 script with my accumulated script processing skills or a large number of custom functions. I had a private function library built in past two years. Level 5 scripts use many of them to achieve private trading strategy.

[blackcat] L2 Ehlers Optimum PredictorLevel: 2
Background
John F. Ehlers introuced Optimum Predictor in his "Rocket Science for Traders" chapter 20 on 2001.
Function
As we have seen before, the majority of the code involves the computation of the period using the Homodyne Discriminator algorithm. Once the period has
been computed, the Optimum Predictor is found in just a few lines of code. First, the minimum-length Hilbert Transformer is used to compute the Detrender2 value from the prices that have been smoothed by the 4-bar Weighted Moving Average (WMA). Detrender2 is smoothed in the 4-bar WMA to produce Smooth2. The alpha of the EMA is computed from the computed period, and the EMA of Smooth2 is taken using that alpha and is called the DetrendEMA. The difference between Smooth2 and the
DetrendEMA is multiplied by 1.4 to produce the Predict phasor. Finally, the Smooth2 and Predict phasors are plotted as indicators.
The Optimum Predictor is plotted as the subgraph below the price chart. Buy and sell signals occur when the Predict and Smooth2 lines cross. Based on Dr. Ehlers comments, most of these signals are indeed prescient. The Optimum Predictor could probably work best in trading systems when used in conjunction with other
rules to eliminate the false signals.
Key Signal
Smooth --> 4 bar WMA w/ 1 bar lag
Detrender --> The amplitude response of a minimum-length HT can be improved by adjusting the filter coefficients by
trial and error. HT does not allow DC component at zero frequency for transformation. So, Detrender is used to remove DC component/ trend component.
Q1 --> Quadrature phase signal
I1 --> In-phase signal
Period --> Dominant Cycle in bars
SmoothPeriod --> Period with complex averaging
Predict --> fast line of optimum predictor
Smooth2 --> slow line of optimum predictor
Pros and Cons
100% John F. Ehlers definition translation of original work, even variable names are the same. This help readers who would like to use pine to read his book. If you had read his works, then you will be quite familiar with my code style.
Remarks
The 16th script for Blackcat1402 John F. Ehlers Week publication.
Readme
In real life, I am a prolific inventor. I have successfully applied for more than 60 international and regional patents in the past 12 years. But in the past two years or so, I have tried to transfer my creativity to the development of trading strategies. Tradingview is the ideal platform for me. I am selecting and contributing some of the hundreds of scripts to publish in Tradingview community. Welcome everyone to interact with me to discuss these interesting pine scripts.
The scripts posted are categorized into 5 levels according to my efforts or manhours put into these works.
Level 1 : interesting script snippets or distinctive improvement from classic indicators or strategy. Level 1 scripts can usually appear in more complex indicators as a function module or element.
Level 2 : composite indicator/strategy. By selecting or combining several independent or dependent functions or sub indicators in proper way, the composite script exhibits a resonance phenomenon which can filter out noise or fake trading signal to enhance trading confidence level.
Level 3 : comprehensive indicator/strategy. They are simple trading systems based on my strategies. They are commonly containing several or all of entry signal, close signal, stop loss, take profit, re-entry, risk management, and position sizing techniques. Even some interesting fundamental and mass psychological aspects are incorporated.
Level 4 : script snippets or functions that do not disclose source code. Interesting element that can reveal market laws and work as raw material for indicators and strategies. If you find Level 1~2 scripts are helpful, Level 4 is a private version that took me far more efforts to develop.
Level 5 : indicator/strategy that do not disclose source code. private version of Level 3 script with my accumulated script processing skills or a large number of custom functions. I had a private function library built in past two years. Level 5 scripts use many of them to achieve private trading strategy.

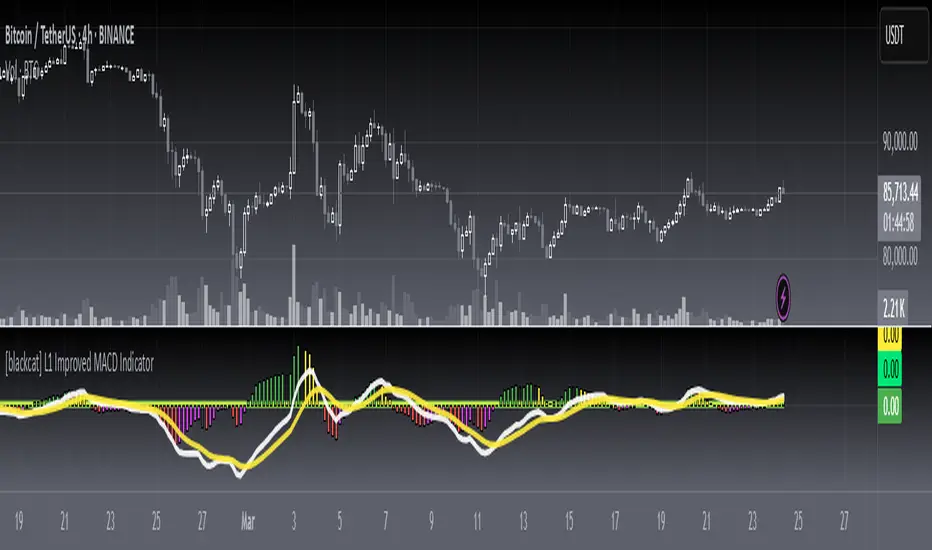
[blackcat] L1 Improved MACD IndicatorLevel: 1
Background
The MACD is a superior derivative of moving average crossovers and was developed by Gerald Appel in 1979 as a market timing tool. MACD uses two exponential moving averages with different bar periods, which are then subtracted to form what Mr. Appel calls the Fast Line. A 9-period moving average of the fast line creates the slow line.
Function
L1 Improved MACD Indicator mainly improves MACD histogram by customized an algorithm and add three levels of long entry alerts derived from ema().
Key Signal
buy1 --> the 1st level of buy alert in green
buy2 --> the 2nd level of buy alert in lime
buy3 --> the 3rd level of buy alert in yellow
diff --> classic MACD diff fast line in white
dea --> classic MACD dea slow line in yellow
macd --> classic difference histogram,but I did not use it directly in the plot.
Pros and Cons
Pros:
1. more clear sub level trend change with new histograms
2. three levels of buy alerts
Cons:
1. need sophisticated knowledge of MACD to use this well
2. this still requires a lot of MACD experience to obtain reliable trading signals
Remarks
I am a fan of MACD. Even the most classic MACD can have in-depth usage. I think MACD is the king of indicators.
Readme
In real life, I am a prolific inventor. I have successfully applied for more than 60 international and regional patents in the past 12 years. But in the past two years or so, I have tried to transfer my creativity to the development of trading strategies. Tradingview is the ideal platform for me. I am selecting and contributing some of the hundreds of scripts to publish in Tradingview community. Welcome everyone to interact with me to discuss these interesting pine scripts.
The scripts posted are categorized into 5 levels according to my efforts or manhours put into these works.
Level 1 : interesting script snippets or distinctive improvement from classic indicators or strategy. Level 1 scripts can usually appear in more complex indicators as a function module or element.
Level 2 : composite indicator/strategy. By selecting or combining several independent or dependent functions or sub indicators in proper way, the composite script exhibits a resonance phenomenon which can filter out noise or fake trading signal to enhance trading confidence level.
Level 3 : comprehensive indicator/strategy. They are simple trading systems based on my strategies. They are commonly containing several or all of entry signal, close signal, stop loss, take profit, re-entry, risk management, and position sizing techniques. Even some interesting fundamental and mass psychological aspects are incorporated.
Level 4 : script snippets or functions that do not disclose source code. Interesting element that can reveal market laws and work as raw material for indicators and strategies. If you find Level 1~2 scripts are helpful, Level 4 is a private version that took me far more efforts to develop.
Level 5 : indicator/strategy that do not disclose source code. private version of Level 3 script with my accumulated script processing skills or a large number of custom functions. I had a private function library built in past two years. Level 5 scripts use many of them to achieve private trading strategy.
L1 Mid-Term Swing Oscillator v1Level: 1
Background
Oscillators are widely used set of technical analysis indicators. They are popular primarily for their ability to alert of a possible trend change before that change manifests itself in price and volume . They should work best in times of sideways markets.
Function
L1 Short-Mid-Long-Term Swing Oscillator puts three terms of oscillators to cover short-term, middle-term and long-term oscillators at the same time. By resonating all these three oscillators, short-term scalping signal and middle term swing signal are disclosed. You can see both short and mid term signal under one indicator which give you more confidence to follow the trend.
Key Signal
I didn't handle the key signals well. I piled up all the useful signals I found, and it is really difficult to classify them one by one. I feel tired when I think about this problem. Therefore, the code of the overall signal is rather confusing, sorry.
Pros and Cons
Pros:
1. Three oscillators are used to cover short, mid, long term oscillations.
2. Short-Mid term resonance can be observed to have higher confidence level.
3. Use single indicator for scalping and swing trading is possible.
Cons:
1. No deep dive into very accurate long and short entries.
2. A trade off between sensitivity and stability may be needed by traders' subjective judge.
Remarks
I enjoyed the fun of put three different oscillator together to cover short, mid, long terms. But how to use them perfectly is really more brainstorming.
Readme
In real life, I am a prolific inventor. I have successfully applied for more than 60 international and regional patents in the past 12 years. But in the past two years or so, I have tried to transfer my creativity to the development of trading strategies. Tradingview is the ideal platform for me. I am selecting and contributing some of the hundreds of scripts to publish in Tradingview community. Welcome everyone to interact with me to discuss these interesting pine scripts.
The scripts posted are categorized into 5 levels according to my efforts or manhours put into these works.
Level 1 : interesting script snippets or distinctive improvement from classic indicators or strategy. Level 1 scripts can usually appear in more complex indicators as a function module or element.
Level 2 : composite indicator/strategy. By selecting or combining several independent or dependent functions or sub indicators in proper way, the composite script exhibits a resonance phenomenon which can filter out noise or fake trading signal to enhance trading confidence level.
Level 3 : comprehensive indicator/strategy. They are simple trading systems based on my strategies. They are commonly containing several or all of entry signal, close signal, stop loss, take profit, re-entry, risk management, and position sizing techniques. Even some interesting fundamental and mass psychological aspects are incorporated.
Level 4 : script snippets or functions that do not disclose source code. Interesting element that can reveal market laws and work as raw material for indicators and strategies. If you find Level 1~2 scripts are helpful, Level 4 is a private version that took me far more efforts to develop.
Level 5 : indicator/strategy that do not disclose source code. private version of Level 3 script with my accumulated script processing skills or a large number of custom functions. I had a private function library built in past two years. Level 5 scripts use many of them to achieve private trading strategy.

CPR with SMA, EMA, VWAP & Super Trend by GuruprasadMeduriThis script will allow to add CPR with Standard Pivots and 4 Indicators.
Standard Pivot has 9 levels of support and 9 levels of resistance lines. It has CPR , 3 levels of Day-wise pivots , 3 levels of Weekly pivots and 3 Levels of Monthly Pivots .
In Addition to the CPR and Pivot, this script will allow user to Add 4 more Indicators - SMA, EMA, VWAP and SuperTrend as well.
All the Support and resistance levels can be enabled / disabled from settings. It will allow to select multiple combinations of support and resistance levels across 3 levels at any of the 3 time-frames individually and combined.
All 4 Indicators can be can be enabled / disabled from settings. This will allow the indicators to be plotted individually and combined along with any combination of CPR & Pivots.
These number of combinations will allow user to visualize the charts with desired indicators, pivot support & resistance levels on all or any of the 3 time frames.
For Ease of access, listed few points on how the script works..
- CPR and day-wise level 1 & 2 (S1 & R1) enabled by default and can be changed from settings
- Day-wise Level 2 & 3 (S2, R2, S3 & L3) can be enabled from settings
- Weekly 3 levels and Monthly 3 levels can be enabled from settings
- CPR & pivot levels colored in blue lines
- All support levels colored in Green
- All resistance levels Colored in Red
- Day-wise pivot , support & resistance are straight lines
- Weekly pivot , support & resistance are cross (+) lines
- Weekly pivot , support & resistance are circle (o) lines
- SMA, EMA, VWAP and SuperTrend Enabled by Default
- SMA Colored in Orange
- EMA Colored in Red
- EMA Colored in Teal
- SuperTrend Colored in standard Red & Green with triangle arrows
- Any combinations can be selected from settings-> Inputs & style

FVE - Finite Volume Elements [UTS]FVE is a money flow indicator but with two important differences from existing money flow indicators:
It resolves contradictions between intraday money flow indicators (such as Chaikin’s money flow) and interday money flow indicators (like On Balance Volume) by taking into account both intra- and interday price action.
Unlike other money flow indicators which add or subtract all volume even if the security closed just 1 cent higher than the previous close, FVE uses a volatility threshold to take into account minimal price changes.
General Usage
The FVE provides 3 types of signals:
The strongest signal is divergence between price and the indicator. Divergence can provide leading signals of breakouts or warnings of impending corrections. The classic method for detecting divergence is for FVE to make lower highs while price makes higher highs (negative divergence). An alternative method is to draw the linear regression line on both charts, and compare the slopes. A logical buy signal would be for FVE, diverging from price, to rise sharply and make a series higher highs and/or higher lows.
The most obvious and coincident signal is the slope of the FVE line. An upward slope indicates that the bulls are in control and the opposite for downward.
This is a unique and very important property of this indicator. Values above zero are bullish and indicate accumulation while values below zero indicate distribution. FVE crossing the zero line indicates that the short to intermediate balance of power is changing from the bulls to the bears or vice versa. The best scenario is when a stock is in the process of building a base, and FVE diverges from price and rises to cross the zero line from below, at a sharp angle. Conversely the crossing of the zero line from above is a bearish signal to liquidate positions or initiate a short trade.
Trend Visualisation
Optional: If the trend direction is DOWN the moving average is painted red. If the trend direction is UP the moving average is painted in green.
If the movement is FLAT then the color is grey.
Moving Averages
Five different types of Moving Averages are available for both FVE and the optional moving average of the FVE.
ALMA (Arnaud Legoux Moving Average)
Average Value
EMA (Exponential Moving Average)
SMA (Simple Moving Average)
WMA (Weighted Moving Average)
Calculation Methods
Since Markos Katsanos presented the first version of the FVE in April 2003.
Since then there have been various adaptions and improvements on this indicator.
The following are choosable for calculating the FVE:
Thinkscript usethinkscript.com
Linnsoft www.linnsoft.com
Volatility Adapted traders.com